Abstract
Molecules that inhibit the formation of an abnormal isoform of prion protein (PrPSc) in prion-infected cells are candidate therapeutic agents for prion diseases. Understanding how these molecules inhibit PrPSc formation provides logical basis for proper evaluation of their therapeutic potential. In this study, we extensively analyzed the effects of the anti-PrP monoclonal antibody (mAb) 44B1, pentosan polysulfate (PPS), chlorpromazine (CPZ) and U18666A on the intracellular dynamics of a cellular isoform of prion protein (PrPC) and PrPSc in prion-infected mouse neuroblastoma cells to re-evaluate the effects of those agents. MAb 44B1 and PPS rapidly reduced PrPSc levels without altering intracellular distribution of PrPSc. PPS did not change the distribution and levels of PrPC, whereas mAb 44B1 appeared to inhibit the trafficking of cell surface PrPC to organelles in the endocytic-recycling pathway that are thought to be one of the sites for PrPSc formation. In contrast, CPZ and U18666A initiated the redistribution of PrPSc from organelles in the endocytic-recycling pathway to late endosomes/lysosomes without apparent changes in the distribution of PrPC. The inhibition of lysosomal function by monensin or bafilomycin A1 after the occurrence of PrPSc redistribution by CPZ or U18666A partly antagonized PrPSc degradation, suggesting that the transfer of PrPSc to late endosomes/lysosomes, possibly via alteration of the membrane trafficking machinery of cells, leads to PrPSc degradation. This study revealed that precise analysis of the intracellular dynamics of PrPC and PrPSc provides important information for understanding the mechanism of anti-prion agents.
Introduction
Prion diseases are neurodegenerative disorders of mammals that include scrapie in sheep, bovine spongiform encephalopathy (BSE), chronic wasting disease (CWD) in Cervidae, and Creutzfeldt–Jakob disease (CJD) in humans [1]. In prion diseases, an abnormal isoform of prion protein (PrPSc) accumulates in the central nervous system (CNS). PrPSc is a major component of prion, the causative agent of prion diseases, and generated by conversion of a cellular isoform of prion protein (PrPC) encoded by the host Prnp gene. The generation and accumulation of PrPSc in CNS play a crucial role in the progression of pathogenesis. Prion diseases have long incubation periods ranging from months to years; however, once clinical signs appear, the diseases are subacutely progressive and invariably fatal.
There is a great desire for the establishment of therapeutics for prion diseases. Various experimental approaches including pharmacotherapy, immunotherapy, and cell-therapy have been reported. One of the major targets of the therapeutics is believed to be the inhibition of PrPSc formation or acceleration of PrPSc degradation, although protection of neurons from neurotoxic conditions and/or regeneration of damaged neurons are also therapeutic target [2]–[4]. To date, numerous compounds have been reported to inhibit PrPSc formation in cells persistently infected with prions, and a few of them showed prolonged survival time in mouse models, particularly treatments that were initiated in the middle or late stages of prion infection [5]. Moreover, clinical trials of some compounds such as pentosan polysulfate (PPS), doxycycline, and quinacrine, which have been reported to inhibit PrPSc formation in vivo and in vitro, have been conducted in patients with human prion diseases. However, no compounds have shown significant improvement in survival or clinical features in humans [6]–[10].
The logical basis of the effect of anti-prion compounds are important in the development of pharmacotherapy for prion diseases. Many compounds, such as sulfated glycans, polyanions, polyene antibiotics, tricyclic or tetracyclic compounds, PrP peptides, small interfering RNAs and anti-PrP antibodies, have been shown to prevent PrPSc formation by blocking the interaction between PrPC and PrPSc, possibly by direct binding to either PrPC or PrPSc, by interference of accessory molecules required for the interaction, by reduction of PrPC expression or by alteration of PrPC distribution [11]. The inhibitors of cholesterol synthesis such as lovastatin, squalestatin, and U18666A are also considered to interfere with PrPSc formation by changing the distribution of either PrPC or PrPSc via alteration of cholesterol metabolism [12]–[14]. In contrast, cationic polyamines [15] and autophagy inducers such as lithium, trehalose, FK506, and tamoxifen are reported to eliminate PrPSc from cells by enhancing the degradation of PrPSc [16]–[19].
Although the preceding reports have shown the effects of anti-prion compounds on PrPSc formation, the precise cellular mechanisms of the inhibition of PrPSc formation remain to be elucidated. Clarification of the intracellular dynamics of PrPC and PrPSc in prion-infected cells treated with the compounds aids the understanding of precise anti-prion mechanisms. In this study, we established a method that can simultaneously detect PrPC and PrPSc in an immunofluorescence assay (IFA) by modifying a previously reported PrPSc-specific staining method [20]. Using this method, we compared the effects of four anti-prion compounds, anti-PrP antibody, PPS, chlorpromazine (CPZ), and U18666A, focusing on the kinetics of PrPSc formation and intracellular dynamics of PrPC and PrPSc.
Materials and Methods
Antibodies and regents
Anti-PrP mouse monoclonal antibodies (mAbs) 31C6 and 132 were used to detect PrP [21]. MAb 44B1, which is known to reduce PrPSc levels in prion-infected cells, was used as one of the anti-prion compounds [22]. Anti-Lamp1 rat mAb (Beckman Coulter, 1D4B), anti-sorting nexin 1 (Snx1) rabbit polyclonal antibodies (Proteintech Group, 10304-1-AP), anti-LC3 rabbit polyclonal antibodies (Medical & Biological Laboratories Co., Ltd, PM036), and anti-early endosome antigen 1 (EEA1) rabbit mAb (Cell Signaling Technology, C45B10) were used for IFA. Anti-β-actin mAb (Sigma, AC-15), anti-cathepsin D rabbit polyclonal antibodies (BioVision, 3191R-100) and anti-GAPDH rabbit polyclonal antibodies (Millipore, ABS16) were used for immunoblotting or dot-blotting. Alexa Fluor 488-conjugated goat F(ab′)2 fragment anti-mouse IgG, Alexa Fluor 488- and 555-conjugated goat F(ab′)2 fragment anti-rabbit IgG and Alexa Fluor 555 conjugated goat IgG anti-rat IgG (Life Technologies) were used as secondary antibodies for IFA. Alexa Fluor 555-labeled mAb 31C6 (31C6-Af555) was prepared using the Alexa Fluor 555 Monoclonal Antibody Labeling Kit (Life Technologies) according to the manufacturer’s instructions. Fab fragments of mAb 31C6 genetically conjugated with human placental alkaline phosphatase (31C6Fab-PLAP, A.S. and M.H., unpublished) were used for the direct detection of PrP by immunoblotting and dot-blotting. MAb 132 genetically conjugated with enhanced green fluorescent protein (EGFP) at the C-terminus of the heavy chain (rIgG132-EGFP, A.S. and M.H., unpublished) was used for the direct immunostaining of PrPSc by IFA. Anti-β-actin mAb conjugated with peroxidase by using Peroxidase Labeling Kit-NH2 (Dojindo Molecular Technologies) was used for the direct detection of β-actin by immunoblotting. PPS was purchased from Dainippon Sumitomo Pharma. CPZ, U18666A, monensin (Mon), and bafilomycin A1 (BafA1) were purchased from Sigma-Aldrich. Alexa Fluor 488-conjugated acetylated low-density lipoprotein (LDL) was purchased from Life Technologies.
Cell culture
N2a-3 cells, a subclone of the mouse neuroblastoma cell line Neuro2a [23], and N2a-3 cells persistently infected with the 22L prion strain (ScN2a-3-22L [24]) were used.
Treatment of cells with anti-prion compounds
N2a-3 cells or ScN2a-3-22L cells were plated in 6- or 12-well plates (Thermo Scientific) or on 8-well Lab-Tek II chambered coverglass (Thermo Scientific) at a 1∶10 ratio. The cells were cultured in Dulbecco’s modified Eagle’s medium (DMEM; ICN Biomedicals) containing 10% fetal bovine serum (FBS; Gibco), 1% non-essential amino acids (NEAAs; Life Technologies), and penicillin (100 U/ml) streptomycin (100 µg/ml) (Life Technologies) at 37°C in a 5% CO2 atmosphere for 24 h in 6- or 12-well plates or for 48 h on 8-well Lab-Tek II chambered coverglass. Subsequently, the culture medium was replaced with DMEM containing 10% FBS, 1% NEAAs and each anti-prion compound. The cells were cultured up to 72 h in the presence of each anti-prion compound, and then subjected to immunoblotting, dot-blotting or IFA.
Immunoblotting
Cells grown on 6- or 12-well plate were lysed in lysis buffer [23]. Preparation of samples to monitor proteinase K (PK)-resistant PrPSc (PrP-res) or other molecules, SDS-PAGE and immunoblotting were performed as previously described [23], [24].
Dot-blotting
To monitor PrPC, PrP-res or GAPDH, the cell lysate equivalent to 40 µg of total protein was transferred onto a polyvinylidene difluoride (PVDF) membrane using a dot-blotter (Bio-Rad). To detect PrP-res, the PVDF membrane was treated with 20 µg/ml PK for 1 h at 37°C and subsequently incubated with 1 mM Pefabloc SC for 15 min at 4°C. The membrane was treated with 50 µg/ml DNase I for 15 min at room temperature (rt) and subsequently incubated in 3 M guanidine thiocyanate (GdnSCN) for 30 min at rt. For the direct immunodetection of PrP, the PVDF membrane was incubated with 31C6Fab-PLAP (42 ng/ml) in 1% skim milk-PBS containing 0.1% Tween 20 (PBST) at 4°C overnight. The chemiluminescence detection was conducted using CDP-Star (Applied Biosystems) according to the manufacturer’s instructions. For the detection of GAPDH, the PVDF membrane was incubated with anti-GAPDH rabbit polyclonal antibodies (2 µg/ml) in 1% skim milk-PBST at rt for 2 h followed by an incubation with anti-rabbit IgG Horseradish Peroxidase F(ab’)2 fragment (GE Healthcare). The chemiluminescence detection was carried out as described [23], [24].
IFA
IFA was performed as previously described [25]. For the direct staining of PrPSc, cells were incubated with rIgG132-EGFP (2 µg/ml) at 4°C overnight. For the double staining of PrPC and PrPSc, cells treated with 4% paraformaldehyde and 0.1% Triton X-100 were blocked with 5% FBS and incubated with 31C6-Af555 (2 µg/ml) at 4°C overnight. The cells were washed with PBS and subsequently fixed again with 4% paraformaldehyde in PBS for 10 min. The cells were treated with 5 M GdnSCN for 10 min and subsequently incubated with rIgG132-EGFP (2 µg/ml) at 4°C overnight. Nuclei were counterstained with 5 µg/ml 4′,6-diamidino-2-phenylindole, dilactate (DAPI; Life Technologies) in PBS at rt for 30 min. Finally, the media chamber was filled with PBS and confocal fluorescent images were acquired with a ×63 objective lens on a Zeiss LSM700 inverted microscope and ZEN 2009 software. Z-series of the images were taken at 0.8-µm steps from the top to the bottom of the cells in the area.
Co-localization statistics
Quantitative co-localization analysis of PrPSc with organelle markers was performed as previously described [25]. The co-localization ratio that represents a percentage of the voxels of PrPSc signals co-localized with signals of each organelle marker relative to the total voxels of PrPSc signals was quantified using the Coloc module in IMARIS software (Bitplane).
Measurement of PrPSc or LDL fluorescence intensity in Lamp1-positive vesicles
Acquired Z-series of the multichannel images were reconstructed to a three-dimensional image by the IMARIS software. The isosurface models of Lamp1-positive vesicles were created by the Surpass module in the IMARIS software and the signals of PrPSc or LDL in the isosurface of Lamp1-positive vesicles were extracted. The intensity of the signals of PrPSc or LDL per cell were calculated by dividing the total intensities of the signals by the total number of cells in the view field.
Results
Effect of anti-prion compounds on the amount of PrPSc
We chose four anti-prion compounds, mAb 44B1, PPS, CPZ and U18666A. The mAb 44B1 is reported to inhibit the internalization of PrPC [22], and PPS is reported to inhibit the binding of PrPC to PrPSc or alter the intracellular trafficking of PrPC and/or PrPSc [26]. CPZ is a derivative of a tricyclic compound which causes the redistribution of cholesterol from the plasma membrane to intracellular compartments [14]. U18666A interferes with the intracellular trafficking involved in the recycling of cholesterol between the plasma membrane and intracellular compartments [27], [28].
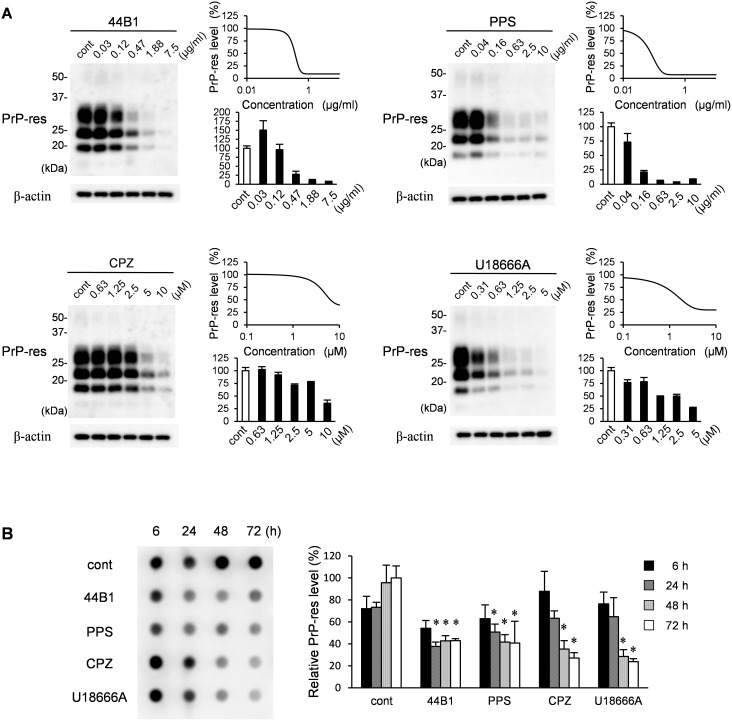
First, we re-evaluated the effect of these compounds on the formation of PrP-res in ScN2a-3-22L cells, which are persistently infected with the 22L prion strain. All compounds were confirmed to reduce PrP-res levels in ScN2a-3-22L cells in a concentration-dependent manner after 72 h of treatment (Fig. 1A). Next, we analyzed the kinetics of PrP-res levels in cells treated with each compound at an effective concentration that decreased PrP-res levels by 65% after 72 h of treatment (EC65 was estimated by concentration-effect curves in Fig. 1A). Compared with the mock-treated control at each time point, mAb 44B1 or PPS significantly decreased PrP-res levels 24 h after the initiation of the treatment (Fig. 1B). In contrast, significant decrease in PrP-res levels were observed after 48 h of CPZ or U189666A treatment (p<0.05). During 72 h of the treatments, any of the compounds did not show apparent adverse effects on cell viability: the cell viabilities went up during first 48 h-treatment and then reached plateau levels (Fig. S1). This result suggests that the reduction of PrP-res was not due to the cytotoxic effects of the compounds.
Figure 1. Influence of anti-prion compounds on the amount of PrP-res.
(A) ScN2a-3-22L cells grown on 12-well plates were cultured in the presence or absence of mAb 44B1, PPS, CPZ, or U18666A at the indicated concentration for 72 h. The samples were subjected to immunoblotting and dot-blotting for PrP-res detection or β-actin detection for endogenous control. Representative blots for each compound are shown on the left. The graph on the right shows PrP-res levels relative to the control samples. The means and standard deviations (SDs) of four independent experiments (PrP-res was detected by dot-blotting) are indicated. Graphs on the upper right show the logistic curve fitted to the data of PrP-res levels by dot-blotting (B) ScN2a-3-22L cells were cultured with anti-prion compounds at the EC65 (mAb 44B1, 0.4 µg/ml; PPS, 0.1 µg/ml; CPZ, 10 µM; U18666A, 5 µM) for the indicated time and subjected to dot-blotting for PrP-res. Representative dot-blotting is shown on the left, and the graph on the right shows the levels of PrP-res relative to the samples from ScN2a-3-22L cells cultured without anti-prion compounds for 72 h. The means and SDs of four independent experiments are depicted. Asterisks indicate a significant difference compared with the control at the same time point (Student’s t-test, p<0.05).
Effect of anti-prion compounds on the localization of PrPSc
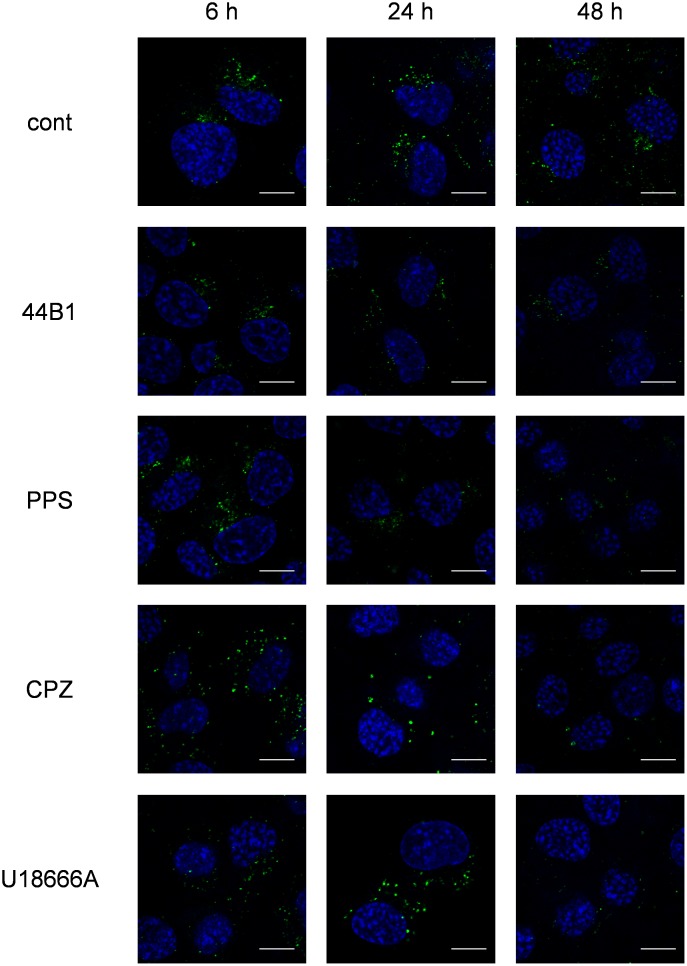
To elucidate the intracellular events involved in the reduction of PrPSc, we analyzed the intracellular localization of PrPSc in ScN2a-3-22L cells treated with the compounds for up to 48 h. To avoid the reaction of secondary antibodies to mAb 44B1, direct immunostaining of PrPSc was performed using the EGFP-tagged mAb 132 (rIgG132-EGFP). As previously reported [20], PrPSc in mock-treated cells mainly clustered in peri-nuclear regions of the cells (Fig. 2). Treatment with mAb 44B1 or PPS did not change the localization of PrPSc, but it reduced the signal intensity of PrPSc by 24 h (Fig. 2). In contrast, PrPSc in cells treated with CPZ or U18666A appeared to be dispersed throughout cytoplasm after 6 h of treatment (Fig. 2). Moreover, larger granular staining of PrPSc was observed in the cytoplasm after 24 h of CPZ or U18666A treatment, and the intensities of the granular PrPSc were decreased after an additional 24 h (Fig. 2).
Figure 2. Influence of anti-prion compounds on the intracellular PrPSc distribution.
ScN2a-3-22L cells grown on a chambered coverglass for 48 h were cultured with or without an anti-prion compound at the EC65 (mAb 44B1, 0.4 µg/ml; PPS, 0.1 µg/ml; CPZ, 10 µM; U18666A, 5 µM) for 6, 24, or 48 h. The cells were subjected to PrPSc-specific detection by direct immunostaining with rIgG132-EGFP. The cell nuclei were counterstained with DAPI. The panels show the merged images of PrPSc (green) and nuclei (blue). Scale bars: 10 µm.
Effect of anti-prion compounds on PrPC metabolism
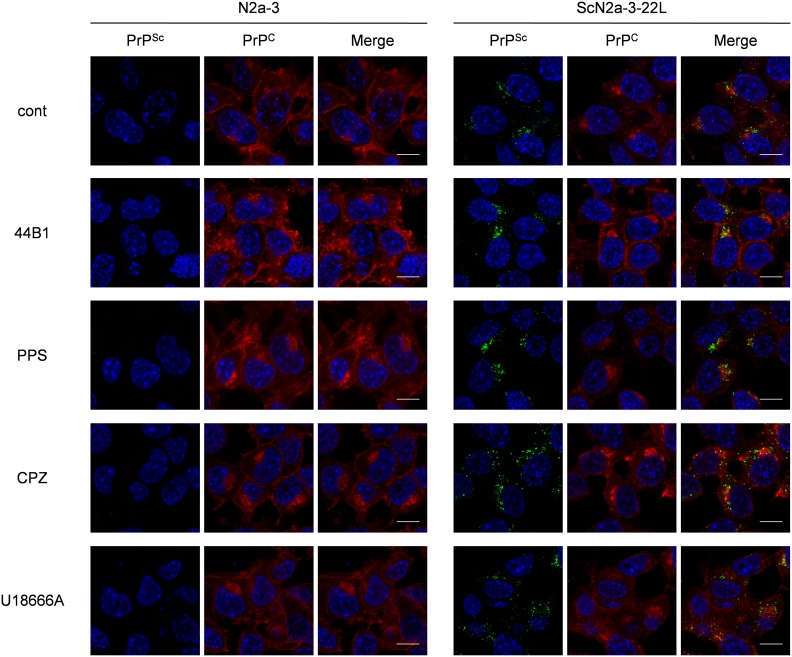
Next, we analyzed the distributions of PrPC in ScN2a-3-22L cells treated with the anti-prion compounds. For the simultaneous staining of PrPC and PrPSc, mAb 31C6 conjugated with Alexa Fluor 555 (31C6-Af555) was first incubated with fixed ScN2a-3-22L cells to stain PrPC. After staining with 31C6-Af555, the cells were fixed again and treated with 5 M GdnSCN for PrPSc-specific staining with rIgG132-EGFP. Only a few signals of PrP stained with 31C6-Af555 were co-localized with PrPSc signals stained with rIgG132-EGFP in ScN2a-3-22L cells (Fig. S2), suggesting that most of the signals stained with 31C6-Af555 were derived from PrPC and, if any, PrPSc that cannot be detected using rIgG132-EGFP. No positive signals from un-infected N2a-3 cells, but granular staining from ScN2a-3-22L cells with rIgG132-EGFP demonstrated the PrPSc-specific staining with rIgG132-EGFP (Fig. 3).
Figure 3. Influence of anti-prion compounds on the localization of PrPSc and PrPC.
N2a-3 cells or ScN2a-3-22L cells were cultured with or without an anti-prion compound at the EC65 (mAb 44B1, 0.4 µg/ml; PPS, 0.1 µg/ml; CPZ, 10 µM; U18666A, 5 µM) for 6 h. The cells were fixed and stained with 31C6-Af555 to detect PrPC, and subsequently subjected to PrPSc-specific detection with rIgG132-EGFP. The cell nuclei were counterstained with DAPI. The merged images of PrPSc (green) and nuclei (blue) are shown on the left, those of PrPC (red) and nuclei are shown in the middle, and those of PrPSc, PrPC, and nuclei are shown on the right. Scale bars: 10 µm.
In mAb 44B1-treated ScN2a-3-22L cells, intense PrPC staining at the plasma membrane was observed compared with the findings in mock-treated control cells, whereas PPS treatment did not appear to change the distribution of PrPC after 6 h (Fig. 3). The distribution of PrPC in cells treated with CPZ or U18666A was also unchanged compared with the control cells, although PrPSc clustering at the peri-nuclear regions was less obvious but PrPSc appeared to be widely distributed in the cytoplasm (Fig. 3). Quantification of PrPC signals revealed that the signal intensities of PrPC per cells were not changed in PPS, CPZ or U18666A-treated cells compared with mock-treated control cells, whereas the intensities increased 3-fold in mAb 44B1-treated cells (data not shown).
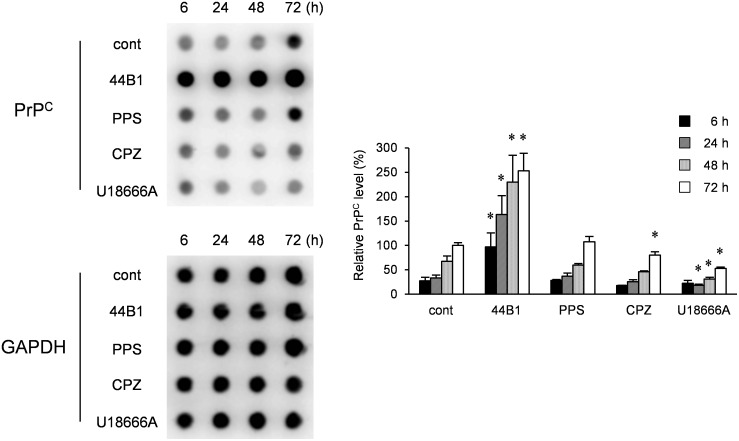
Next, we analyzed the effect of long-term exposure to these compounds on PrPC levels using un-infected N2a-3 cells. The levels of PrPC in control N2a-3 cells increased in a time-dependent manner (Fig. 4), which was consistent with cell density-dependent increases of PrPC levels [24]. In the cells treated with mAb 44B1, the amount of PrPC was markedly increased compared to that in the control cells during the incubation periods. In contrast, PrPC levels in CPZ- or U18666A-treated cells were significantly lower than that in mock-treated cells at 72 h and 24–72 h after treatment, respectively. PPS did not change PrPC levels if cells were treated at EC65 (Fig. 4). These results suggest that long exposure (>24 h) of cells to CPZ or U18666A affects PrPC metabolism.
Figure 4. Influence of anti-prion compounds on PrPC levels.
N2a-3 cells were cultured with an anti-prion compound at the EC65 (mAb 44B1, 0.4 µg/ml; PPS, 0.1 µg/ml; CPZ, 10 µM; U18666A, 5 µM) for 6–72 h and subjected to dot-blotting for the detection of PrPC or GAPDH for endogenous control. Representative dot-blot images are shown on the left, and the graph on the right shows the PrPC levels relative to that of 72-h mock-treated cells. The means and SDs of three independent experiments are depicted. Asterisks indicate a significant difference between the cells treated with each anti-prion compound and mock-treated control cells at the same time point (Student’s t-test, p<0.05).
CPZ and U18666A treatments induce redistribution of PrPSc from early endosomes/endocytic recycling compartments (ERCs) to late endosomes/lysosomes
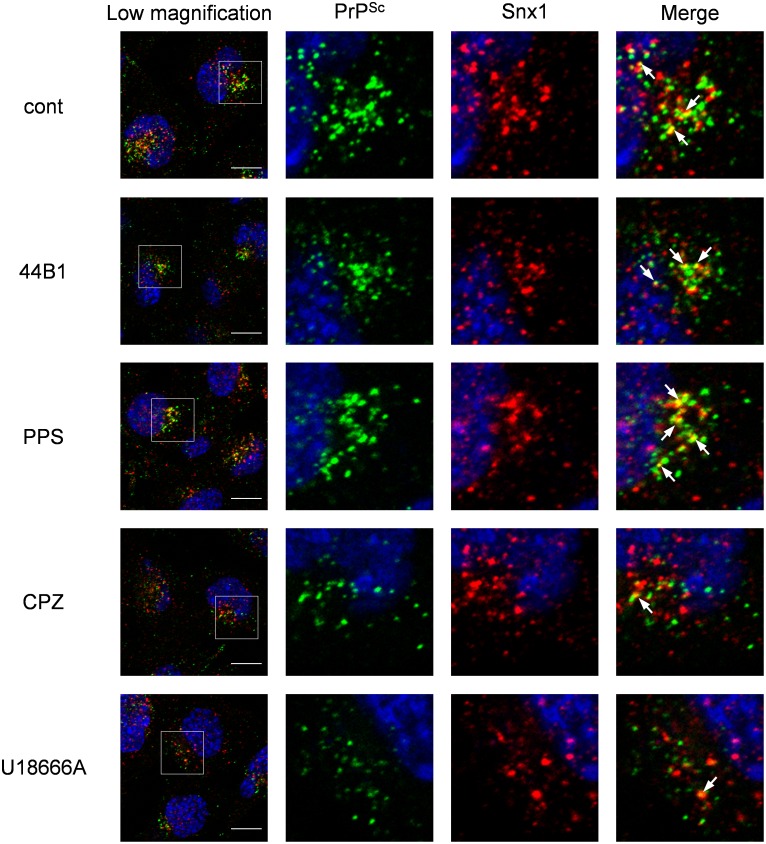
Next, we analyzed the distribution of PrPSc in cells treated with anti-prion compounds. For this experiment, we employed the highest concentration of anti-prion compounds used in Figure 1 to obtain a maximum inhibitory effect on the formation of PrPSc. Double-staining of PrPSc and Snx1, which is a component of retromers involved in retrograde transport from early endosomes to the trans-Golgi network [29], revealed that the localization of PrPSc in CPZ- or U18666A-treated cells was altered within 2 h after the initiation of the treatment; compared with the co-localization of PrPSc with Snx1 in the mock-, mAb 44B1-, or PPS-treated cells, the co-localization was less obvious in CPZ- or U18666A-treated cells (Fig. 5). These results suggest that the change in the PrPSc distribution occurred in a short period after the start of CPZ or U18666A treatment.
Figure 5. Co-localization of PrPSc with Snx1.
ScN2a-3-22L cells grown on a chambered coverglass for 48 h were incubated with 7.5 µg/ml mAb 44B1, 10 µg/ml PPS, 10 µM CPZ, or 5 µM U18666A or without an anti-prion compound for 2 h. The cells were subjected to PrPSc-specific staining with rIgG132-EGFP and immunostaining for Snx1. Nuclei were counterstained with DAPI. The leftmost column presents a lower-magnification merged image of PrPSc (green), Snx1 (red), and nuclei (blue). Individual and merged high-magnification images of the boxed regions are shown on the right. Arrows denote representative examples of co-localization of PrPSc with Snx1. Scale bars: 10 µm.
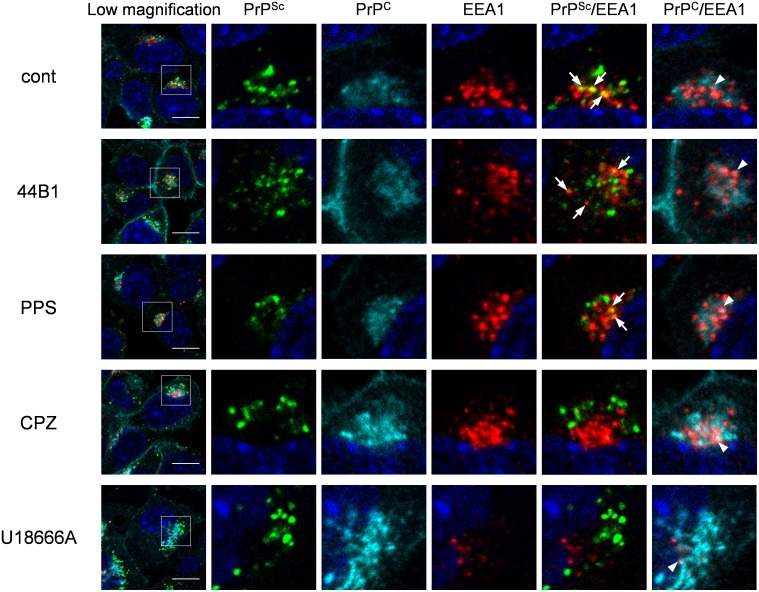
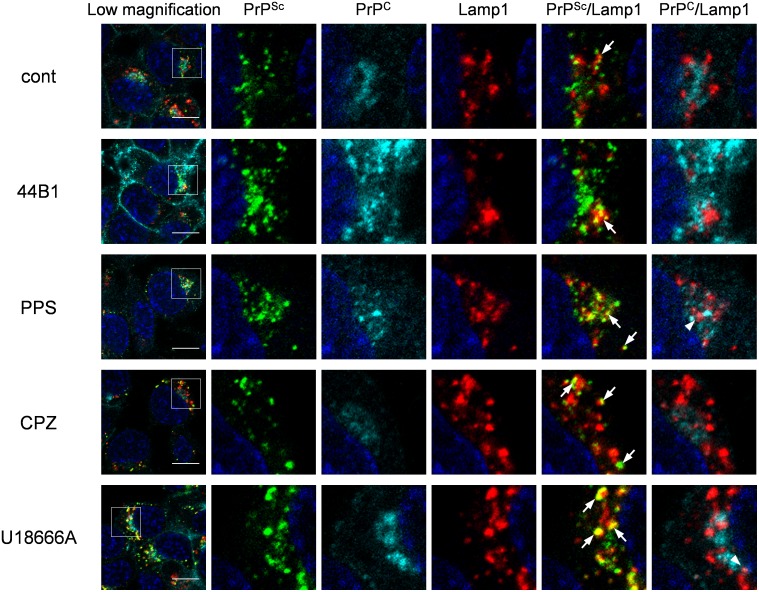
We previously reported that PrPSc exists throughout endocytic compartments including early endosomes and ERCs, which are organelles in the endocytic-recycling pathway that are involved in the recycling of lipids or membrane proteins, and late endosomes and lysosomes, which are organelles in the endo-lysosomal pathway that are involved in the degradation of intracellular or exogenously introduced molecules [20]. Therefore, we further analyzed the localization of both PrPSc and PrPC in cells treated with the anti-prion compounds using the following endosome markers: EEA1 for early endosomes, exogenously introduced transferrin (Tfn) for ERCs, and Lamp1 for late endosomes/lysosomes. Similar to the co-localization of PrPSc with endosome markers in mock-treated cells, some PrPSc granular staining was co-localized with EEA1 (Fig. 6), Lamp1 (Fig. 7), and Tfn (Fig. S3) in ScN2a-3-22L cells treated with mAb 44B1 or PPS. In contrast, PrPSc granular staining in ScN2a-3-22L cells treated with CPZ or U18666A did not appear to be co-localized well with EEA1 (Fig. 6) and Tfn (Fig. S3), but the staining was co-localized with Lamp1 (Fig. 7) after 6 h of the treatment. Quantitative analysis of the co-localization indicated that the co-localization ratio of PrPSc with EEA1 or Tfn in cells treated with CPZ was significantly lower than that in the mock-treated cells (Fig. 8A). On the other hand, the co-localization ratio of PrPSc with Lamp1 was significantly increased (Fig. 8A). Likewise, a decrease in the co-localization of PrPSc with EEA1 (not statistically significant) or Tfn (p<0.05) and an increase in the co-localization of PrPSc with Lamp1 (p<0.01) were observed in cells treated with U18666A (Fig. 8A). In contrast, there were no significant differences in the co-localization ratios of PrPC with EEA1, Lamp1, and Tfn in cells treated with PPS, CPZ, or U18666A compared with the findings in the mock-treated cells (Fig. 8B). Interestingly, the co-localization ratio of PrPC with EEA1 or Lamp1 was significantly decreased in cells treated with mAb 44B1 (Fig. 8B). These results suggest that CPZ and U18666A induce the redistribution of PrPSc from EEA1-positive early endosomes and/or Tfn-positive ERCs to Lamp1-positive late endosomes/lysosomes without remarkably affecting in the distribution of PrPC.
Figure 6. Co-localization of PrPSc or PrPC with EEA1.
ScN2a-3-22L cells were cultured with 7.5 µg/ml mAb 44B1, 10 µg/ml PPS, 10 µM CPZ or 5 µM U18666A or without an anti-prion compound for 6 h. The cells were subjected to direct immunostaining of PrPC and PrPSc with 31C6-Af555 and rIgG132-EGFP, respectively and subsequently to immunostaining for EEA1 and nuclei. The leftmost column shows a lower-magnification merged image of PrPSc (green), PrPC (cyan), EEA1 (red), and nuclei (blue). Individual and merged high-magnification images of the boxed regions are shown on the right. Arrows or arrowheads denote representative examples of the co-localization of PrPSc with EEA1 or PrPC with EEA1, respectively. Scale bars: 10 µm.
Figure 7. Co-localization of PrPSc or PrPC with Lamp1.
ScN2a-3-22L cells were cultured under the same condition as described in Figure 6. The cells were subjected to direct immunostaining of PrPC and PrPSc with 31C6-Af555 and rIgG132-EGFP, respectively and subsequently to immunostaining for Lamp1 and nuclei. The leftmost column shows a lower-magnification merged image of PrPSc (green), PrPC (cyan), Lamp1 (red), and nuclei (blue). Individual and merged high-magnification images of the boxed regions are shown on the right. Arrows or arrowheads denote representative examples of the co-localization of PrPSc with Lamp1 or PrPC with Lamp1, respectively. Scale bars: 10 µm.
Figure 8. Co-localization statistics of PrPSc or PrPC with organelle markers.
Co-localization analyses of the images shown in Figures 7 and 8 and Figure S3 were conducted. (A) Ratio of double-positive areas for PrPSc and markers to the sum of PrPSc-positive areas. (B) Ratio of double-positive areas for PrPC and markers to the sum of PrPC positive areas. The means and SDs of the value acquired in five or six view fields are shown. Single (p<0.05) and double (p<0.01) asterisks indicate a significant difference compared with the control.
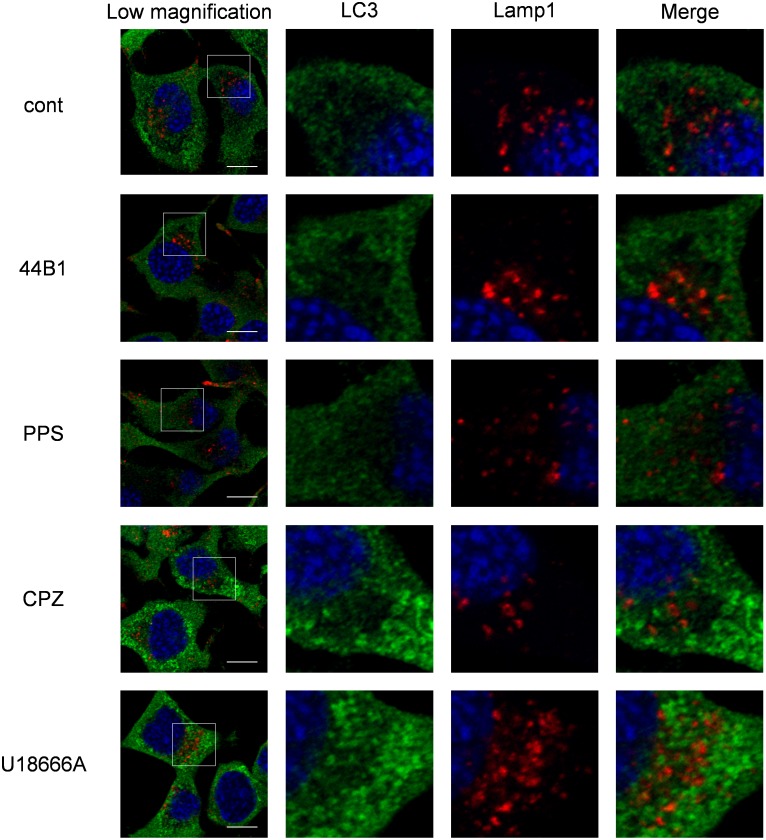
Lysosomes can fuse with different cellular membranes, such as endosomes, autophagosomes, phagosomes and the plasma membrane [30]. In the process of macroautophagy, autophagosomes that contain cytosolic constituents fuse with lysosomes to form autolysosomes for degrading internal materials [31]. To assess whether autophagy is involved in the redistribution of PrPSc induced by CPZ or U18666A treatment, we analyzed the expression of the autophagosome marker LC3. LC3 accumulation was observed in the cytoplasm of the cells treated with CPZ or U18666A (Fig. 9); however, LC3 did not co-localize with Lamp1. This indicates the absence of the formation of autolysosome.
Figure 9. Induction of autophagy by CPZ or U18666A treatment.
ScN2a-3-22L cells were cultured under the same conditions as described in Figure 6. The cells were subjected to immunostaining for LC3 and Lamp1 and counterstained with DAPI. The leftmost column shows the lower-magnification merged image of LC3 (green), Lamp1 (red), and nuclei (blue). Individual and merged high-magnification images of the boxed regions are shown on the right. Scale bars: 10 µm.
CPZ or U18666A treatment causes the degradation of PrPSc in secondary lysosomes
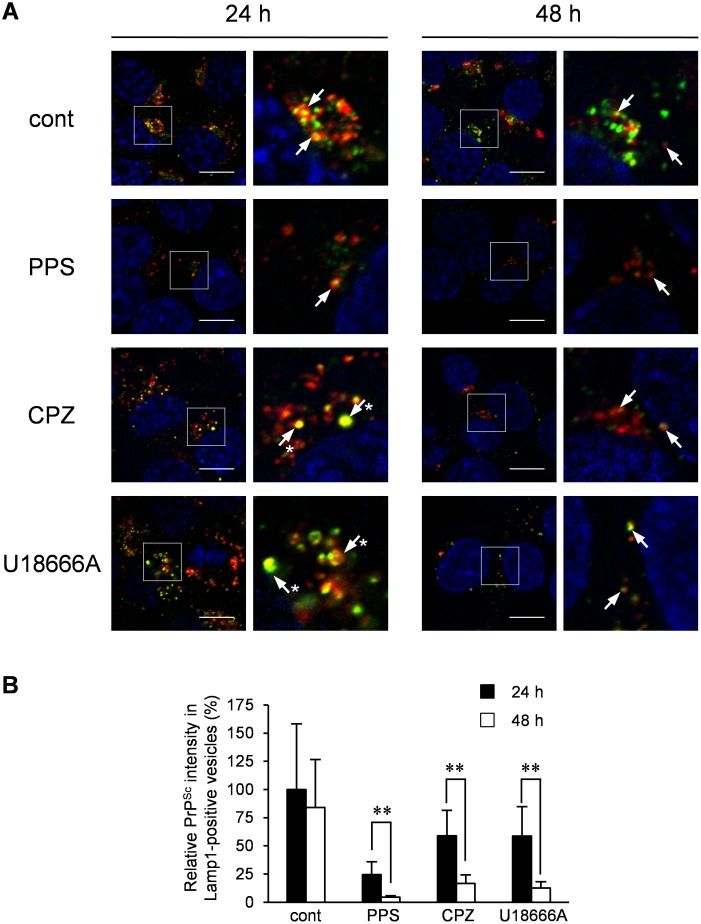
To analyze the fate of PrPSc transported to Lamp1-positive late endosomes/lysosomes upon CPZ or U18666A treatment, PrPSc in Lamp1-positive vesicles was monitored for 48 h after the initiation of treatment. After 24 h of CPZ or U18666A treatment, a large portion of PrPSc existed in swollen Lamp1-positive vesicles (Fig. 10A, 24 h, arrows with asterisks). After an additional 24 h of incubation, swollen Lamp1-positive vesicles disappeared, but PrPSc remained in Lamp1-positive vesicles, although its intensity was significantly decreased (Figs. 10A and B, 48 h). To evaluate whether the decrease in PrPSc levels was because of the degradation of PrPSc in Lamp1-positive vesicles, we analyzed PrPSc after impairing lysosomal hydrolysis. For this purpose, we treated the cells with Mon, a Na+/H+-exchanging ionophore [32], or BafA1, which is known as an inhibitor of vacuolar H+-ATPase [33], at 24 h after the start of CPZ or U18666A treatment, at which point a large portion of PrPSc was transported to Lamp1-positive vesicles. In cells treated with Mon or BafA1, the ratio of the mature form of cathepsin D to pro- and/or intermediate forms of cathepsin D was decreased (Fig. 11A, cathepsin D), suggesting that lysosomal hydrolysis was partly impaired by interfering with the maturation of lysosomal hydrolases. Treatment of cells with Mon or BafA1 partly interfered with the reduction of PrP-res levels that was caused by CPZ or U18666A treatment (Fig. 11A, PrP-res). In IFA, granular staining of PrPSc in Lamp1-positive vesicles, which was induced by CPZ treatment, was observed after 24 h of treatment with Mon or BafA1 (Fig. 11B). The degradation of PrPSc induced by CPZ was partly inhibited by the impairment of lysosomal hydrolysis, indicating that CPZ and possibly U18666A treatment causes the degradation of PrPSc in Lamp1-positive lysosomes.
Figure 10. Fate of PrPSc after treatment with CPZ or U18666A.
ScN2a-3-22L cells were cultured with 10 µg/ml PPS, 10 µM CPZ or 5 µM U18666A or without an anti-prion compound for 24 or 48 h. The cells were subjected to the PrPSc-specific indirect immunostaining of PrPSc with mAb 132 and immunostaining for Lamp1 and nuclei. (A) Localization of PrPSc. The left columns show a lower-magnification merged image of PrPSc (green), Lamp1 (red), and nuclei (blue). The high-magnification images of the boxed regions are shown on the right. Arrows indicate representative co-localization of PrPSc with Lamp1. Arrows with asterisks indicate swollen Lamp1-positive vesicles positive for PrPSc. Scale bars: 10 µm. (B) Intensity of PrPSc in Lamp1-positive vesicles. The graph represents the values of the fluorescent intensities of PrPSc in Lamp1-positive vesicles per cell relative to those of PrPSc in Lamp1-positive vesicles per cell in mock-treated cells after 24 h of treatment. The means and SDs of the value acquired in six view fields are shown. Double asterisks indicate a significant difference between cells treated for 24 and 48 h (Student’s t-test, p<0.01).
Figure 11. Effect of lysosomal hydrolysis inhibition on the decrease of PrPSc levels induced by CPZ or U18666A treatment.
(A) Immunoblot analysis of PrP-res and cathepsin D. ScN2a-3-22L cells were cultured with 10 µM CPZ or 5 µM U18666A or without compounds for 24 h. Subsequently, monensin (Mon) or bafilomycin A1 (BafA1) was added to the culture at a final concentration of 100 or 5 nM, respectively. Following an additional incubation for 36 h with or without Mon or BafA1, the cells were subjected to immunoblotting for PrP-res, cathepsin D, or β-actin. Representative immunoblot images are shown on the left. The bracket in the immunoblot of cathepsin D denotes the pro- and/or intermediate forms of cathepsin D (Pro/Int). The arrowhead denotes the mature form of cathepsin D (M). The upper right graph shows the levels of PrP-res relative to the control. The lower right graph shows the ratio of mature to pro−/intermediate forms of cathepsin D. The means and SDs of three independent experiments are depicted. Asterisks indicate a significant difference between Mon- or BafA1-treated samples and untreated samples (non-treated) (Student’s t-test, p<0.05). (B) Localization of PrPSc. ScN2a-3-22L cells grown on a chambered coverglass were cultured with 10 µM CPZ for 24 h. Subsequently, Mon or BafA1 was added at a final concentration of 100 or 5 nM, respectively, and the cells were cultured for additional 24 h in the presence of CPZ and Mon or BafA1. The cells were subjected to double-staining of PrPSc and Lamp1 before (left) and after the treatment with Mon (middle) or BafA1 (right). The upper panel shows the merged images of PrPSc (green) and nuclei (blue). The bottom panel shows the merged images of PrPSc (green), Lamp1 (red) and nuclei (blue). Scale bars: 10 µm.
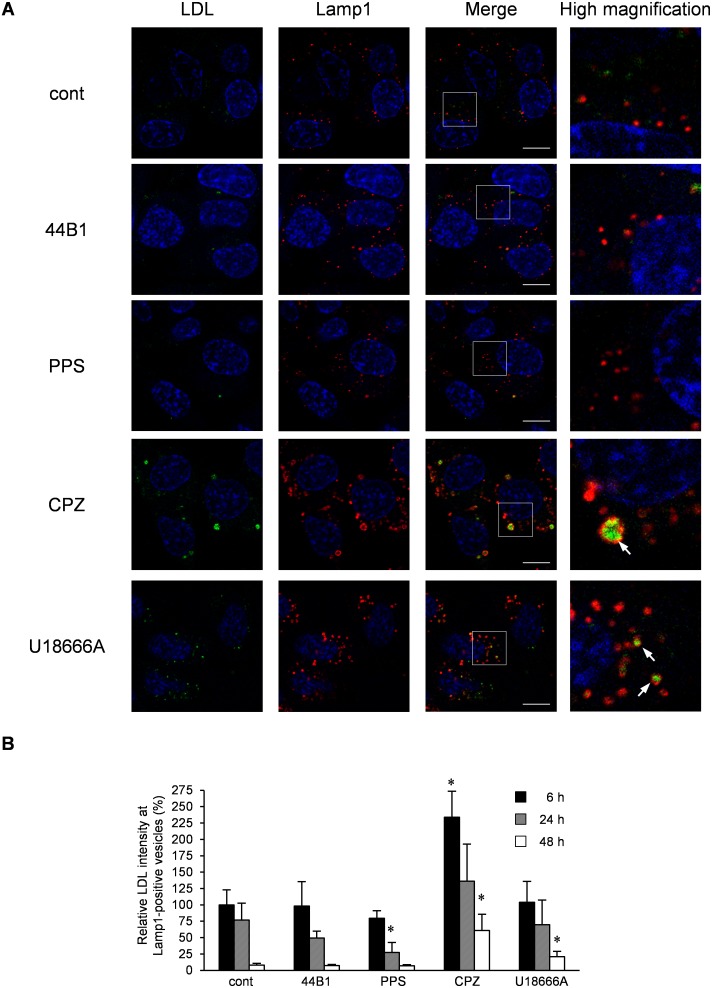
The reduction of PrP-res by CPZ or U18666A treatment was observed 48 h after the initiation of treatment (Figs. 1–2), although PrPSc was already redistributed to Lamp1-positive vesicles within 6 h (Fig. 7). In contrast, PrP-res was rapidly decreased by mAb 44B1 or PPS treatment within 24 h (Fig. 1B). To clarify the difference between the treatments, we analyzed the function of lysosomal hydrolysis in the cells using LDL. LDL binds to the LDL receptor, after which it is internalized from the cell surface via clathrin-coated pits and transported to late endocytic compartments for degradation [34]. Therefore, we measured the degradation of exogenously introduced Alexa Fluor 488-conjugated LDL to monitor the function of lysosomal hydrolysis. After 24 h of treatment, the exogenously introduced LDL was located in the swollen Lamp1-positive vesicles in the cells treated with CPZ or U18666A, whereas LDL was hardly detected in Lamp1-positive vesicles in cells treated with mAb 44B1 or PPS (Fig. 12A). These facts suggest that hydrolysis in the swollen Lamp1-positive vesicles was partly impaired by CPZ or U18666A. The quantification of the intensities of LDL in Lamp1-positive vesicles revealed that the degradation of LDL was significantly inhibited in CPZ-treated cells after 6 h and 48 h of treatment (Fig. 12B, CPZ) or in U18666A-treated cells after 48 h of treatment compared with the findings in mock-treated cells (Fig. 12B, U18666A), whereas significant inhibition of the degradation of LDL was not observed in mAb 44B1- or PPS-treated cells (Fig. 12B, 44B1 and PPS). These results suggest that lysosomal hydrolysis in swollen Lamp1-positive vesicles in CPZ- and U18666A-treated cells was partially impaired and that this impairment accounts for the slow decrease in PrPSc levels in CPZ- and U186666A- treated cells.
Figure 12. Degradation of LDL in cells treated with anti-prion compounds.
ScN2a-3-22L cells were incubated with Alexa Fluor 488-conjugated LDL (4 µg/ml) for 6 h. After the incubation, the cells were cultured in the presence or absence of 0.4 µg/ml mAb 44B1, 0.1 µg/ml PPS, 10 µg/ml CPZ, or 5 µM U18666A for 6–48 h. The cells were subjected to immunostaining of Lamp1 and staining of the cell nuclei with DAPI. Z-series of the images were acquired at 0.8-µm steps from the top to the bottom of the cells in the area. (A) Localization of LDL. The panel shows the representative images of the signals of LDL (green), Lamp1 (red) and nuclei (blue) in cells treated with the indicated anti-prion compound for 24 h. The merged images of LDL and nuclei are shown on the left, those of Lamp1 and nuclei are shown in the middle, and those of LDL, Lamp1, and nuclei are shown on the right. The rightmost column presents the higher-magnification images of the boxed regions in the second right column. Scale bars: 10 µm. (B) Intensity of LDL in Lamp1-positive vesicles. The graph shows the values of the fluorescent intensities of LDL in Lamp1-positive vesicles per cell relative to those of LDL in Lamp1-positive vesicles per cell in mock-treated control cells for 6 h. The means and SDs of the value acquired in five view fields are shown. Asterisks indicate a significant difference compared with the control at the same time point (Student’s t-test, p<0.05).
Discussion
In this study, we re-evaluated four anti-prion compounds and found that mAb 44B1 and PPS rapidly decrease PrPSc levels, whereas, CPZ and U18666A slowly decrease PrPSc levels. Detailed analyses of the distribution of PrPC and PrPSc revealed differences in the mechanism of the inhibition of PrPSc formation for the four anti-prion compounds.
MAb 44B1 reduced PrP-res levels within 24 h (Fig. 1) without altering the distribution of PrPSc (Fig. 2). Consistent with a previous report, increase in PrPC at the plasma membrane indicated that mAb 44B1 retained PrPC on the cell surface as an antigen–antibody complex [22]. This idea is further supported by decreased co-localization of PrPC with markers for early or late endosomes (Fig. 8). Therefore, the major anti-prion effect of mAb 44B1 is explained by interference with the internalization and trafficking of PrPC to endocytic compartments where the conversion of PrPC to PrPSc occurs [25], [28]. The difference in the anti-prion effects of PPS and mAb 44B1 was that PPS decreased PrP-res levels without altering the distribution or amount of PrPC, whereas mAb 44B1 did not (Figs. 4 and 8). Although it is reported that PPS stimulates the internalization of PrPC and redistribution of PrPC into late endosomes and/or lysosomes in N2a cells overexpressing chicken PrPC [26] or decreases PrPC levels at higher concentrations (e.g., 100 µg/ml) [35], PPS did not decrease PrPC levels at the EC65 (Fig. 4) and did not appear to alter the intracellular localization of PrPC even at 10 µg/ml, a concentration 125-fold than the EC50 for PPS in this study (0.08 µg/ml) (Figs. 6–8). These results were supported by the report that PPS treatment does not influence the normal metabolism of PrPC in prion-infected mouse neuroblastoma cells [36]. Although the precise mechanism by which PPS treatment reduces PrPSc levels could not be identified in this study, PPS may competitively interfere with the binding of PrPC and PrPSc via endogenous GAG [36]; alternatively, PPS causes the fragmentation of PrPSc at the cell surface as observed with a heparin-mimetic compound [37].
Interestingly, in contrast to mAb 44B1 and PPS, CPZ and U18666A treatment induced the redistribution of PrPSc to Lamp1-positive vesicles prior to the alteration of PrPC distribution or PrPC levels (Figs. 3, 5–8). This phenomenon may account for the early step in the PrPSc degradation caused by CPZ and U18666A. In cells persistently infected with prions, PrPSc exists in organelles in the endocytic-recycling pathway such as early endosomes and ERCs (Figs. 5, 6, and 8, Fig. S3) [20], . PrPSc also exists in organelles in the endo-lysosomal pathway such as late endosomes and lysosomes (Figs. 7–8) [20], [39], [40]. In the previous study, we reported that PrPSc is dynamically transported through endocytic compartments by the membrane trafficking machinery of cells [20], and the majority of exogenously introduced PrPSc is transported to late endosomes/lysosomes via the endo-lysosomal pathway for degradation [25]. These observations suggest that PrPSc is trafficked via both the endocytic-recycling and endo-lysosomal pathways in persistently infected cells. The decrease in co-localization of PrPSc with Snx1, EEA1, and Tfn and increase in co-localization of PrPSc with Lamp1 in CPZ or U18666A-treated cells (Fig. 8) suggest that the treatment induced a transfer of PrPSc from the endocytic-recycling pathway to the endo-lysosomal pathway. This alteration may increase the opportunity for PrPSc to be exposed to lysosomal hydrolysis in the endo-lysosomal pathway. The redistribution of PrPSc to Lamp1-positive vesicles is independent of autophagy because Lamp1-positive vesicles were not co-localized with the autophagosome marker LC3 (Fig. 9).
U18666A is an inhibitor of cholesterol biosynthesis, and it blocks the exit of cholesterol from late endosomes [41], [42]. Gilch et al. reported that the accumulation of cholesterol in late endosomes/lysosomes accelerates the degradation of PrPSc [27]. Recently, Marzo et al. reported that tamoxifen, an inhibitor of cholesterol biosynthesis, redistributes PrPSc to lysosomes along with the accumulation of cholesterol in lysosomes [19]. We also observed the accumulation of cholesterol in Lamp1-positive vesicles after 24 h of CPZ treatment (data not shown). This is similar to the fact that quinacrine, a tricyclic compound, and U18666A redistribute cholesterol from the cell surface to late endosomes/lysosomes in prion-infected Neuro2a cells [14]. Taken together with these observations and the association of PrPSc with lipid rafts that are cholesterol- and sphingolipid-rich membrane microdomains [43], [44], it is conceivable that the redistribution of PrPSc to late endosomes/lysosomes upon CPZ or U18666A treatment is associated with the transport of cholesterol-enriched microdomains from the plasma membrane to late endosomes/lysosomes.
CPZ and U18666A required 48 h to reduce PrP-res levels, which was in contrast to the rapid decrease in PrP-res levels induced by mAb 44B1 or PPS within 24 h (Fig. 1). This observation is consistent with a previous report that quinacrine or CPZ requires a few days to decrease PrPSc levels [45]. The presence of swollen Lamp1-positive vesicles at 6–24 h after CPZ or U18666A treatment and the inhibition of the degradation of LDL in the Lamp1-positive vesicles in CPZ-treated cells suggest temporal impairment of lysosomal activities (Fig. 12), and this impairment may explain the slow degradation of PrPSc. The dysfunction of lysosomal activities was supported by the decrease in lysosomes and increase in late endosomes in Neuro2a cells treated with quinacrine or U18666A [14] or the inhibition of lysosomal hydrolase maturation by U18666A [46]. Nevertheless, the levels of PrP-res and PrPSc in Lamp1-positive vesicles decreased after 48 h of treatment, at which point swollen Lamp1-positive vesicles disappeared (Figs. 1 and 10), suggesting that PrPSc was degraded in Lamp1-positive vesicles after lysosomal hydrolysis was restored.
In contrast to the redistribution and relatively slow degradation of PrPSc induced by CPZ or U18666A treatment, the amount of PrP-res was decreased without an apparent redistribution of PrPSc within 24 h of treatment with mAb 44B1 or PPS (Figs. 1–3 and 8) that did not appear to affect lysosomal activities (Fig. 12). These data suggest that once PrPSc formation is inhibited, PrPSc will be rapidly degraded even in the absence of the transfer of PrPSc from the endocytic-recycling pathway to the endo-lysosomal pathway. This fact implies that a considerable portion of PrPSc generated in persistently infected cells may be constantly degraded even in the steady state. Alternatively, the degradation of PrPSc may occur in both lysosomes and organelles in the endocytic-recycling pathway.
Although we demonstrated that CPZ and U18666A induce the transfer of PrPSc to late endosomes/lysosomes to be degraded possibly in lysosomes, the alteration of the membrane trafficking machinery and induction of lysosomal dysfunction, with effects below an apparent toxic level with a short exposure, will be disadvantageous for therapeutics. For instance, chronic exposure of primary cultured neurons to U18666A induces intracellular cholesterol accumulation and causes apoptotic cell death, which is similarly observed in cell culture models of Niemann–Pick disease type C [47], a lysosomal storage disorder in CNS [48]. In prion-infected Neuro2a cells, CPZ and U18666A had a narrow effective range compared with that of mAb 44B1 and PPS (data not shown). Considering that therapy for prion diseases requires long-term administration, anti-prion compounds that could interfere with PrPSc formation and/or enhance its degradation while having little effects on cell metabolism are ideal.
In this study, we could classify the four anti-prion compounds into two groups; one group inhibited PrPSc formation by influencing PrPC metabolism, and the other induced PrPSc degradation by altering cell membrane metabolism. To develop more effective but less cytotoxic therapeutics, further analysis using prion-infected cells is required to identify the intracellular event actually involved in PrPSc clearance induced by any anti-prion compound. Detailed analysis of the intracellular dynamics of PrPC and PrPSc will provide a logical basis for the development of therapeutic agents for prion diseases.
Supporting Information
Effect of the anti-prion compounds on cell proliferation.
(TIF)
Double-staining of PrPSc and PrPC.
(TIF)
Co-localization of PrPSc or PrPC with transferrin (Tfn).
(TIF)
Acknowledgments
We thank all of the lab members for helpful comments and discussion. We also thank Zensho Co. Ltd. for BSL3 facility.
Data Availability
The authors confirm that all data underlying the findings are fully available without restriction. All relevant data are within the paper and its Supporting Information files.
Funding Statement
T.Y. was supported by a Grant-in-Aid for JSPS Fellows (no. 22•4181). This work was supported by a Grant-in-Aid for Science Research (A) (grant no. 23248050), a grant from the Program for Leading Graduate Schools (F01), and the Japan Initiative for Global Research Network on Infectious Diseases (JGRID), from the Ministry of Education, Culture, Sports, Science, and Technology, Japan. This work was also supported by grants for TSE research (H26-Shokuhin-Ippan-003) and Research on Measures for Intractable Diseases from the Ministry of Health, Labour and Welfare of Japan. The funders had no role in study design, data collection and analysis, decision to publish, or preparation of the manuscript.
References
- 1. Aguzzi A, Calella AM (2009) Prions: protein aggregation and infectious diseases. Physiol Rev 89: 1105–1152. [DOI] [PubMed] [Google Scholar]
- 2. Song CH, Honmou O, Ohsawa N, Nakamura K, Hamada H, et al. (2009) Effect of transplantation of bone marrow-derived mesenchymal stem cells on mice infected with prions. J Virol 83: 5918–5927. [DOI] [PMC free article] [PubMed] [Google Scholar]
- 3. Relano-Gines A, Lehmann S, Bencsik A, Herva ME, Torres JM, et al. (2011) Stem cell therapy extends incubation and survival time in prion-infected mice in a time window-dependant manner. J Infect Dis 204: 1038–1045. [DOI] [PubMed] [Google Scholar]
- 4. Moreno JA, Halliday M, Molloy C, Radford H, Verity N, et al. (2013) Oral treatment targeting the unfolded protein response prevents neurodegeneration and clinical disease in prion-infected mice. Sci Transl Med 5: 206ra138. [DOI] [PubMed] [Google Scholar]
- 5. Sim VL (2012) Prion disease: chemotherapeutic strategies. Infect Disord Drug Targets 12: 144–160. [DOI] [PubMed] [Google Scholar]
- 6. Whittle IR, Knight RS, Will RG (2006) Unsuccessful intraventricular pentosan polysulphate treatment of variant Creutzfeldt-Jakob disease. Acta Neurochir (Wien) 148: 677–679 discussion 679. [DOI] [PubMed] [Google Scholar]
- 7. Bone I, Belton L, Walker AS, Darbyshire J (2008) Intraventricular pentosan polysulphate in human prion diseases: an observational study in the UK. Eur J Neurol 15: 458–464. [DOI] [PubMed] [Google Scholar]
- 8. Tsuboi Y, Doh-Ura K, Yamada T (2009) Continuous intraventricular infusion of pentosan polysulfate: clinical trial against prion diseases. Neuropathology 29: 632–636. [DOI] [PubMed] [Google Scholar]
- 9. Forloni G, Artuso V, Roiter I, Morbin M, Tagliavini F (2013) Therapy in prion diseases. Curr Top Med Chem 13: 2465–2476. [DOI] [PubMed] [Google Scholar]
- 10. Geschwind MD, Kuo AL, Wong KS, Haman A, Devereux G, et al. (2013) Quinacrine treatment trial for sporadic Creutzfeldt-Jakob disease. Neurology 81: 2015–2023. [DOI] [PMC free article] [PubMed] [Google Scholar]
- 11. Sim VL, Caughey B (2009) Recent advances in prion chemotherapeutics. Infect Disord Drug Targets 9: 81–91. [DOI] [PMC free article] [PubMed] [Google Scholar]
- 12. Taraboulos A, Scott M, Semenov A, Avrahami D, Laszlo L, et al. (1995) Cholesterol depletion and modification of COOH-terminal targeting sequence of the prion protein inhibit formation of the scrapie isoform. The Journal of Cell Biology 129: 121–132. [DOI] [PMC free article] [PubMed] [Google Scholar]
- 13. Bate C, Salmona M, Diomede L, Williams A (2004) Squalestatin cures prion-infected neurons and protects against prion neurotoxicity. J Biol Chem 279: 14983–14990. [DOI] [PubMed] [Google Scholar]
- 14. Klingenstein R, Lober S, Kujala P, Godsave S, Leliveld SR, et al. (2006) Tricyclic antidepressants, quinacrine and a novel, synthetic chimera thereof clear prions by destabilizing detergent-resistant membrane compartments. J Neurochem 98: 748–759. [DOI] [PubMed] [Google Scholar]
- 15. Supattapone S, Nguyen HO, Cohen FE, Prusiner SB, Scott MR (1999) Elimination of prions by branched polyamines and implications for therapeutics. Proc Natl Acad Sci U S A 96: 14529–14534. [DOI] [PMC free article] [PubMed] [Google Scholar]
- 16. Heiseke A, Aguib Y, Riemer C, Baier M, Schatzl HM (2009) Lithium induces clearance of protease resistant prion protein in prion-infected cells by induction of autophagy. J Neurochem 109: 25–34. [DOI] [PubMed] [Google Scholar]
- 17. Aguib Y, Heiseke A, Gilch S, Riemer C, Baier M, et al. (2009) Autophagy induction by trehalose counteracts cellular prion infection. Autophagy 5: 361–369. [DOI] [PubMed] [Google Scholar]
- 18. Nakagaki T, Satoh K, Ishibashi D, Fuse T, Sano K, et al. (2013) FK506 reduces abnormal prion protein through the activation of autolysosomal degradation and prolongs survival in prion-infected mice. Autophagy 9: 1386–1394. [DOI] [PubMed] [Google Scholar]
- 19. Marzo L, Marijanovic Z, Browman D, Chamoun Z, Caputo A, et al. (2013) 4-hydroxytamoxifen leads to PrPSc clearance by conveying both PrPC and PrPSc to lysosomes independently of autophagy. J Cell Sci 126: 1345–1354. [DOI] [PubMed] [Google Scholar]
- 20. Yamasaki T, Suzuki A, Shimizu T, Watarai M, Hasebe R, et al. (2012) Characterization of intracellular localization of PrP(Sc) in prion-infected cells using a mAb that recognizes the region consisting of aa 119–127 of mouse PrP. J Gen Virol 93: 668–680. [DOI] [PubMed] [Google Scholar]
- 21. Kim C-L, Umetani A, Matsui T, Ishiguro N, Shinagawa M, et al. (2004) Antigenic characterization of an abnormal isoform of prion protein using a new diverse panel of monoclonal antibodies. Virology 320: 40–51. [DOI] [PubMed] [Google Scholar]
- 22. Kim C-L, Karino A, Ishiguro N, Shinagawa M, Sato M, et al. (2004) Cell-surface retention of PrPC by anti-PrP antibody prevents protease-resistant PrP formation. The Journal of General Virology 85: 3473–3482. [DOI] [PubMed] [Google Scholar]
- 23. Uryu M, Karino A, Kamihara Y, Horiuchi M (2007) Characterization of prion susceptibility in Neuro2a mouse neuroblastoma cell subclones. Microbiology and Immunology 51: 661–669. [DOI] [PubMed] [Google Scholar]
- 24. Nakamitsu S, Kurokawa A, Yamasaki T, Uryu M, Hasebe R, et al. (2010) Cell density-dependent increase in the level of protease-resistant prion protein in prion-infected Neuro2a mouse neuroblastoma cells. J Gen Virol 91: 563–569. [DOI] [PubMed] [Google Scholar]
- 25. Yamasaki T, Baron GS, Suzuki A, Hasebe R, Horiuchi M (2014) Characterization of intracellular dynamics of inoculated PrP-res and newly generated PrP(Sc) during early stage prion infection in Neuro2a cells. Virology 450–451: 324–335. [DOI] [PMC free article] [PubMed] [Google Scholar]
- 26. Shyng SL, Lehmann S, Moulder KL, Harris DA (1995) Sulfated glycans stimulate endocytosis of the cellular isoform of the prion protein, PrPC, in cultured cells. J Biol Chem 270: 30221–30229. [DOI] [PubMed] [Google Scholar]
- 27. Gilch S, Bach C, Lutzny G, Vorberg I, Schätzl HM (2009) Inhibition of cholesterol recycling impairs cellular PrP(Sc) propagation. Cellular and Molecular Life Sciences: CMLS 66: 3979–3991. [DOI] [PMC free article] [PubMed] [Google Scholar]
- 28.Marijanovic Z, Caputo A, Campana V, Zurzolo C (2009) Identification of an intracellular site of prion conversion. PLoS Pathogens 5. [DOI] [PMC free article] [PubMed]
- 29. Bujny MV, Popoff V, Johannes L, Cullen PJ (2007) The retromer component sorting nexin-1 is required for efficient retrograde transport of Shiga toxin from early endosome to the trans Golgi network. J Cell Sci 120: 2010–2021. [DOI] [PubMed] [Google Scholar]
- 30. Luzio JP, Pryor PR, Bright NA (2007) Lysosomes: fusion and function. Nature reviews Molecular cell biology 8: 622–632. [DOI] [PubMed] [Google Scholar]
- 31. Mizushima N (2007) Autophagy: process and function. Genes Dev 21: 2861–2873. [DOI] [PubMed] [Google Scholar]
- 32. Pohlmann R, Kruger S, Hasilik A, von Figura K (1984) Effect of monensin on intracellular transport and receptor-mediated endocytosis of lysosomal enzymes. Biochem J 217: 649–658. [DOI] [PMC free article] [PubMed] [Google Scholar]
- 33. Oda K, Nishimura Y, Ikehara Y, Kato K (1991) Bafilomycin A1 inhibits the targeting of lysosomal acid hydrolases in cultured hepatocytes. Biochemical and Biophysical Research Communications 178: 369–377. [DOI] [PubMed] [Google Scholar]
- 34. Ikonen E (2008) Cellular cholesterol trafficking and compartmentalization. Nature Reviews Molecular Cell Biology 9: 125–138. [DOI] [PubMed] [Google Scholar]
- 35. Yamaguchi S, Nishida Y, Sasaki K, Kambara M, Kim CL, et al. (2006) Inhibition of PrPSc formation by synthetic O-sulfated glycopyranosides and their polymers. Biochem Biophys Res Commun 349: 485–491. [DOI] [PubMed] [Google Scholar]
- 36. Caughey B, Raymond GJ (1993) Sulfated polyanion inhibition of scrapie-associated PrP accumulation in cultured cells. Journal of virology 67: 643–650. [DOI] [PMC free article] [PubMed] [Google Scholar]
- 37. Rouvinski A, Karniely S, Kounin M, Moussa S, Goldberg MD, et al. (2014) Live imaging of prions reveals nascent PrPSc in cell-surface, raft-associated amyloid strings and webs. J Cell Biol 204: 423–441. [DOI] [PMC free article] [PubMed] [Google Scholar]
- 38. Veith NM, Plattner H, Stuermer CAO, Schulz-Schaeffer WJ, Bürkle A (2009) Immunolocalisation of PrPSc in scrapie-infected N2a mouse neuroblastoma cells by light and electron microscopy. European Journal of Cell Biology 88: 45–63. [DOI] [PubMed] [Google Scholar]
- 39. McKinley MP, Taraboulos A, Kenaga L, Serban D, Stieber A, et al. (1991) Ultrastructural localization of scrapie prion proteins in cytoplasmic vesicles of infected cultured cells. Laboratory Investigation; a Journal of Technical Methods and Pathology 65: 622–630. [PubMed] [Google Scholar]
- 40. Pimpinelli F, Lehmann S, Maridonneau-Parini I (2005) The scrapie prion protein is present in flotillin-1-positive vesicles in central- but not peripheral-derived neuronal cell lines. The European Journal of Neuroscience 21: 2063–2072. [DOI] [PubMed] [Google Scholar]
- 41. Koh CH, Cheung NS (2006) Cellular mechanism of U18666A-mediated apoptosis in cultured murine cortical neurons: bridging Niemann-Pick disease type C and Alzheimer’s disease. Cell Signal 18: 1844–1853. [DOI] [PubMed] [Google Scholar]
- 42. Sobo K, Le Blanc I, Luyet PP, Fivaz M, Ferguson C, et al. (2007) Late endosomal cholesterol accumulation leads to impaired intra-endosomal trafficking. PLoS One 2: e851. [DOI] [PMC free article] [PubMed] [Google Scholar]
- 43. Naslavsky N, Stein R, Yanai A, Friedlander G, Taraboulos A (1997) Characterization of detergent-insoluble complexes containing the cellular prion protein and its scrapie isoform. The Journal of Biological Chemistry 272: 6324–6331. [DOI] [PubMed] [Google Scholar]
- 44. Lingwood D, Simons K (2010) Lipid rafts as a membrane-organizing principle. Science 327: 46–50. [DOI] [PubMed] [Google Scholar]
- 45. Korth C, May BC, Cohen FE, Prusiner SB (2001) Acridine and phenothiazine derivatives as pharmacotherapeutics for prion disease. Proceedings of the National Academy of Sciences of the United States of America 98: 9836–9841. [DOI] [PMC free article] [PubMed] [Google Scholar]
- 46. Tomiyama Y, Waguri S, Kanamori S, Kametaka S, Wakasugi M, et al. (2004) Early-phase redistribution of the cation-independent mannose 6-phosphate receptor by U18666A treatment in HeLa cells. Cell Tissue Res 317: 253–264. [DOI] [PubMed] [Google Scholar]
- 47. Cheung NS, Koh CH, Bay BH, Qi RZ, Choy MS, et al. (2004) Chronic exposure to U18666A induces apoptosis in cultured murine cortical neurons. Biochem Biophys Res Commun 315: 408–417. [DOI] [PubMed] [Google Scholar]
- 48. Futerman AH, van Meer G (2004) The cell biology of lysosomal storage disorders. Nat Rev Mol Cell Biol 5: 554–565. [DOI] [PubMed] [Google Scholar]
Associated Data
This section collects any data citations, data availability statements, or supplementary materials included in this article.
Supplementary Materials
Effect of the anti-prion compounds on cell proliferation.
(TIF)
Double-staining of PrPSc and PrPC.
(TIF)
Co-localization of PrPSc or PrPC with transferrin (Tfn).
(TIF)
Data Availability Statement
The authors confirm that all data underlying the findings are fully available without restriction. All relevant data are within the paper and its Supporting Information files.


