Abstract
The present work entailed perspicacious fabrication of Bitter Gourd Seed Oil Nanoemulsion (BGO-NE) for increasing bioavailability of CLnA in oxidative stress induced in vivo system. The BGO-NE was characterized and evaluated for dimensional as well as rheological changes periodically during a 12 week storage period. BGO comprising ∼50 % α-eleostearic acid, was assessed in conventional and NE formulation at different doses, for its ability to stimulate antioxidative enzyme marker paradigm comprising SOD, GPx, CAT and GSH, inherent to the subjects under study. The formulated BGO-NE (d < 100 nm) was found to be stable for 12 weeks compared to BGO-CE as was determined by particle size characterization and associated parameters. Diet supplementation of 0.5 % (w/v) BGO-NE formulation exhibited maximum efficiency in countering oxidative stress as compared to 1 % BGO-NE formulation and equivalent doses of BGO-CE. Higher efficacy at very low dose of the nano-sized formulation was thus, also established. Histopathological data from liver, pancreas and kidney sections corroborated the above findings. The present study with formulated BGO-NE and BGO-CE evaluates and confirms the implications of a NE formulation of a bioactive lipid - conjugated linolenic acid (CLnA), targeting specific in vivo processes to counter the negative influence of excess ROS (Reactive Oxygen Species) in the system. It, thus presents itself as a potent nutraceutical against diabetes mellitus in an optimized delivery system.
Keywords: Bitter gourd seed oil, Nanoemulsion, Bioavailability, Alloxan, Diabetes Mellitus
Introduction
Nanoemulsions (NE) have emerged as one of the most efficient colloidal delivery system hitherto and are increasingly being used in the food and pharmaceutical industries to encapsulate, protect and deliver lipophilic bioactive compounds. Given to the kinetically stable state of the NE system wherein each globule of emulsion reaches approximately 20–500 nm (Bernardi et al. 2011), it confers a distinct advantage over other delivery systems which includes a number of potential benefits for certain applications: i) enhanced long term stability of the particles in the delivery system; ii) high optical clarity; and iii) increased bioavailability (Mason et al. 2006). However, the numerous potent functional attributes of a NE depends on its polydispersity index (PdI), droplet size, surfactants used in reducing the interfacial tension between the two immiscible liquid phases (which contributes to the particle stability, rheology, appearance, color, texture, shelf life) and its resistance against Ostwald ripening (Qian and McClements 2011), a major factor contributing to the stability concern of NE. It should be noted in this respect, that a poor understanding of the influence of the sample composition and environmental condition on the formulation prepared, limits the wide scale use of surfactants in food industries.
Consequently, the availability of food grade NE are scarce and merits further research before up-scaling therapeutic and other commercial applications of NE based delivery systems.
CLnA isomers are known to enhance immunity, act as potent anti-inflammatory and anti-adipogenic agents, plays a prominent role in improving cardiovascular health and has also shown anti-carcinogenic activities (Hennessy et al. 2011). Bitter gourd oil consists of ∼30–50 % α-eleostearic acid (ESA) (Saha and Ghosh 2010) whose antioxidative role in scavenging ROS have been reported by Dhar et al. (1999). Inside in vivo system however, the action of CLnAs largely depends on its permeability across GI tract which directly implies its bioavailabilty. Moreover, transport of CLnA across GI tract is very slow and involves quick conversion into conjugated linoleic acid (CLA) (Tsuzuki et al. 2006) thereby limiting its efficacy. The absorption of CLnA can be improved significantly by converting the lipid fractions comprising them into nanoemulsions due to: i) the presence of surfactants which enhances penetration across cellular membranes due to its amphiphilicity (Kreilgaard 2002); ii) uptake of hydrophobic bioactive agents (including lipid components) is inversely proportional to the size of delivery systems (Lee et al. 2011).
The focus of the present study was to develop a food grade NE delivery system for CLnA which may be considered as a nutraceutical with long term stability and for evaluating its role in relieving stress induced as a consequence of the free radicals generated during diabetic conditions by contributing to the pre-existing antioxidative system. Previous studies indicated oral administration of α-eleostearic acid (ESA) (present in BGO) worked optimally at 0.5 % of the oil fed to the in vivo systems in conferring health benefits (Dhar et al. 2006). Thus, a rationale behind this attempt also entailed to evaluate the efficiency of ESA in the formulated NE compared to CE system on in vivo oxidative stressed system at lower dosage (∼0.25 %) than 0.5 % (as has been established previously). This is the first report of ESA rich NE formulation and their anti-diabetic as well as antioxidative implications. The present study also has a lot of heuristic importance in terms of understanding the fate of bioactive lipids converted in nano-sized kinetically stable emulsion forms across the GI tract.
Materials and methods
Extraction and refining of bitter gourd oil
Authentic bitter gourd seeds were procured from local market of Kolkata, India and oil was extracted from the seeds with food grade solvent n-hexane under low temperature – low agitation inert conditions. It was refined by miscella refining process (Dhar et al. 1999). The oil was recovered under vacuum and stored at −20 °C under nitrogen till further use.
Fatty acid analysis
Gas liquid chromatography (GLC, Agilent technologies, India) equipped with flame ionization detector (FID) and DW Wax capillary column (30 m length × 0.25 m internal diameter) (J and W Scientific columns from Agilent technologies) was employed to identify and quantify the methyl esters of fatty acids present in the extracted BGO (Table 1).
Table 1.
Fatty acid composition of bitter gourd oil as obtained by gas-liquid chromatography
| Test fat | Fatty acid composition (w/w %) | |||||
|---|---|---|---|---|---|---|
| C14:0 | C16:0 | C18:0 | C18:1 | C18:2 | C18:3 | |
| Bitter gourd oil | – | 2.4 | 31.3 | 8.0 | 7.9 | 50.4 |
n.b.Spectrophotometric analysis of the bitter gourd oil showed maximum absorbance at 270 nm corresponding to the highest peak
Preparation of BGO nanoemulsion
Various surfactants with no reported toxic effects i.e. extremely high LC50/LD50 values were evaluated to arrive at a stable nanoemulsion formulation: Tween 20(LD50-oral in rats: 36,700 μl/kg as per CAS #9005-64-5) and Span 80(LD50-oral in rats: 34,500 μl/kg as per CAS #9005-65-6) surfactant combination were found to result in a stable formulation with ESA rich BGO which was chosen for further study.
The nanoemulsion was prepared according to the Emulsion Phase Inversion (EPI) method with few modifications (Dey et al. 2012). The oil phase comprising BGO (2 g) was mixed together with 0.65 g Span 80 under constant agitation by magnetic stirrer at 700 rpm under constant temperature of 27 °C until a homogenous dispersion phase was formed. On the other hand, the aqueous phase was prepared by mixing 100 ml distilled water with 0.65 g of Tween 20 (hydrophilic surfactant) under similar conditions. The hydrophilic phase was added to the hydrophobic phase under constant agitation at 700 rpm for 30 min and was homogenized at 10,000 rpm by Ultra Turrax T25 (IKA Werke, GmbH and co.) in the presence of an ice sheath for 30 min to form a coarse emulsion.
This was followed by High Pressure Homogenisation using Electric Bench-top Ultra High Pressure Homogenizer (Nano DeBEE, BEE INTERNATIONAL, INC., South Easton, MA 02375) at for 10 passes at 40,000 psi under cooling condition till the formation of nanoemulsion. The resultant formulation was stored at 25 °C.
Particle size measurements
Particle size distribution and cumulant mean particle size of the prepared nanoemulsion (in terms of hydrodynamic diameter) was determined using a dynamic light scattering instrument (DelsaTM Nano C Particle Analyzer, Beckman Coulter, Inc., USA) (Lindner 2002).
Particle electrical charge measurements
Particle electrical charge (z-potential) in the nanoemulsions was determined using Electrophoretic Light Scattering based on the Doppler Effect; hence, also called the “Laser Doppler Method” (DelsaTM Nano C Particle Analyzer, 139 Beckman Coulter, Inc., USA) as described previously by us (Dey et al. 2012).
Rheology analysis
The viscosity and the flow profile of the prepared nanoemulsion was analyzed in a Brookfield DV II+ 143 PRO Cone/Plate Viscometer (Brookfield Engineering Laboratories, Middlesboro, USA), using CPE 42 spindle, which operated at maximum 200 rpm generating maximum shear rate of 760 s−1, at 25 °C ± 1 °C. The coarse preparation of BGO-CE, however, was not assessed for rheological changes due to its apparent regressed state during storage period.
Animal experiment
Under the supervision of the Institutes Animal Ethical committee of the Department of Chemical Technology, 36 male albino rats (Charles Foster strain) (100–150 g) were divided into five groups each consisting of six rats having equal average body weight and acclimated for 7 days to the laboratory conditions and fed on a standard diet and water ad libitum until the beginning of the experiments. Only, the NE formulation was administered using gavage. Subsequently, the animals were divided into four groups:
-
Group-A:
Received Sunflower oil diet (without alloxan exposure);
-
Group-B:
Received Sunflower oil diet (with alloxan exposure via intraperitoneal injection);
-
Group-C:
Received intraperitoneal alloxan injection followed by oral administration of sunflower oil: nano-emulsion (99.5: 0.5 v/v) which contains 0.25 % CLnA fed once daily and continued till the investigation period;
-
Group-D:
Received intraperitoneal alloxan injection followed by oral administration of BGO nanoemulsion with sunflower oil: nano-emulsion (99: 1 v/v) which contains 0.5 % CLnA;
-
Group-E:
Received diet similar to group C but nanoemulsion was replaced by conventional emulsion of BGO;
-
Group-F:
Received diet similar to group D but nanoemulsion was replaced by conventional emulsion of BGO.
The diet was maintained as previously described by Dhar et al. (1999). Diabetic state was induced by a single i.p. injection of 180 mg/kg body weight of alloxan (Sigma-Aldrich, USA). The animals were protected from unexpected death by i.p. injection of 6 mL 20 % glucose together with 5 % glucose used as a drinking solution. On day 3 after alloxan treatment, blood glucose was measured. The rats were considered diabetic if the values of blood glucose were more than 85 mg/dL. Weekly blood glucose levels of the rats of each group were noted.
Rats were maintained on the above diet ad libitum for 4 weeks. Rats were killed while under mild anaesthesia, blood was collected from hepatic portal vein; liver, kidney and pancreas were immediately excised, blotted, and stored at −20 °C before analysis.
Lipid peroxidation studies
Plasma peroxidation
Plasma peroxidation was measured by the modified TBARS method (Saha and Ghosh 2010).
Preparation of erythrocyte lysate
Erythrocyte membrane ghost was prepared and EM lipid peroxidation was measured according to a previously established method (Dhar et al. 2007).
Tissue lipid peroxidation
Tissue lipid peroxidation of liver was measured in accordance with our previously mentioned report (Dhar et al. 1999).
Study of antioxidative parameters
SOD, Catalase, GSH and GPx of liver tissues were measured by using commercial kits.
Histopathological study
Liver, pancreas and kidney were excised and after fixing in 10 % formalin saline for 3–4 days, blocks were prepared and sections stained with haematoxylin and eosin by routine procedures (Benjamin et al. 2006). At least, ten random images were taken of each tissue section at 40× magnification with the aid of DM750 photomicroscope (Leica Microsystems GmbH, Wetzlar, Germany).
Statistical analysis
Data were analyzed using one way ANOVA and expressed as mean ± SEM. Duncans t-test was also used for statistical analysis between groups with the aid of SPSS 20. The differences between means were accepted significant at P < 0.05.
Results and discussion
Preparation of ESA- NE and ESA- CE
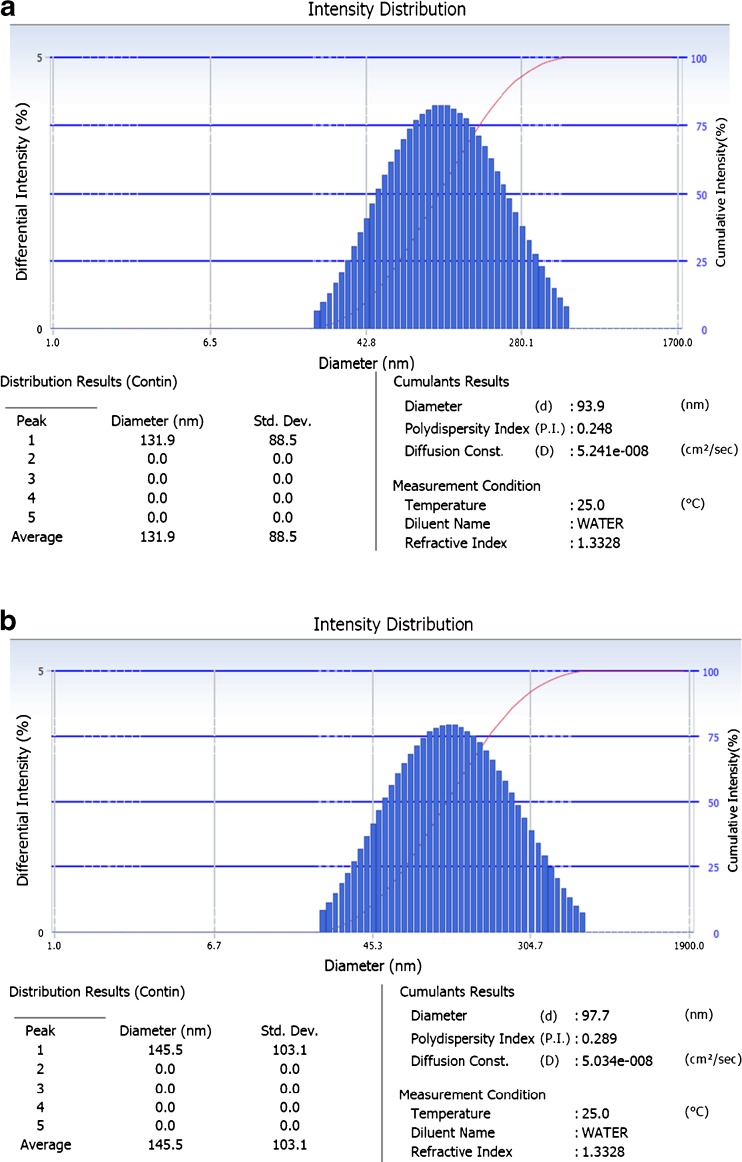
BGO was emulsified in aqueous phase consisting of triple distilled water and emulsifier by two stage homogenisation process for NE fabrication. The part of the CE which was subjected to high pressure homogenisation brought down the z-average droplet diameter well below 100 nm with PdI in the range of 0.248 which increased non-significantly to 0.289 at the end of 12 weeks storage period (Table 2) (Fig. 1a and b for DLS data) (Huang et al. 2009).
Table 2.
Particle characterisation of fabricated BGO nanoemulsion
| Time (weeks) | Particle dimensions | |||
|---|---|---|---|---|
| Z-average diameter | PdI | ζ potential | D (90 %) | |
| 0 | 93.9 ± 2.6 nm | 0.248 | 27.88 | 248.7 |
| 4 | 98.0 ± 2.1 nm | 0.227 | 30.74 | 245.1 |
| 8 | 97.9 ± 2.2 nm | 0.239 | 32.82 | 261.7 |
| 12 | 97.7 ± 4.2 nm | 0.289 | 33.72 | 280.4 |
Z-average diameter: indicates cumulative index of the prepared nanoemulsion; PdI: polydispersity index; ζ potential: Zeta potential; D (90 %): indicates 90 % quantile of Cumulative Intensity Distribution
Fig. 1.
a BGO nanoemulsion characterization for droplet size after preparation. Result represented as DelsaTM Nano (Beckman Coulter, Inc., USA) software generated data. b BGO nanoemulsion characterization for droplet size after storage at 25 °C (12 weeks). Result represented as Delsa™ Nano (Beckman Coulter, Inc., USA) software generated data
The electrical potential at the hydrodynamic shear surface of emulsion droplets obtained is also shown in Table 2. The z-potential decreased only marginally from 33.72 mV to 27.88 mV at the end of the storage period of 12 weeks, which is consistent with the size stabilization after the first 4 weeks. This observation indicated the electro-kinetic stability of the colloidal system which was in agreement with the findings of Lee et al. (2011).
Further, previous reports on surface response methodology models of nanoemulsions suggest that the oil in any o/w NE system can be concluded stable if the physico-chemical parameters i.e. particle size, zeta potential, polydispersity index and rheology of the fabricated system remains significantly unchanged during the storage period under study (Mirhosseini et al. 2007). The observations with the parameters for BGO-NE concurred with a stable NE system for the storage period.
Emulsion rheology characterization
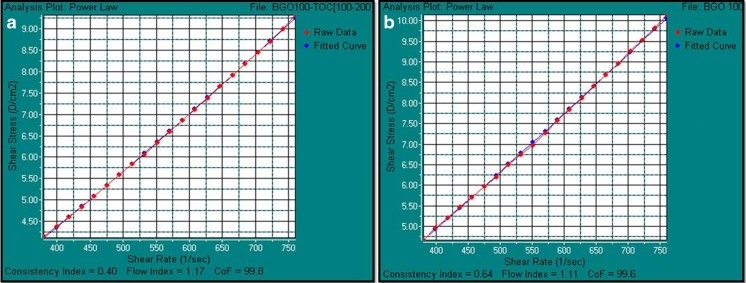
Viscosity of the fabricated BGO-NE was measured at shear rate of 760 s−1 against proportionately varying shear stress between (0–10) D/cm2 or (0–1) N/m2 (Table 3 and Fig. 2) throughout the storage period of 12 weeks. The analysis for BGO-NE showed very close similarities with best fit curves plotted according to the Power law model for near ideal Newtonian fluid i.e. water, with a confidence of fit ≥99.6 % during the 12 week storage period with negligible shear thinning (Floury et al. 2000).
Table 3.
Rheological changes with respect to the storage period of BGO nanoemulsion
| Time (weeks) | Viscosity (cPs)a |
|---|---|
| 0 | 1.21 ± 0.0014 |
| 4 | 1.25 ± 0.0015 |
| 8 | 1.33 ± 0.0032 |
| 12 | 1.37 ± 0.0015 |
aCenti Poise
Fig. 2.
Power model plots of the fabricated BGO – NE w.r.t. a near ideal Newtonian fluid (water) as fitted curve: a Power law model of the fabricated BGO-NE immediately after preparation (0 weeks); b Power law model of the fabricated BGO-NE after 12 weeks
The results indicated that the formulated system of NE was maintained as a mono-phase colloidal delivery system throughout the entire storage period of 12 weeks with consistent flow index of ∼1.1 and consistency index of 0.4–0.64 (Fig. 2).
Effect on blood glucose level
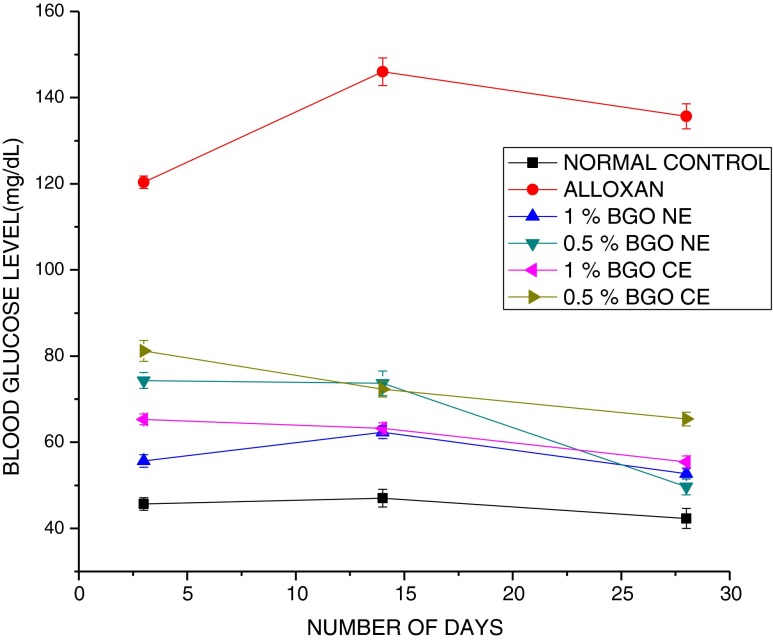
The oral administration of 0.5 % and 1 % NE which contains 0.25 % and 0.5 % ESA respectively resulted in significant reduction in blood glucose level in alloxan induced diabetic rats after 4 weeks compared to corresponding doses of CE (Fig. 3).
Fig. 3.
Effect of BGO nanoemulsion supplemented along with diet at varying levels. Normal indicates healthy normal rat diet fed group; ALLOXAN indicates alloxan induced (180 mg/kg body weight) untreated group; 1 % BGO-NE refers to the diabetic group orally fed 1 % of the fabricated BGO-NE containing 0.5 % ESA; 0.5 % BGO-NE refers to the diabetic group orally fed 0.5 % of the fabricated BGO-NE containing 0.25 % ESA; 0.5 % BGO-CE refers to the diabetic group orally fed 0.5 % BGO-CE containing 0.25 % ESA and 1 % BGO-CE group refers to the diabetic group orally fed 1 % BGO-CE containing 0.5 % ESA. Values are presented as mean ± SEM (n = 6). At the end of 28 days blood glucose level in experimental groups were as follows: Alloxan>0.5 % CE > 1 % CE>1 % NE>0.5 % NE>Normal. *Mean values were significantly different from those of ALX (alloxan)
Reports (Yasui et al. 2005) have indicated that at in vitro level, ESA up regulates PPARγ which again has been shown to stimulate improvement in glucose tolerance and insulin sensitivity (Picard and Auwerx 2002). However, hitherto, in vivo experiments with CLnA (Saha and Ghosh 2012) have failed to reproduce the implications of the in vitro experiments in terms of reducing blood glucose level (Chuang et al. 2006). A significant drop in values of glucose level over the period of investigation with BGO-NE formulation could indicate optimum manifestations in blood glucose level as a direct consequence of increased bioavailability conferred by better delivery of CLnA to target tissues. Our previous studies have indicated that a strong correlation exists between the absorption of the liquid phase and the aqueous phase which insinuates that the fabricated NE absorption takes place almost as a single phase (Dey et al. 2012). The ability of BGO NE formulation to normalize the hyperglycaemic condition formed the preliminary basis of its anti-diabetic property.
Effect on plasma, erythrocyte and liver lipid peroxidation
Results (Table 4) showed that alloxan administration led to significant increase in lipid peroxidation of plasma, erythrocyte and liver tissue as compared to the respective control group.
Table 4.
Effect of BGO nanoemulsion comprising ESA and sunflower oil fed diabetic rats at 20 % fat in diet on lipid peroxidation of plasma, erythrocyte membrane and liver tissue lipids
| Group | Fat diet | Plasma lipid peroxidation (nmole of MDA/mL) | Erythrocyte membrane lipid peroxidation (nmole of MDA/mL) | Liver tissue lipid peroxidation (nmole of MDA/mL) |
|---|---|---|---|---|
| Control (non-diabetic) | SO | 10.71 ± 0.414# | 6.64 ± 0.44# | 1.62 ± 0.34# |
| Diabetic groups | SO | 27.21 ± 0.35 | 15.23 ± 0.26 | 3.4 ± 0.62 |
| SO+ 0.5 % ESA NEa | 5.34 ± 0.25* | 3.26 ± 0.17* | 1.42 ± 0.81* | |
| SO+ 0.25 % ESA NEb | 4.8 ± 0.33* | 2.83 ± 0.91* | 1.28 ± 0.33* | |
| SO+ 0.5 % ESA CEc | 5.2 ± 0.32* | 4.23 ± 0.42* | 1.73 ± 0.63* | |
| SO+ 0.25 % ESA CEd | 6.12 ± 0.27* | 4.4 ± 0.31* | 2.5 ± 0.24* | |
| [MDA] comparison among diet groups | ALX(SO)>CON(SO)>0.25 % ESA CE>0.5 % ESA NE>0.5 % ESA CE >0.25 % ESA NE | |||
Values are mean ± SEM, n = 6
(ALX-D) treated diabetic group fed with sunflower oil
SO sunflower oil; BGO bitter gourd oil; ESA α-eleostearic acid; NE nanoemulsion
*Marked results show mean values for the BGO NE treated experimental groups that are statistically different (p < 0.05) than the alloxan (ALX-D) treated diabetic group fed with sunflower oil diet.
#Marked results show mean values for the non diabetic control group that are statistically different (p < 0.05) than the alloxan
a0.5 % ESA NE is present in 1 % BGO NE; b0.25 % ESA NE is present in 0.5 % BGO NE; c0.5 % ESA CE is present in 1 % BGO CE; d0.25 % ESA CE is present in 0.5 % ESA CE
However, the diabetic rats orally force fed with NE and CE showed significant amelioration (p < 0.05) in condition as evinced by the reduction in MDA formation (Table 4).
Effect on antioxidant and pro-oxidant enzyme parameters
Increase in ROS in the metabolic system due to oxidative stress forms the aetiological basis of diabetic complications. ROS in excessive levels lead to membrane lipid peroxidation (Dhar et al. 2007), cellular protein and nucleic acid damage and eventually death. Diabetogens causes incongruousness among the antioxidant defence enzymes present in vivo which leads to increase in ROS in excess levels. In presence of GSH and other thiols alloxan is reduced to dialuric acid in a redox cycling reaction. This cyclic reaction between alloxan and its reduction product generates ROS which initiates beta cell toxic action of alloxan and thus destroys insulin- producing cells. Superoxide radicals (O2.-) are generated from autoxidation of dialuric acid in addition to hydrogen peroxide (H2O2). Other thiols at lower concentrations in cell such as the monothiol cysteine and other thiols as well as ascorbic acid, also contribute to a lesser extent in alloxan reduction. ROS may also be generated with enzymatic proteins and albumin. Formation of alloxan – GSH adduct termed as “Compound 305” during each redox cycle increases in a time dependent manner leading to diminished GSH levels (Winterbourn and Munday 1989).
Interestingly, GSH plays a multifarious role in metabolism as a non-enzymatic tripeptide in antioxidative defence mechanism as a member of GPx family. GSH also acts as cofactor for the GPx family and prevents protein-SH from oxidation and cross linking (Halliwell and Gutteridge 2001).
The antioxidative defence system in alloxan induced diabetes mellitus group of rats was found to be significantly (p < 0.05) compromised in SOD, GPx, CAT cellular GSH when compared to the normal control group in both plasma and liver homogenate fractions (Figs. 4 and 5).
Fig. 4.
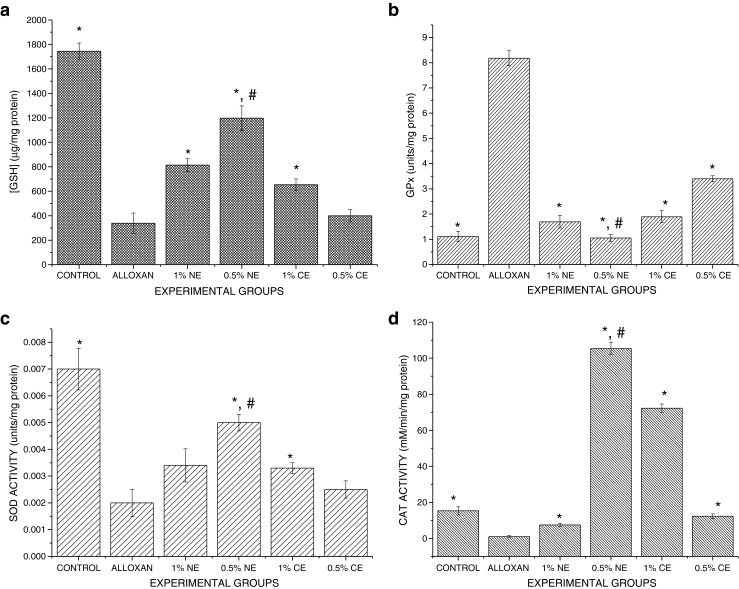
Effect of BGO nanoemulsion supplementation on antioxidative biomarkers present in the plasma. Values are presented as mean ± SEM (n = 6). a: GSH levels: CONTROL>0.5 % BGO-NE >1 % BGO-NE>1 % BGO-CE>0.5 % BGO-CE>Alloxan; b GPx enzyme activity: Control < 0.5 % BGO-NE < 1 % BGO-NE < 1 % BGO-CE < 0.5 % BGO-CE<Alloxan; c SOD activity: Control>0.5 % BGO-NE>1 % BGO-NE>1 % BGO-CE>0.5 % BGO CE>Alloxan; d CAT activity: 0.5 % BGO-NE>1 % BGO-CE>CONTROL>0.5 % BGO-CE>1 % BGO-NE>Alloxan. * Experimental groups vs alloxan (ALX-D) group (p < 0.05). # 0.5 % BGO-NE vs other treated Experimental groups (p < 0.05)
Fig. 5.
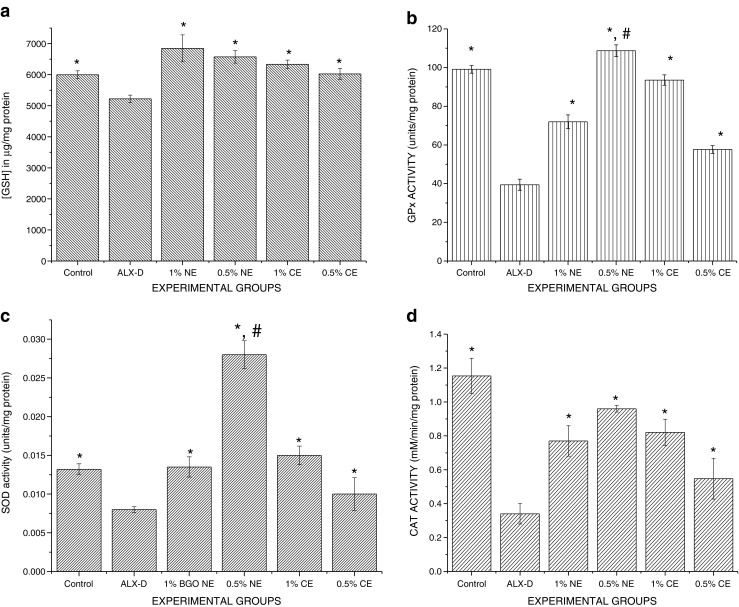
Effect of BGO nanoemulsion supplementation on antioxidative biomarkers present in the liver. Values are presented as mean ± SEM (n = 6). a GSH levels: 0.5 % BGO-NE >1 % BGO-NE >1 % BGO-CE>0.5 % BGO-CE>CONTROL>ALLOXAN. b GPx enzyme activity: 0.5 % BGO-NE>CONTROL>1 % BGO-CE>1 % BGO-NE>0.5 % BGO-CE>ALLOXAN. c SOD activity: 0.5 % BGO-NE>1 % BGO-CE>CONTROL ≥ 1 % BGO-NE>0.5 % BGO-CE>ALLOXAN. d CAT activity: CONTROL>0.5 % BGO-NE>1 % BGO-CE>0.5 % BGO-CE>1 % BGO-NE>ALLOXAN. * Experimental groups vs alloxan (ALX-D) group (p < 0.05). # 0.5 % BGO-NE vs other treated experimental groups (p < 0.05).
0.5 % BGO-NE supplemented diabetic group showed significant improvement (p < 0.05) in the antioxidative enzymes (GPx, SOD, CAT) in both liver homogenate and plasma fractions as compared to the 1 % BGO-NE and their corresponding CE fractions (0.5 % BGO-CE and 1 % BGO-CE). In the plasma, the GPx activity was found to be in over sensitized state (Fig. 4b) in alloxan induced diabetic and untreated group than in the normal group. Though all the BGO formulations (NE as well as CE) were significantly effective in regulating the elevation (p < 0.05) compared to the alloxan induced untreated group (Group B), it was found that a significant difference in activity prevailed between 0.5 % BGO nanoemulsion treated groups than 1 % BGO nanoemulsion and their corresponding 0.5 % and 1 % CE treated groups. In the liver homogenate, however, GPx activity was found to be significantly depressed (p < 0.05) in alloxan induced diabetic rats. The liver homogenate from diabetic rats receiving BGO formulations (CE and NE) however indicated significant improvement in activity. The effect was more pronounced (p < 0.05) in the rats receiving 1 % BGO NE, 0.5 % CE and 1 % CE formulations. Both SOD and CAT activity in liver homogenate and plasma fraction was found to be significantly suppressed (p < 0.05) (Figs. 4c, d and 5c, d) in alloxan induced diabetic groups receiving only sunflower oil as fat supplementation in the diet. The trend in activity paradigm of CAT and SOD in BGO formulations (CE & NE) receiving groups however seemed to indicate amelioration w.r.t. the activity found in normal rats from typical diabetic manifestations in untreated group. This ameliorative trend, quite notably, was overtly expressed in case of 0.5 % BGO nanoemulsion formulation treated group than in 1 % BGO NE, 0.5 % CE and 1 % CE formulation treated groups. SOD activity was significantly high (p < 0.05) in both plasma and liver homogenate fractions in the group receiving 0.5 % BGO nanoemulsion formulated diet and was better than all the other groups receiving 1 % BGO NE, 0.5 % CE and 1 % CE formulations (Figs. 4 and 5 respectively) and even bettering the normal control group in liver homogenate.
A conspicuous boost in cellular GSH content (p < 0.05) was found in plasma as well as liver homogenates of all the groups receiving BGO formulations (NE & CE) compared to the untreated group. The results indicated that dose difference did not significantly affect/alter the cellular GSH content between the experimental groups.
In general, however, 0.5 % BGO nanoemulsion formulated diet supplemented group (comprising ∼0.25 % ESA) was better stimulated in circumventing the oxidative stress caused due to alloxan toxicity by augmenting antioxidative enzymes in both plasma and liver homogenate as compared to 1 % BGO NE, 0.5 % CE and 1 % CE formulated diet supplemented group (comprising ∼0.5 % ESA) (Figs. 4 and 5).
The present study shows a significant increase in level of SOD in 0.5 % BGO-NE treated group as compared to alloxan induced diabetic control group (p < 0.05). The 1 % BGO NE, 0.5 % CE and 1 % CE formulation treated diabetic group although showed lesser SOD activity than 0.5 % BGO-NE treated diabetic group, yet exhibited a significant improvement over the diabetic control group in liver fractions, although, not so in plasma fractions (except for 0.5 % BGO-NE and 1 % BGO-CE). The results were consistent with the observations made by Martim et al. (2003), in the context of erratic pattern of SOD activities in different tissue fractions of diabetic subjects. However, the lesser SOD activity in 0.5 % CE and 1 % NE formulations than 0.5 % BGO-NE and 1 % BGO-CE treated groups could be attributed to the increased plasma lipid and liver lipid peroxidation products caused during oxidative stress (p < 0.05) (Table 4).
0.5 % BGO-NE treated group showed an improved CAT activity over alloxan diabetic group in both liver and plasma fractions. Although CAT activity of 1 % BGO-NE group was maximum for liver fractions significant difference in activity was not found in plasma fractions as compared to the diabetic group. Increased levels of O2.- (superoxide) in plasma due to lesser SOD activity could lead to reduced CAT activity as it is inhibited by superoxide radicals (O2.-) (Das and Vasudevan 2005).
Increased ratios between SOD and CAT activity insinuates regulated glucose control in the system (Sözmen et al. 2001) thus implying the ameliorative role of BGO-NE and to some extent in BGO-CE formulations comprising ESA in relieving oxidative stress caused due to alloxan.
Our studies indicate decreased GPx activity in plasma in all the BGO-NE and BGO-CE treated diabetic groups as compared to diabetic control groups which are in agreement with previous studies (Mohan and Das 1998).
Improved intracellular GSH levels which acts as cofactors for GPx led to increased GPx stimulation and this finding was commensurate with that obtained by Saha and Ghosh (2012) which also made up for the diminished CAT activity in scavenging H2O2 and other organic peroxides from the in vivo system. Although there was a significant rise in GSH levels in 0.5 % BGO-NE diet supplemented group than 1 % BGO NE, 0.5 % BGO-CE and 1 % BGO-CE formulated diet supplemented group in plasma, there was no significant difference between the BGO nanoemulsion supplemented groups in GSH levels in liver homogenate. This can be explained by the role of 9 c, 11 t, 13 t - 18:3 conjugated octadecatrienoic fatty acids (ESA) as described by Dhar et al. (2006) as free radical scavengers present in the investigated in vivo system.
Alloxan, cytotoxic glucose analogue exerts its diabetogenic pathological manifestations by specifically inhibiting glucokinase (glucose sensor of β cell) causing selective β cell necrosis which leads to insulin-dependent diabetes mellitus. Cellular uptake is facilitated by low affinity GLUT2 glucose transporters present in the β cell’s plasma membrane due to alloxan’s close structural similarity in terms of molecular shape to glucose. Liver cells also express the GLUT 2 glucose transporter as pancreatic cells with equal millimolar intracellular GSH concentration and thus are as gullible to alloxan toxicity as pancreatic cells (Rerup and Tarding 1969) but are also endowed with H2O2 inactivating enzymes such as catalase, thus, slightly reducing its propensity for alloxan toxicity implications. Export occurs via at least two transport mechanisms and distinct carriers from liver to plasma and bile (Halliwell and Gutteridge 2001). This concurs with the findings of the present study, which showed low GSH values in liver and plasma in alloxan induced diabetes mellitus group while significant improvement (p < 0.05) in GSH levels in plasma and liver fractions was observed in all the BGO NE and CE formulated groups. The probability of ESA in the said system also increased due to size reduction of the BGO in nanoemulsion formulation following oral treatment as has been observed and reported by Fasinu et al. (2011).
The afore mentioned studies thus indicated that the administration of our fabricated BGO-NE in different dosages ameliorated stressed state induced in the in vivo system due to type-2 diabetes induced by alloxan treatment; apparently by stimulating the inherent antioxidative defence mechanism at varying levels. The optimum effective dosage of BGO also reduced from 1 to 0.5 % due to administration in nanoemulsion formulation possibly due to increased bioavailability as has previously been shown by us (Dey et al. 2012).
Histology
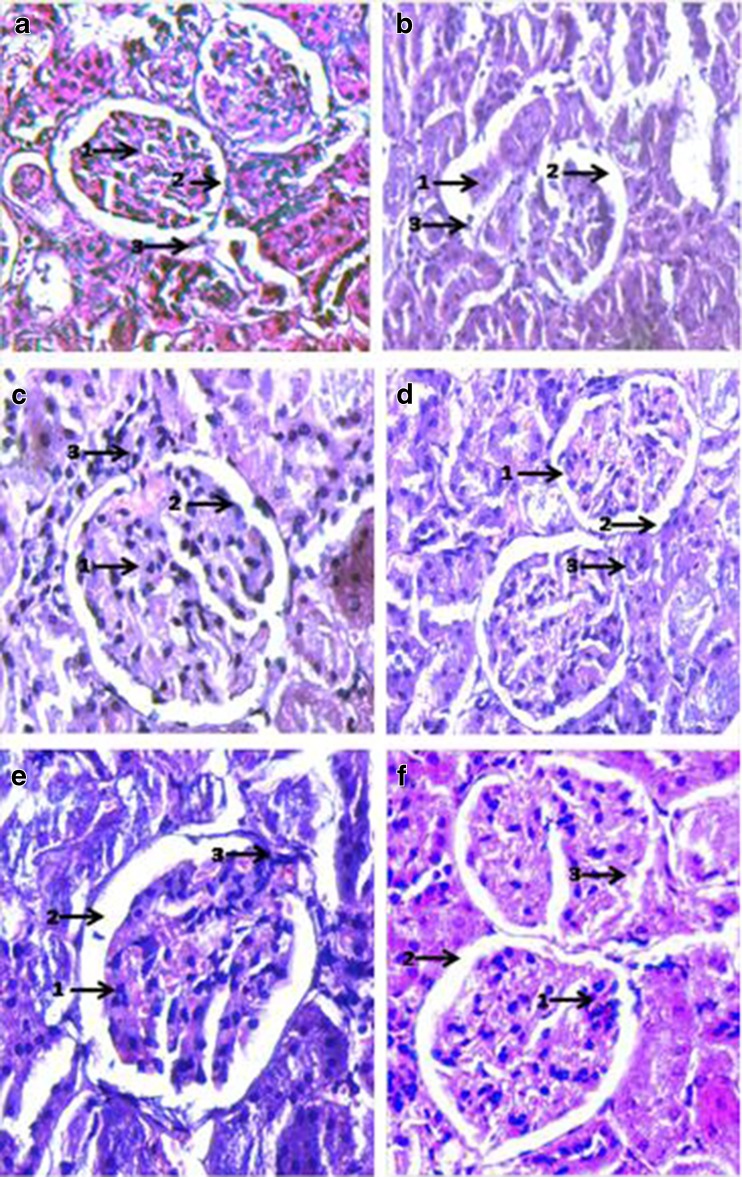
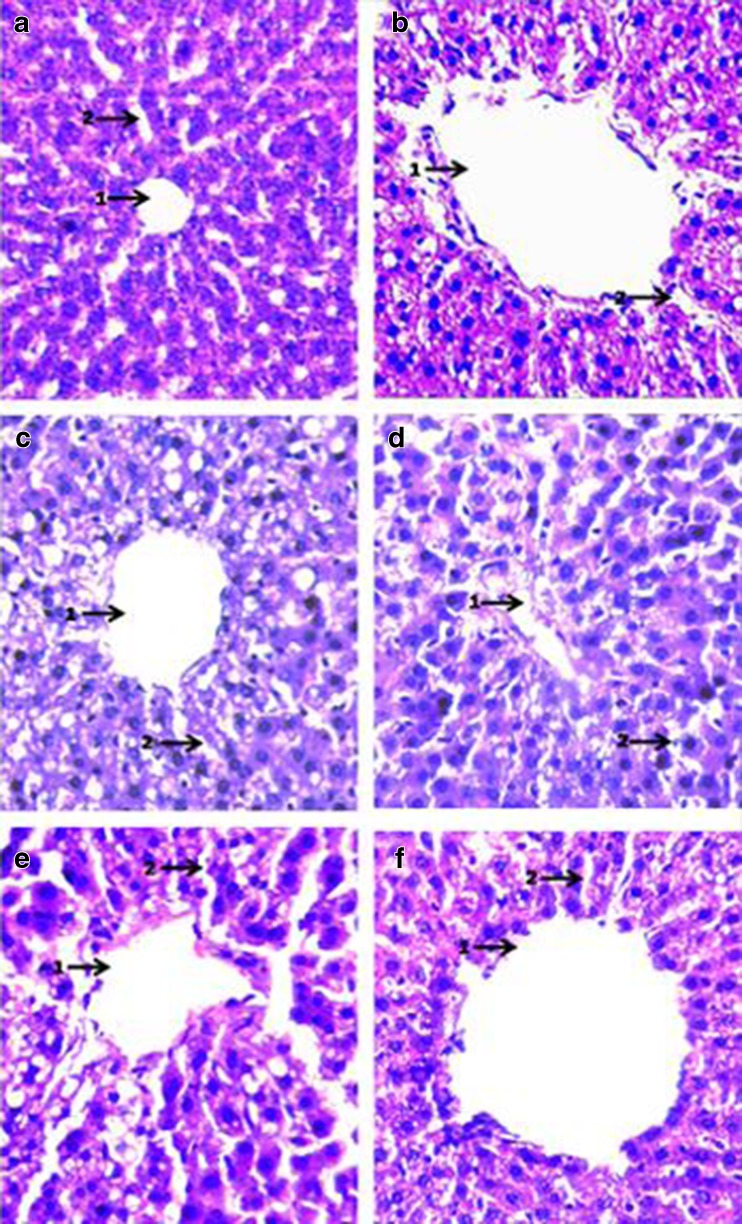
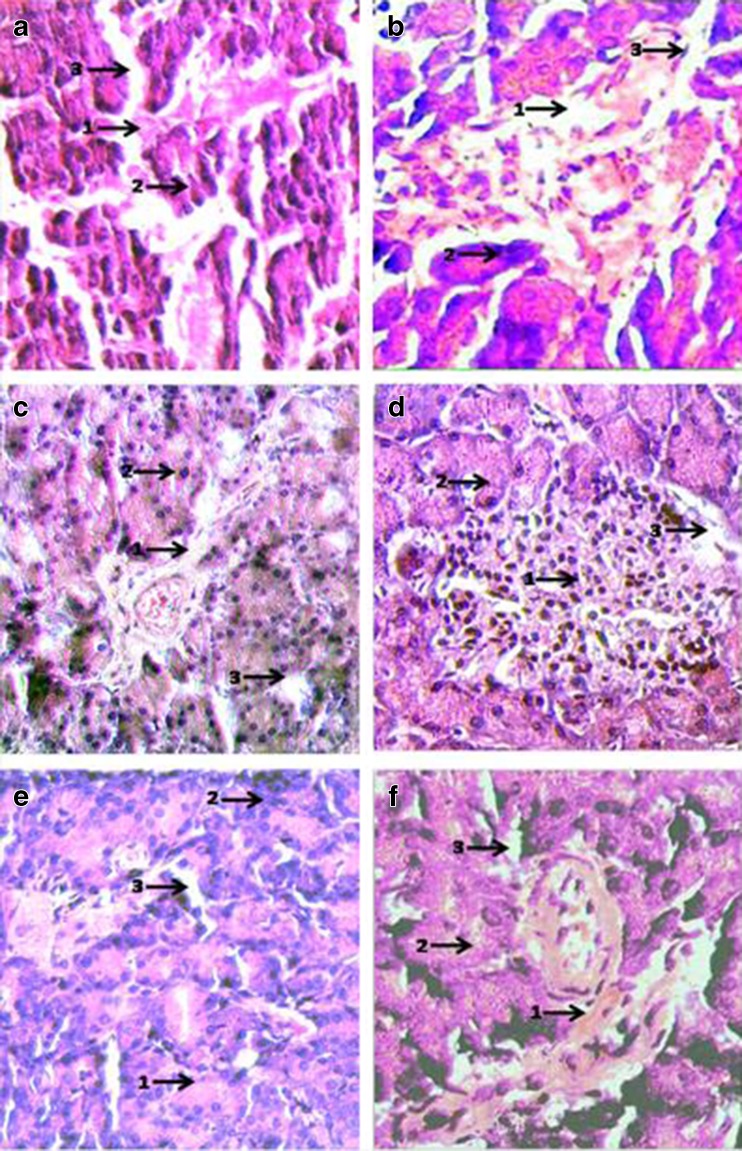
The Haematoxylin-Eosin stained sections of various tissues (kidney, liver and pancreas) was used to compare and assess the toxicity evoked by alloxan in the various experimental groups with normal rats. The ameliorative role of BGO-NE at various levels in restituting normal conditions was thus also assessed (Figs. 6, 7, and 8).
Fig. 6.
Histopathological examination of Haematoxylin-Eosin stained sections of Kidney (Magnification × 400): a: Negative Control (SO fed + non-diabetic): 1. Total no. of mesangial cells/mesangial area does not exceed 3; 2. Tubes lined by well defined single line of cells; 3. Capillary loops of glomerulus open and patent. b Positive Control (SO fed in alloxan induced diabetic rats). 1. No. of mesangial cells undefined; 2. Atrophy of normal Glomerular structure; 3. Necrosis of capillary loops of glomerulus. c SO + (0.5 % ESA) NE fed in alloxan induced diabetic rats. 1. No. of mesangial cells/mesangial area ≤ 3; 2. Nucleus in few cases not well defined; 3. Glomerulus mostly intact/reclaimed. d SO + (0.25 % ESA) NE fed in alloxan induced diabetic rats. 1. No. of mesangial cells per mesangial area does not exceed 3; 2. Tubes lined by a well defined single line of cells with well defined nucleus; 3. Glomerular capillaries open and intact. e SO + (0.5 % ESA) CE fed in alloxan induced diabetic rats. 1. No. of mesangial cells per mesangial area does not exceed 3; 2. Tubes lined by a well defined single line of cells with well defined nucleus; 3. Glomerular capillaries slightly distended but intact. f SO + (0.25 % ESA) CE fed in alloxan induced diabetic rats. 1. Mesangial cells/mesangial area does not exceed 3 in most cases; 2. Tubes lined by a well defined single line of cells with well defined nucleus; 3. Glomerular capillaries mostly distended
Fig. 7.
Histopathological examination of Haematoxylin-Eosin stained sections of liver (magnification × 400): a Negative control (SO fed + non-diabetic): 1. Patent central vein surrounded by well defined hepatocytes; 2. Sinusoids well defined. b Positive control (SO fed in alloxan induced diabetic rats) 1. Leaky central vein (extremely distended) surrounded by ruptured hepatocytes; 2. Distorted sinusoids. c SO + (0.5 % ESA) NE fed in alloxan induced diabetic rats: 1. Central vein significantly reclaimed with slightly enlarged hepatocytes; 2. Sinusoids well defined in major areas. d SO + (0.25 % ESA) NE fed in alloxan induced diabetic rats: 1. Central vein comparable with normal control surrounded by regular hepatocytes; 2. Sinusoids well defined. e SO + (0.5 % ESA) CE fed in alloxan induced diabetic rats: 1. Enlarged hepatocytes surrounding slightly distorted central veins; 2. Ruptured sinusoids. f SO + (0.25 % ESA) CE fed in alloxan induced diabetic rats: 1. Distended central vein surrounded by enlarged hepatocytes; 2. Sinusoids non-regular
Fig. 8.
Histopathological examination of Haematoxylin-Eosin stained sections of Pancreas (Magnification × 400): a Negative control (SO fed + non-diabetic): 1. Patent Islets of Langerhans (weakly stained); 2. Normal acinar cells (dark stained); 3. Regular blood Capillaries and vessels. b Positive control (SO fed in alloxan induced diabetic rats): 1. Ruptured Islets of Langerhans; 2. Ruptured and enlarged acinar cells; 3. Distended and ruptured blood vessels. c SO + (0.5 % ESA) NE fed in alloxan induced diabetic rats: 1. Reclaimed Islets of Langerhans; 2. Acinar cells with enlarged nuclei; 3. Open and patent blood vessels. d SO + (0.25 % ESA) NE fed in alloxan induced diabetic rats: 1. Completely reclaimed Islets of Langerhans with leukocyte infiltration in patches; 2. Regular/normal acinar cells; 3. Open and patent blood vessels. e SO + (0.5 % ESA) CE fed in alloxan induced diabetic rats: 1. Islets of Langerhans restituted; 2. Enlarged acinar cells; 3. Normal blood vessels. f SO + (0.25 % ESA) CE fed in alloxan induced diabetic rats: 1. Islets of Langerhans not restored completely; 2. Acinar cells not well defined; 3. Distorted blood vessels
As a corollary, the present study provides strong evidence in support of NE compared to CE as an effective colloidal delivery system for bioactive lipids for transport across the GI tract and thereby promoting the efficacy of the same in stimulating various in vivo processes. Furthermore, based on particle size analysis and other related parameters, we have been successful in fabricating a highly stable NE-system with a low surfactant to oil ratio (0.65) with a considerable shelf life of ≥3 months. In addition, in our studies, the role of optimum dosage of α-eleostearic acid (CLnA) as a potent nutraceutical in relieving oxidative stress as conferred by alloxan inside in vivo system by directly galvanizing the paradigm concerning natural antioxidative defence system has also been conclusively elucidated. The recovery from severe tissue disorganization caused during free radical generated diabetes mellitus as a consequence of alloxan toxicity due to BGO-NE diet supplementation, at different doses, paves a way for using CLnA as a potent nutraceutical for future applications.
Acknowledgments
The authors would like to gratefully acknowledge the financial assistance granted by Indian Council of Medical Research (ICMR) and Centre for Research in Nanoscience and Nanotechnology (CRNN), Calcutta University, for providing necessary facilities. Miss Sanjukta Datta of Chemical Technology Department; and Mr. Sumanto Ghosh are also gratefully acknowledged for their needful assistance.
Conflict of interest
The authors have no conflict of interest to declare.
Abbreviations
- ESA
α-Eleostearic acid
- BGO
Bitter gourd oil
- CLnA
Conjugated linolenic acid
- GI
Gastro-intestinal
- CAT
Catalase
- SOD
Superoxide dismutase
- GPx
Glutathione peroxidase
- GSH
Reduced glutathione
- NE
Nanoemulsion
- CE
Conventional emulsion
- ROS
Reactive oxygen species
References
- Bernardi DS, Pereira TA, Maciel NR, Bortoloto J, Viera GS, Oliveira GC, Rocha-Filho PA. Formation and stability of oil-in-water nanoemulsions containing rice bran oil: in vitro and in vivo assessments. J Nanobiotechnol. 2011;9:1–9. doi: 10.1186/1477-3155-9-44. [DOI] [PMC free article] [PubMed] [Google Scholar]
- Benjamin N, Kushwah A, Sharma RK, Katiyar AK. Histopathological changes in liver, kidney and muscles of pesticides exposed malnourished and diabetic rats. Indian J Exp Biol. 2006;44:228–232. [PubMed] [Google Scholar]
- Chuang C, Hsu C, Chao C, Wein Y, Kuo Y, Huang C. Fractionation and identification of 9c, 11t, 13t-conjugated linolenic acid as an activator of PPARα in bitter gourd (Momordica Charantia L.) J Biomed Sci. 2006;13:763–772. doi: 10.1007/s11373-006-9109-3. [DOI] [PubMed] [Google Scholar]
- Das KS, Vasudevan D. Monitoring oxidative stress in patients with non-alcoholic and alcoholic liver diseases. Ind J Clin Biochem. 2005;20:24–28. doi: 10.1007/BF02867396. [DOI] [PMC free article] [PubMed] [Google Scholar]
- Dey T, Ghosh S, Ghosh M, Koley H, Dhar P. Comparative study of gastrointestinal absorption of EPA & DHA rich fish oil from nano and conventional emulsion formulation in rats. Food Res Int. 2012;49:72–79. doi: 10.1016/j.foodres.2012.07.056. [DOI] [Google Scholar]
- Dhar P, Bhattacharyya D, Bhattacharyya DK, Ghosh S. Dietary comparison of conjugated linolenic acid (9 cis, 11 trans, 13 trans) and alpha-tocopherol effects on blood lipids and lipid peroxidation in alloxan-induced diabetes mellitus in rats. Lipids. 2006;41:49–54. doi: 10.1007/s11745-006-5069-7. [DOI] [PubMed] [Google Scholar]
- Dhar P, Chattopadhyay K, Bhattacharyya D, Roychoudhury A, Biswas A, Ghosh S. Antioxidative effect of Conjugated Linolenic acid in diabetic and non-diabetic blood: an in vitro study. J Oleo Sci. 2007;56:19–24. doi: 10.5650/jos.56.19. [DOI] [PubMed] [Google Scholar]
- Dhar P, Ghosh S, Bhattacharyya DK. Dietary effects of conjugated octadecatrienoic fatty acid (9 cis, 11 trans, 13 trans) levels on blood lipids and non-enzymatic in vitro lipid peroxidation in rats. Lipids. 1999;34:109–114. doi: 10.1007/s11745-999-0343-2. [DOI] [PubMed] [Google Scholar]
- Fasinu P, Viness P, Desendo N, Valence MK, du Toit LC, Choonara YE. Diverse approaches for the enhancement of oral drug bioavailability. Biopharm Drug Dispos. 2011;32:185–209. doi: 10.1002/bdd.750. [DOI] [PubMed] [Google Scholar]
- Floury J, Desrumaux A, Lardières J. Effect of high-pressure homogenization on droplet size distributions and rheological properties of model oil-in-water emulsions. Innovat Food Sci Emerg Tech. 2000;1:127–134. doi: 10.1016/S1466-8564(00)00012-6. [DOI] [Google Scholar]
- Halliwell B, Gutteridge JMC. Free radicals in biology and medicine. New York: Oxford University Press; 2001. pp. 105–170. [Google Scholar]
- Hennessy AA, Ross RP, Devery R, Stanton C. The health promoting properties of the conjugated isomers of α-linolenic acid. Lipids. 2011;46:105–119. doi: 10.1007/s11745-010-3501-5. [DOI] [PubMed] [Google Scholar]
- Huang Q, Yu H, Ru Q. Bioavailability and delivery of nutraceuticals using nanotechnology. J Food Sci. 2009;75:R50–R57. doi: 10.1111/j.1750-3841.2009.01457.x. [DOI] [PubMed] [Google Scholar]
- Kreilgaard M. Influence of microemulsions on cutaneous drug delivery. Adv Drug Deliv Rev. 2002;54:S77–S98. doi: 10.1016/S0169-409X(02)00116-3. [DOI] [PubMed] [Google Scholar]
- Lee SJ, Choi SJ, Li Y, Decker EA, McClements DJ. Protein-stabilized nanoemulsions and emulsions: comparison of physicochemical stability, lipid oxidation, and lipase digestibility. J Agric Food Chem. 2011;59:415–427. doi: 10.1021/jf103511v. [DOI] [PubMed] [Google Scholar]
- Lindner P. Neutron, X-rays and light scattering methods applied to soft condensed matter (North-Holland delta series) Amsterdam: Elsevier; 2002. p. 552. [Google Scholar]
- Mason TG, Wilking JN, Meleson K, Chang CB, Graves SM. Nanoemulsions: formation, structure, and physical properties. J Phys Condens Matter. 2006;18:R635–R666. doi: 10.1088/0953-8984/18/41/R01. [DOI] [Google Scholar]
- Maritim AC, Sanders RA, Watkins JB., 3rd Diabetes, oxidative stress, and antioxidants: a review. J Biochem Mol Toxicol. 2003;17:24–38. doi: 10.1002/jbt.10058. [DOI] [PubMed] [Google Scholar]
- Mirhosseini H, Tan CP, Hamid NS, Yusof S. Modeling the relationship between the main emulsion components and stability, viscosity, fluid behavior, zeta-potential, and electrophoretic mobility of orange beverage emulsion using response surface methodology. J Agric Food Chem. 2007;55:7659–7666. doi: 10.1021/jf071061k. [DOI] [PubMed] [Google Scholar]
- Mohan IK, Das UN. Effect of L-arginine-nitric oxide system on chemical-induced diabetes mellitus. Free Rad Bio Med. 1998;25:757–765. doi: 10.1016/S0891-5849(98)00129-4. [DOI] [PubMed] [Google Scholar]
- Picard F, Auwerx J. PPARγ and glucose homeostasis. Annu Rev Nutr. 2002;22:167–197. doi: 10.1146/annurev.nutr.22.010402.102808. [DOI] [PubMed] [Google Scholar]
- Qian C, McClements DJ. Formation of nanoemulsions stabilized by model food-grade emulsifiers using high-pressure homogenization: factors affecting particle size. Food Hydrocoll. 2011;25:1000–1008. doi: 10.1016/j.foodhyd.2010.09.017. [DOI] [Google Scholar]
- Rerup C, Tarding F. Streptozotocin- and alloxan-diabetes in mice. Eur J Pharmacol. 1969;7:89–96. doi: 10.1016/0014-2999(69)90169-1. [DOI] [PubMed] [Google Scholar]
- Saha SS, Ghosh M. Ameliorative role of conjugated linolenic acid isomers against oxidative DNA damage induced by sodium arsenite in rat model. Food Chem Toxicol. 2010;48:3398–3405. doi: 10.1016/j.fct.2010.09.011. [DOI] [PubMed] [Google Scholar]
- Saha SS, Ghosh M. Antioxidant and anti-inflammatory effect of conjugated linolenic acid isomers against streptozotocin-induced diabetes. Br J Nutr. 2012;108:974–983. doi: 10.1017/S0007114511006325. [DOI] [PubMed] [Google Scholar]
- Sözmen EY, Sözmen B, Delen Y, Onat T. Catalase/superoxide dismutase (SOD) and catalase/paraoxonase (PON) ratios may implicate poor glycemic control. Arch Med Res. 2001;32:283–287. doi: 10.1016/S0188-4409(01)00285-5. [DOI] [PubMed] [Google Scholar]
- Tsuzuki T, Kawakami Y, Abe R, Nakagawa K, Koba K, Imamura J, Iwata T, Ikeda I, Miyazawa T. Conjugated linolenic acid is slowly absorbed in rat intestine, but quickly converted to conjugated linoleic acid. J Nutr. 2006;136:2153–2159. doi: 10.1093/jn/136.8.2153. [DOI] [PubMed] [Google Scholar]
- Winterbourn CC, Munday R. Glutathione-mediated redox cycling of alloxan: mechanisms of superoxide dismutase inhibition and of metal-catalyzed OH formation. Biochemical Pharmacol. 1989;38:271–277. doi: 10.1016/0006-2952(89)90037-3. [DOI] [PubMed] [Google Scholar]
- Yasui Y, Hosokawa M, Sahara T, Suzuki R, Ohgiya S, Kohno H, Tanaka T, Miyashita K. Bitter gourd seed fatty acid rich in 9c,11 t,13 t-conjugated linolenic acid induces apoptosis and up-regulates the GADD45, p53 and PPARγ in human colon cancer Caco-2 cells. Prostaglandins Leukot Essent Fat Acids. 2005;73:113–119. doi: 10.1016/j.plefa.2005.04.013. [DOI] [PubMed] [Google Scholar]


