

Abstract
Supercritical carbon dioxide extraction (SC-CO2) of total anthocyanin and phenolic compounds from jamun fruits was investigated using three factors at three levels Box–Behnken response surface design. Experiments were conducted to evaluate the effects of three independent variables (pressure, temperature and co-solvent flow rate) on the maximum extraction yield of anthocyanin and phenolic compounds from jamun fruits. From the experimental data, second order polynomial mathematical models were developed with high coefficient of determination values (R2 > 0.98). From response surface plots, pressure, temperature and co-solvent flow rate exhibited independent and interactive effects on the extraction yields. Pressure of 162 bar, extraction temperature at 50 °C and co-solvent flow rate of 2.0 g/min was identified as optimal conditions. Under these optimal conditions, the experimental value agreed well with the predicted values and indicates the suitability of developed models.
Keywords: Supercritical fluid extraction, Phenolic compound, Box-Behnken design, Anthocyanin
Introduction
Indian blackberry (Syzygium cumini L.), commonly known as jamun is a minor and under-utilized tree-fruit of Indian subcontinent. The plant belongs to Myrtaceae family and grows naturally in clayey loamy soil in tropical as well as sub-tropical zones of Indo-gangetic plains. The purple coloured jamun fruits are available abundantly during summer season for a short span of time, causing a seasonal glut. The fruits are oblong berries, deep purple or bluish in colour with pinkish pulp, having various medicinal properties and used in Ayurveda as a stomachic, astringent, antiscorbutic, diuretic, antidiabetic, and in chronic diarrhea and enlargement of spleen (Achrekar et al. 1991) including its use as an antimicrobial agent (Migliato 2005). In addition, jamun fruit extract showed anti-proliferative and pro-apoptotic effects against breast cancer cells and showed high antioxidant activity induced by copper acetate in liposomes, (Hassimotto et al. 2005). These beneficial effects are most probably due to the presence of bioactive compounds, such as pigments and phenolic compounds. Anthocyanins often account for much of the phenolic content of these fruits, but flavanols, procyanidins, phenolic acids, and ellagitannins may be the most predominant phenolics in some taxa. Polyphenolic compounds inhibit several oxidative, inflammatory enzymes and have shown antiallergenic, antiviral, antibacterial, antifungal, antitumor, and antihemorrhagic activities (Pietta 2000). Therefore, it is interesting to look for an effective extraction method to extract the valuable bioactive compounds such as anthocyanin and phenolic compounds from jamun fruit.
Supercritical fluid extraction (SFE) with supercritical carbon dioxide (SC-CO2) has been used for the extraction of compounds from natural products and researchers have paid considerable attention towards various aspects of this process (Lu et al. 2007). These include the isolation phenol and tocopherols from olive leaves (De Lucas et al. 2002), tocopherols from grape seeds (Bravi et al. 2007), carotenoids, tocopherols, and sitosterols from industrial tomato by-products (Vagi et al. 2006), and valuable compounds from Citrus junos seed (Hiro et al. 2008). Products derived from this technology are completely free from harmful residues and without the risk of thermal degradation of processed products. However, to our best knowledge, no publications are available on the extraction of anthocyanins and phenolic compounds from jamun fruits using SC-CO2 extraction technique. Hence, the objective of this present study is to develop and optimize a SC-CO2 extraction process that was rapid, simple and easily applicable to the extraction of total anthocyanins and phenolic compounds from jamun fruits. The effects of pressure, temperature and co-solvent flow rate on extraction yield were investigated. Box–Behnken response surface design (BBD) was used to build models between the responses and the independent factors, and also used to optimize the extraction conditions. BBD is a spherical, revolving response surface methodology (RSM) design that consists of three interlocking 22 factorial design having points, all lying on the surface of a sphere surrounding the center of the design (Prakash Maran et al. 2013d) which uses quantitative data from an appropriate experimental design to determine or simultaneously solve multivariate equations.
Materials and methods
Plant materials
Fresh Jamun (Syzygium cumini) fruits were procured from local fruit orchards near Chennai, India. The pulp of the fruits were removed manually and washed under running tape water in order to remove the foreign matters adhered to the surface. Then the fruit pulp was dried in a hot air oven at 40 °C until the moisture content was constant (6 % w/w). The dried pulp were pulverized and sieved through a 40-mesh sieve to obtain the powdered form of pulp. The powdered pulp were stored in an airtight dark container to prevent moisture absorption and stored in dry environment prior to the experiments.
Chemicals and reagents
SFE-grade carbon dioxide (purity 99.9 %) supplied in a cylinder with a dip tube was purchased from Chang Chun Gas Inc. (Changchun, China). Cyanidin-3-glucoside and gallic acid (98 % purity) was purchased from Sigma–Aldrich Company, Mumbai. Ethanol and deionized water (HPLC grade) was supplied by southern India scientific corporation (Hong Yan G chemical corporation, China). Potassium chloride, sodium acetate, Folin-Ciocalteu reagent and sodium carbonate were purchased from Loba Chemical Company, Mumbai.
Supercritical carbon dioxide (SC-CO2) extraction
SC-CO2 extraction of anthocyanin and phenolic compounds from jamun fruits was performed on a supercritical fluid extractor (SFE) (ABRP200, Pittsburgh, PA, USA) with an extraction volume of 500 ml. Before the experiment was started, the SFE unit was calibrated using standard calibration method prescribed by the equipment supplier. For each experiment, 10 g of powdered fruit pulp sample was mixed with glass wool and loaded in the extractor vessel. After the loaded extractor vessel was assembled, the gas carbon dioxide from CO2 cylinder was pressurized and introduced in to the extraction vessel, which was filled with samples, with the adjustment of pump (P-50, Thar designs, Inc. Pittsburg, PA, USA). Then, it was pressurized to the desired pressure and heated to the specified temperature in order to reach the supercritical state. Ethanol (99.9 % purity) acted as the co-solvent to increase the polarity of solvent and improve the efficiency of SC-CO2 extraction of pigment and phenolic compounds from jamun fruit pulp. When the scheduled time was achieved, the extractor vessel was depressurized at ambient temperature and pressure and the extract was separated and collected in collector at ambient temperature and atmospheric pressure. Extracts obtained by SFE at different conditions were analyzed for total anthocyanin and phenolic content.
Estimation of total monomeric anthocyanin content
The total monomeric anthocyanin content (TMAC) was estimated by pH differential method that relies on the structural transformation of anthocyanin chromophore as a function of pH value (Prakash Maran et al. 2013a), which can be measured using a spectrophotometer (Shimadzu UV-1800, Kyoto, Japan). Aliquots (1 ml) of extracts were mixed with potassium chloride (pH 1.0, 0.025 M, 4 ml) and sodium acetate (pH 4.5, 0.4 M, 4 ml) and allowed to equilibrate for 1 h before taking absorbance at 530 and 700 nm, were recorded using a spectrophotometer calibrated with distilled water as the blank. The difference in absorbance was calculated using the following equation:
 |
1 |
The total monomeric anthocyanin content was calculated by the following equation:
 |
2 |
where, A is the absorbance, MW is the molecular weight of cyanidin-3-glucoside (449.2 g/mol), DF is the dilution factor, ε is the molar absorptivity of cyanidin-3-glucoside (26,900 L/cm.mol), and 1 is for a standard 1 cm path length. Total monomeric anthocyanins were reported as milligrams cyanidin-3-glucoside per 100 g of fruits (mg cyanidin-3-glucoside/100 g).
Analysis of total phenolic content
Total phenolic content (TPC) was measured by Folin-Ciocalteu method as described by Vatai et al. (2009) with minor modifications. 2.5 ml of Folin-Ciocalteu ragent (0.2 mol/l) was mixed with known amount of (0.2 ml) diluted sample and a total volume of 4 ml was made up with deionized water (used for dilution and control). After incubation for 5 min at room temperature, 2.0 ml of sodium carbonate (7.5 g/100 ml) was added, then immediately mixed and incubated at room temperature for 2 h. After the mixture was shaken, the absorbance was measured at 754 nm against a reagent blank (deionized water instead of the sample) with a UV-visible spectrophotometer (Elico, SL 244, India). Gallic acid was used as the standard and results were calculated on the basis of calibration curve of gallic acid and the results were expressed as gallic acid equivalents (mg GAE/100 g).
Identification of different anthocyanin and phenolic compounds by high performance liquid chromatography (HPLC) analysis
The chromatographic analyses were carried out using HPLC equipment (Shimadzu HPLC LC 2010HT, Mumbai), equipped with a pump and a UV detector. Separation was achieved using a Synergi Fusion—RP 80 A reversed phase column (4 μm, 250 × 4.6 mm, Phenomenex,Torrance, CA) at 33 ± 1 °C. Elution was carried out with a linear gradient and a flow rate of 1 ml/min. The analysis detection was monitored at 530 nm for anthocyanin and 280 nm for polyphenols. The prepared SFE extract was filtered through a 0.22 μm Millex polyethersulphone membrane (Millipore, USA). The filtered sample (10 μl) was injected into the column. An elution gradient consisting of water/acetonitrile/formic acid 87/3/10 (v:v:v) (solvent A) and water/acetonitrile/formic acid 40/50/10 (v:v:v) (solvent B) was used as follows: 0 min 6 % B, 10 min 20 % B, 20 min 40 % B, 25 min 90 % B and 30 min 6 % B. The substances (different anthocyanins and phenolics) were identified by matching their retention times, the UV–vis spectrum and the purity peak against those of standard compounds.
Experimental design
In this study, Box-Behnken response surface experimental design (BBD) with three factors and three levels was chosen to optimize and study the influence of process variables such as pressure (100–200 bar), temperature (40–60 °C) and co-solvent (ethanol) flow rate (1–3 g/min) on the maximum extraction yield of TMAC and TPC from jamun fruits. Because BBD has more efficient than the other experimental designs such as central composite design, three-level full factorial design and Doehlert matrix. Another advantage of the BBD is that it does not contain combinations for which all factors are simultaneously at their highest or lowest levels. So this design is useful in avoiding experiments performed under extreme conditions, for which unsatisfactory results might occur. On the basis single factor experimental analysis, process variables and their ranges were determined and the independent variables was coded at three levels (−1, 0 and +1) for statistical calculation by the method described by Prakash Maran et al. (2013b). After selection of process (independent) variables and their ranges, experiments were established based on a BBD and the complete design consists of 17 experiments with five replicates (used to estimate experimental error) at the centre point. The total number of experiments (N) was calculated from the following equation (Prakash Maran and Manikandan 2012).
 |
3 |
where, K is number of factors and C0 is the number of central point.
For predicting the optimal point after performing experiments, a second-order polynomial mathematical equation was fitted to the experimental data to express the relationship between independent variables and responses. For the three factors, the generalized form of second order polynomial equation is
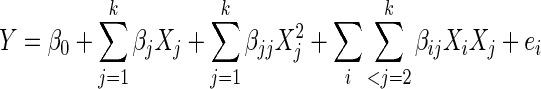 |
4 |
where, Y is the response; Xi and Xj are variables (i and j range from 1 to k); β0 is the model intercept coefficient; βj, βjj and βij are interaction coefficients of linear, quadratic and the second-order terms, respectively; k is the number of independent parameters (k = 3 in this study); and ei is the error (Maran et al. 2013; Prakash Maran et al. 2013g and h).
Statistical analysis
Experimental data was analyzed using the Stat ease Design Expert 8.0.7.1 statistical software (Stat-Ease Inc., Minneapolis, USA). The experimental data was analyzed by multiple regression analysis through the least square method. Pareto analysis of variance (ANOVA) was used to evaluate the observed data and the regression coefficients of linear, quadratic, and interaction terms and their effects were generated and analyzed. All the terms in the model were tested statistically by F-test and verified the significance of the F-values at probability levels (p ≤ 0.05). The values of determination coefficient (R2), adjusted determination coefficient (R2adj), coefficient of variance (CV %), adequate precision of models and predicted residual sum of squares (PRESS) were obtained to check the quality of the fit polynomial model.
Optimization
Multiple response analysis (Prakash Maran et al. 2013f) using Derringer’s desired function methodology was used to optimize the process conditions of the present study. This numerical Optimization technique will optimize any combination of one or more goals; these may be either process variables or responses. The general approach of desirability function is, first transform the response into a dimensionless individual desirability function (di), which varies from 0 to 1 (lowest to highest desirability). The following equation was used to maximize and transform the responses into dimensionless desirability (di) value.
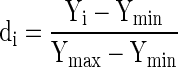 |
5 |
where, Yi is the obtained response value, Ymin is the obtained response minimum value and Ymax is the obtained response maximum value.
The overall desirability function (D) is obtained (Eq. 6) from the geometric means of individual desires. The Design expert 8.0.7.1 was used to maximize the D.
 |
6 |
where, di is the individual desirability value of the individual response, k is the number of considered responses, and ni is the weight of each response.
Validation of the optimized conditions
To determine the validity of the optimized conditions, additional triplicate experiments were performed under optimal conditions. The average value of the experiments was compared with the predicted values of the optimized conditions and find out the accuracy and suitability of the optimized conditions and mathematical models.
Results and discussion
Box-Behnken response surface design analysis
In this study, three factors at three levels Box-Behnken response surface design was used to determine the individual and interactive effects of major operating variables (pressure, temperature and co-solvent flow rate) on maximum extraction efficiency of TMAC and TPC from jamun fruits obtained by SC-CO2 extraction technique and the results were listed in Table 1. Four models viz., linear, interactive (2FI), quadratic and cubic models were fitted to the experimental data to check whether approximating model would give poor or misleading results. The adequacy of model summary indicates that, linear and interactive (2FI) models were exhibited lower R2, adjusted R2, predicted R2 and also high p-values, when compared with quadratic model. Cubic model was found to be aliased (Table 2). So, the quadratic model is found to be the most suitable model for the present extraction process. Adequacy of this model was further justified through analysis of variance (ANOVA).
Table 1.
Box-Behnken experimental design matrix with observed and predicted values of responses
| Run order | Pressure (bar) | Temperature (C) | Co-solvent flow rate (g/min) | TMAC (mg/100g) | TPC (mg GAE/100g) | ||
|---|---|---|---|---|---|---|---|
| Observed | Predicted | Observed | Predicted | ||||
| 1 | 150 | 60 | 3 | 228.61 | 228.67 | 1140.59 | 1140.51 |
| 2 | 150 | 50 | 2 | 230.91 | 230.91 | 1143.87 | 1143.87 |
| 3 | 100 | 60 | 2 | 226.44 | 226.42 | 1138.41 | 1138.15 |
| 4 | 150 | 50 | 2 | 230.91 | 230.91 | 1143.87 | 1143.87 |
| 5 | 100 | 50 | 3 | 228.11 | 228.07 | 1140.07 | 1140.41 |
| 6 | 200 | 60 | 2 | 228.64 | 228.68 | 1139.62 | 1140.15 |
| 7 | 200 | 40 | 2 | 228.17 | 228.19 | 1140.14 | 1140.40 |
| 8 | 100 | 50 | 1 | 225.27 | 225.38 | 1138.26 | 1138.71 |
| 9 | 150 | 60 | 1 | 225.57 | 225.48 | 1138.51 | 1138.32 |
| 10 | 150 | 50 | 2 | 230.91 | 230.91 | 1143.87 | 1143.87 |
| 11 | 150 | 40 | 1 | 224.74 | 224.68 | 1137.68 | 1137.76 |
| 12 | 150 | 40 | 3 | 228.04 | 228.13 | 1141.03 | 1141.22 |
| 13 | 100 | 40 | 2 | 225.61 | 225.57 | 1138.57 | 1138.04 |
| 14 | 150 | 50 | 2 | 230.91 | 230.91 | 1143.87 | 1143.87 |
| 15 | 200 | 50 | 1 | 227.15 | 227.19 | 1140.09 | 1139.75 |
| 16 | 150 | 50 | 2 | 230.91 | 230.91 | 1143.87 | 1143.87 |
| 17 | 200 | 50 | 3 | 231.24 | 231.14 | 1144.16 | 1143.71 |
Table 2.
Adequacy of the models tested for the responses
| Source | Std.Dev. | R2 | Adjusted R2 | Predicted R2 | PRESS | Prob > F | Remarks |
|---|---|---|---|---|---|---|---|
| TMAC | |||||||
| Linear | 1.95 | 0.413 | 0.278 | 0.144 | 72.17 | 0.0663 | |
| 2FI | 2.21 | 0.419 | 0.070 | −0.442 | 121.55 | 0.9926 | |
| Quadratic | 0.09 | 0.999 | 0.997 | 0.990 | 0.84 | < 0.0001 | Suggested |
| Cubic | 0.00 | 1.000 | 1.000 | – | + | 0.0283 | Aliased |
| TPC | |||||||
| Linear | 2.28 | 0.274 | 0.106 | −0.084 | 100.82 | 0.2299 | |
| 2FI | 2.57 | 0.292 | −0.133 | −0.823 | 169.58 | 0.9657 | |
| Quadratic | 0.45 | 0.985 | 0.966 | 0.859 | 22.41 | < 0.0001 | Suggested |
| Cubic | 0.00 | 1.000 | 1.000 | – | + | 0.0346 | Aliased |
Development of second order polynomial mathematical models
An empirical relationship between independent variables and responses were expressed by a second-order polynomial equation with interaction terms was fitted between the experimental results obtained on the basis of Box–Behnken experimental design. The final mathematical equation obtained in terms of coded factors is given below
 |
7 |
 |
8 |
Statistical analysis
The adequacy and fitness of the models were tested by multiple regression analysis through least square method. Pareto analysis of variance (ANOVA) was used to check the significance of the developed models and ANOVA tables were generated, which was shown in Table 3. ANOVA is a statistical technique that subdivides the total variation in a set of data into component parts associated with specific sources of variation for the purpose of testing hypotheses on the parameters of the model (Prakash Maran et al. 2013c). As shown in Table 2, ANOVA of regression model demonstrates that the models are highly significant, as it is evident from the high Fisher’s F-test value (1246.31 for TMAC and 50.86 for TPC) with a very low probability value (p < 0.0001). R2 is defined as the ratio of the explained variation to the total variation and is a measurement of the degree of fitness of the models (Prakash Maran et al. 2013d). The values of R2 were 0.999 for TMAC and 0.984 for TPC, which ensures a satisfactory fit of the quadratic models to the experimental data. The value of R2adj (0.997 for TMAC and 0.966 for TPC) is also high and advocates a high correlation between the observed and predicted values. In this study, the R2pre of 0.990 for TMAC and 0.859 for TPC is in reasonable agreement with the R2adj. The low value of residual error (0.053 for TMAC and 1.4 for TPC) shows that, the form of the chosen model to explain the relationship between the factors and response is correct (Prakash Maran et al. 2013e). The very low values of CV % (0.038 for TMAC and 0.039 for TPC) clearly indicated a very high degree of precision and a good reliability of the experimental values (Priya et al. 2013). Adequate precision measures the signal to noise ratio and this ratio is greater than 4, which is desirable and indicates adequate model discrimination (Prakash Maran et al. 2014a, b, c). In this work, the ratio is found to be >17 for the responses, which indicates an adequate signal.
Table 3.
Analysis of variance (anova) for the responses
| Source | TMAC | TPC | ||||||
|---|---|---|---|---|---|---|---|---|
| RC | SE | F- value | p-value | RC | SE | F- value | p-value | |
| Model | 230.91 | 0.04 | 1246.31 | < 0.0001 | 1143.87 | 0.20 | 50.86 | < 0.0001 |
| X1 | 1.22 | 0.03 | 1588.61 | < 0.0001 | 1.09 | 0.16 | 47.28 | 0.0002 |
| X2 | 0.34 | 0.03 | 121.33 | < 0.0001 | −0.04 | 0.16 | 0.05 | 0.8253 |
| X3 | 1.66 | 0.03 | 2930.69 | < 0.0001 | 1.41 | 0.16 | 79.90 | < 0.0001 |
| X12 | −0.09 | 0.04 | 4.31 | 0.0764 | −0.09 | 0.22 | 0.16 | 0.6994 |
| X13 | 0.31 | 0.04 | 52.01 | 0.0002 | 0.57 | 0.22 | 6.38 | 0.0395 |
| X23 | −0.06 | 0.04 | 2.25 | 0.1773 | −0.32 | 0.22 | 2.01 | 0.1987 |
| X1 2 | −1.25 | 0.04 | 870.69 | < 0.0001 | −1.75 | 0.22 | 64.16 | < 0.0001 |
| X2 2 | −2.45 | 0.04 | 3361.58 | < 0.0001 | −2.94 | 0.22 | 181.70 | < 0.0001 |
| X3 2 | −1.72 | 0.04 | 1660.90 | < 0.0001 | −1.48 | 0.22 | 46.01 | 0.0003 |
| Std. Dev. | 0.09 | 0.45 | ||||||
| Mean | 228.36 | 1140.97 | ||||||
| C.V. % | 0.038 | 0.039 | ||||||
| PRESS | 0.84 | 22.41 | ||||||
| Adeq. Precision | 97.13 | 17.815 | ||||||
RC Regression coefficient, SE Standard error
Effect of process variables
From the developed mathematical model equations (Eqs. 7–8), three dimensional (3D) response surface plots were constructed in this study and it is shown in Fig. 1. Since the regression model has three independent variables, one variable was held at constant at the central level for each plot and the other factors were varied in their range (Prakash Maran et al. 2014a) in order to visualize the relationship between independent variables and the responses (Prakash Maran et al. 2014b).
Fig. 1.

Response surface plots showing effects of process variables (temperature, pressure and co-solvent flow rate) on the responses (TMAC (a, c and e) and TPC (b, d and f)
Effect of pressure
Pressure is one of the dominant factors in extraction of pigment and phenolic compounds from jamun fruits by SC-CO2 extraction process. Figure 1a, b, c and d illustrates the effect of operating pressure on the extraction yield of TMA and TPC. As the pressure increases, two distinguished trends were observed. In the range of 100–162 bar, the extraction yield of TMAC and TPC increases with a mild slope. Further increase in pressure up to 200 bar causes slight decrease in the yield. Increase in pressure could increase the fluid density, decreasing the distance between the molecules by the rupturing effect of pressure and thereby strengthening interactions between the fluid and matrix (Lang and Wai 2001). During rupturing process, the chemical substances within the plant materials are rapidly released into the surrounding extraction solvents, which enhanced the solubility of the solute, mass transfer rate and diffusion of solvent into the plant material and improve the extraction yield (Prasad et al. 2010; Sonsuzer et al. 2004). The decrease in extraction yield with increasing pressure after a certain pressure (162 bar) might be due to the volatility and polarity of extracted analytes and interaction between the other parameters.
Effect of temperature
Temperature is the main parameter influencing the physicochemical properties of ethanol and the compounds to be extracted, and it has a great influence on the extraction rate, efficiency, and selectivity in SC-CO2. From the results, it was observed that, the extraction yield of TMAC and TPC was increased when extraction temperature was increased from 40 to 50 °C, but slowly decreases, when the temperature continued to be extended (Fig. 1a, b, e and f). Enhancement of the extraction efficiency can be related to the increased vapor pressures and accelerated thermal desorption of the compounds from the sample matrix (Sheibani and Ghaziaskar 2009). Instead of that, the increasing temperature contributed to damage the particle cell walls, increased the mass transfer rate and as the result, availability of bioactive compounds for extraction was increased (Machmudah et al. 2006). But further increase in temperature resulted in a decrease in the recovery of bioactive contents, due to vaporization or decomposition of volatile components during extraction at higher temperature (Cacace and Mazza 2003) and also due to reduction in the density of CO2.
Effect of co-solvent
The nature of the solute to be extracted is the critical basis for co-solvent choice (Walsh et al. 1987). The co-solvent improves polarity of the extraction fluid and hence increases the extraction yield. As a result, an increasing co-solvent amount resulted in a higher extraction yield, while the extraction yield reached a maximum when co-solvent amount was up to a certain value (2 g/min), with no further significant improvement (Fig. 1c, d, e and f). This could be explained by the fact that the polar constituents in the plant would be easier to extract with more polar solvent. The addition of ethanol to the supercritical solvent seems to provide an enhanced extraction of the pigment and phenolic compounds, as a consequence of the polarity increase in the solvent mixture. As polar co-solvents induced the changes in the structure of the cellular matrix via intra-crystalline, osmotic swelling and break analyte-matrix bindings by competing with polar interactions between matrixes which in turn enhances the solubility of the compounds to be extracted (Bjorklund et al. 1998). These results confirm the affirmation made by Murga et al. (2000), which stated that, due to the fact that ethanol is a solvent capable of hydrogen-bonding and dipole-dipole interactions with phenols, it would likely act as a good co-solvent for the carbon dioxide extraction of phenolic components. Wang et al. (2008) also found a similar result about the effect of co-solvent flow rate on the flavonoid yield from Pueraria lobata.
Determination and validation of optimum conditions
Simultaneous optimizations of the multiple responses were carried out using Derringer’s desirability function method. Applying the methodology of desired function, the optimum level of various parameters were obtained as an extraction pressure of 162 bar, extraction temperature at 50 °C and co-solvent flow rate of 2.0 g/min. Under these optimium conditions, the predicted extraction yield was TMAC of 231.13 mg/100g and TPC of 1144.032 mg GAE/100 g with a desirability value of 0.927. The experimental efficiency of the extraction of TMAC and TPC under the optimum conditions (mean value of triplicate experiments) was found to be 231.28 ± 0.76 mg/100 g of TMAC and 1143.051 ± 1.58 mg GAE/100 g of TPC respectively. The results obtained through confirmation experiments indicate the suitability of the developed quadratic models and indicate the reliability of BBD coupled desired function methodology.
HPLC analysis and identification of different anthocyanins and phenolic compounds
HPLC analysis was conducted to identify the different anthocyanins and phenolic compounds present in the extract. Retention time of obtained peaks was compared with that of known standards under the same conditions. Figure 2 shows the HPLC chromatogram of the extract from jamun fruit under the optimal SFE conditions. In total, seven different anthocyanins namely malvidin 3-o-rutinoside-5-o-glucoside, petunidin 3-o-caffeoyl-rutinoside-5-o-glucoside, delphinidin 3-o-p-coumaroyl-rutinoside-5-o-glucoside, petunidin 3-o-p-coumaroyl-rutinoside-5-o-glucoside, petunidin 3-o-feruloyl-rutinoside-5-oglucoside, malvidin 3-o-p-coumaroyl-rutinoside-5-o-glucoside, malvidin 3-o-feruloyl-rutinoside-5-o-glucoside were identified on the basis of peak area and its retention time (Fig. 2a). From Fig. 2b, eight different bioactive phenolics including quinic acid, gallic acid, dihydroxybenzoic acid, caffeic acid, p-coumeric acid, sinapic acid, quercetin and kaempferol were detected with good separation.
Fig. 2.

HPLC chromatogram of SC-CO2 extract at optimized condition (pressure of 162 bar, temperature of 50 °C and co-solvent flow rate of 2 g/min) showing different anthocyanins (a) and phenolic compounds (b)
Conclusions
In this study, three factors at three levels BBD was successfully employed to optimize and study the individual and interactive effect of process variables such as pressure, temperature and co-solvent flow rate on the extraction yield of TMAC and TPC from jamun fruits. From the experimental results, second order polynomial mathematical models were developed for the responses with high coefficient of determination (R2) values (more than 0.98). The optimal conditions to obtain the maximum extraction yield of TMAC and TPC were determined as follows: extraction pressure of 162 bar, extraction temperature of 50 °C and co-solvent flow rate of 2.0 g/min respectively. Under these conditions, the experimental value (231.28 ± 0.76 mg/100 g for TMAC and 1143.051 ± 1.58 mg GAE/100 g for TPC) was agreed well with the predicted values.
Contributor Information
J. Prakash Maran, Email: prakashmaran@gmail.com.
B. Priya, Email: priya.balasubramani@gmail.com
S. Manikandan, Email: manift@gmail.com
References
- Achrekar S, Kakliji GS, Pote MS, Kelkar SM. Hypoglycemic activity of Eugenia jambolana and Ficus bengalensis: mechanism of action. In Vivo. 1991;5(2):143–147. [PubMed] [Google Scholar]
- Bjorklund E, Jaremo M, Mathiasson L, Jonsson JA, Karlsson L. Illustration of important mechanisms controlling mass transfer in supercritical fluid extraction. Anal Chim Acta. 1998;368:117–128. doi: 10.1016/S0003-2670(98)00060-9. [DOI] [Google Scholar]
- Bravi M, Spinoglio F, Verdone N, Adami M, Aliboni A, D’Andrea A. Improving the extraction of α-tocopherol-enriched oil from grape seeds by supercritical CO2. Optimisation of the extraction conditions. J Food Eng. 2007;78:488–493. doi: 10.1016/j.jfoodeng.2005.10.017. [DOI] [Google Scholar]
- Cacace JE, Mazza G. Mass transfer process during extraction of phenolic compounds from milled berries. J Food Eng. 2003;59:379–389. doi: 10.1016/S0260-8774(02)00497-1. [DOI] [Google Scholar]
- De Lucas A, Ossa EM, Rincon J, Blanco MA, Gracia I. Supercritical fluid extraction of tocopherol concentrates from olive tree leaves. J Supercrit Fluids. 2002;22(3):221–228. doi: 10.1016/S0896-8446(01)00132-2. [DOI] [Google Scholar]
- Hassimotto NMA, Genovese MI, Lajolo FM. Antioxidant activity of dietary fruits, vegetables, and commercial frozen fruit pulps. J Agric Food Chem. 2005;53:2928–2935. doi: 10.1021/jf047894h. [DOI] [PubMed] [Google Scholar]
- Hiro U, Masahiro T, Siti M, Mitsuru S, Motonobu G. Supercritical carbon dioxide extraction of valuable compounds from Citrus junos seed. Food Bioprocess Technol. 2008;1(4):357–363. doi: 10.1007/s11947-007-0015-0. [DOI] [Google Scholar]
- Lang Q, Wai CM. Supercritical fluid extraction in herbal and natural product studies—a practical review. Talanta. 2001;53:771–782. doi: 10.1016/S0039-9140(00)00557-9. [DOI] [PubMed] [Google Scholar]
- Lu TJ, Gaspar F, Marriott R, Mellor S, Watkinson C, Al-Duri B. Extraction of borage seed oil by compressed CO2: effect of extraction parameters and modeling. J Supercrit Fluids. 2007;41:68–73. doi: 10.1016/j.supflu.2006.10.002. [DOI] [Google Scholar]
- Machmudah S, Shotipruk A, Goto M, Sasaki M, Hirose T. Extraction of astaxanthin from Haematococcus pluvialis using supercritical CO2 and ethanol as entrainer. Ind Eng Chem Res. 2006;45:3652–3657. doi: 10.1021/ie051357k. [DOI] [Google Scholar]
- Maran JP, Sivakumar V, Sridhar R, Thirgananasambandham K. Development of model for barrier and optical properties of tapioca starch based films. Carbohydr Polym. 2013;92:1335–1347. doi: 10.1016/j.carbpol.2012.09.069. [DOI] [PubMed] [Google Scholar]
- Migliato KF. Standardization of the extract of. Syzygium cumini (L.) skeels fruits. through the antimicrobial activity. Cad Farm. 2005;21(1):55–56. [Google Scholar]
- Murga R, Ruiz R, Beltran S, Cabezas JL. Extraction of natural complex phenols and tannins from grape seeds by using supercritical mixtures of carbon dioxide and alcohol. J Agric Food Chem. 2000;48(8):3408–3412. doi: 10.1021/jf9912506. [DOI] [PubMed] [Google Scholar]
- Pietta P-G. Flavonoids as antioxidants. J Nat Prod. 2000;63:1035–1042. doi: 10.1021/np9904509. [DOI] [PubMed] [Google Scholar]
- Prakash Maran J, Manikandan S. Response surface modeling and optimization of process parameters for aqueous extraction of pigments from prickly pear (opuntia ficus-indica) fruit. Dyes Pigments. 2012;95:465–472. doi: 10.1016/j.dyepig.2012.06.007. [DOI] [Google Scholar]
- Prakash Maran J, Manikandan S, Mekala V. Modeling and optimization of betalin extraction from opuntia ficus-indica using Box-Behnken design with desirability function. Ind Crop Prod. 2013;49:304–311. doi: 10.1016/j.indcrop.2013.05.012. [DOI] [Google Scholar]
- Prakash Maran J, Manikandan S, Priya B, Gurumoorthi P. Box-Behnken design based multi-response analysis and optimization of supercritical carbon dioxide extraction of bioactive flavonoid compounds from tea (Camellia sinensis L.) leaves. J Food Sci Technol. 2013 [Google Scholar]
- Prakash Maran J, Manikandan S, Vigna Nivetha C, Dinesh R. Ultrasound assisted extraction of bioactive compounds from Nephelium lappaceum L. fruit peel using central composite face centered response surface design. Arab J Chem. 2013 [Google Scholar]
- Prakash Maran J, Sivakumar V, Sridhar R, Prince Immanuel V. Development of model for mechanical properties of tapioca starch based films. Ind Crop Prod. 2013;42:159–168. doi: 10.1016/j.indcrop.2012.05.011. [DOI] [Google Scholar]
- Prakash Maran J, Sivakumar V, Thirgananasambandham K, Kandasamy S. Modeling and and analysis of film composition on mechanical properties of maize starch based edible films. Int J Biol Macromol. 2013;62:565–573. doi: 10.1016/j.ijbiomac.2013.09.027. [DOI] [PubMed] [Google Scholar]
- Prakash Maran J, Sivakumar V, Thirgananasambandham K, Sridhar R. Response surface modeling and analysis of barrier and optical properties of maize starch edible films. Int J Biol Macromol. 2013;60:412–421. doi: 10.1016/j.ijbiomac.2013.06.029. [DOI] [PubMed] [Google Scholar]
- Prakash Maran J, Sivakaumar V, Thirgananasambandham K, Sridhar R. Optimization of microwave assisted extraction of pectin from orange peel. Carbohydr Polym. 2013;97:703–709. doi: 10.1016/j.carbpol.2013.05.052. [DOI] [PubMed] [Google Scholar]
- Prakash Maran J, Sivakaumar V, Thirgananasambandham K, Sridhar R. Artificial neural network and response surface methodology modeling in mass transfer parameters predictions during osmotic dehydration of Carica papaya L. Alex Eng J. 2013;52:507–516. doi: 10.1016/j.aej.2013.06.007. [DOI] [Google Scholar]
- Prakash Maran J, Sivakumar V, Thirgananasambandham K, Sridhar R. Model development and process optimization for solvent extraction of polyphenols from red grapes using Box-Behnken design. Prep Biochem Biotechnol. 2014;44:56–67. doi: 10.1080/10826068.2013.791629. [DOI] [PubMed] [Google Scholar]
- Prakash Maran J, Sivakumar V, Thirgananasambandham K, Sridhar R. Degradation behavior of biocomposited based on cassava starch buried under indoor soil conditions. Carbohydr Polym. 2014;101:20–28. doi: 10.1016/j.carbpol.2013.08.080. [DOI] [PubMed] [Google Scholar]
- Prakash Maran J, Sivakumar V, Thirgananasambandham K, Sridhar R. Microwave assisted extraction of pectin from waste Citrullus lanatus fruit rinds. Carbohydr Polym. 2014;101:786–791. doi: 10.1016/j.carbpol.2013.09.062. [DOI] [PubMed] [Google Scholar]
- Prasad KN, Yang B, Shi J, Yu C, Zhao M, Xue S. Enhanced antioxidant and antityrosinase activities of longan fruit pericarp by ultrahigh pressure assisted extraction. J Pharm Biomed. 2010;51(2):471–477. doi: 10.1016/j.jpba.2009.02.033. [DOI] [PubMed] [Google Scholar]
- Priya B, Viswanathan R, Vairamani M. Response surface optimisation of process variables for microencapsulation of garlic (Allium sativum L.) oleoresin by spray drying. Biosyst Eng. 2013;114:205–213. doi: 10.1016/j.biosystemseng.2012.12.008. [DOI] [Google Scholar]
- Sheibani A, Ghaziaskar HS. Pressurized fluid extraction for quantitative recovery of aflatoxins B1 and B2 from pistachio. Food Control. 2009;20:124–128. doi: 10.1016/j.foodcont.2008.03.001. [DOI] [Google Scholar]
- Sonsuzer S, Sahin S, Yilmar L. Optimization of supercritical CO2 extraction of Thymbra spicata oil. J Supercrit Fluids. 2004;30:189–199. doi: 10.1016/j.supflu.2003.07.006. [DOI] [Google Scholar]
- Vagi E, Simandi B, Vasarhelyine KP, Daood H, Kery A, Doleschall F. Supercritical carbon dioxide extraction of carotenoids, tocopherols and sitosterols from industrial tomato by-products. J Supercrit Fluids. 2006;40(2):218–226. doi: 10.1016/j.supflu.2006.05.009. [DOI] [Google Scholar]
- Vatai T, Kerget MS, Knez Z. Extraction of phenolic compounds from elder berry and different grape marc varieties using organic solvents and/or supercritical carbon dioxide. J Food Eng. 2009;90:246–254. doi: 10.1016/j.jfoodeng.2008.06.028. [DOI] [Google Scholar]
- Walsh JM, Ikonomou GD, Donohue MD. Supercritical phase behavior: the entrainer effect. Fluid Phase Equilib. 1987;33:295–314. doi: 10.1016/0378-3812(87)85042-2. [DOI] [Google Scholar]
- Wang L, Yang B, Du X, Yi C. Optimisation of supercritical fluid extraction of flavonoids from Pueraria lobata. Food Chem. 2008;108:737–741. doi: 10.1016/j.foodchem.2007.11.031. [DOI] [PubMed] [Google Scholar]