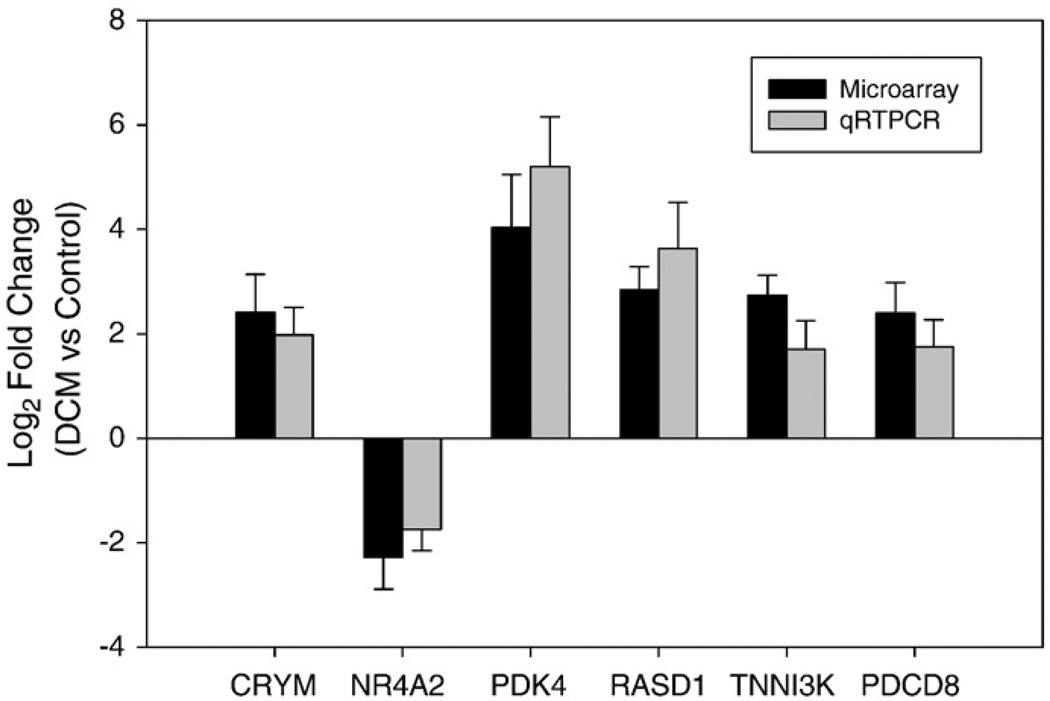
Fig. 4.
Confirmation of the microarray gene expression for six randomly selected differentially expressed genes by qRT-PCR. Ratio of expression for each gene in DCM group to normal control (fold change) was log2 transformed for microarray data and real-time RT-PCR. Dark bars represent microarray hybridizations, and, and grey bars represent values from qRT-PCR. The error bar represents standard deviation (SD) over three experiments.

