Abstract
Study Objective:
To evaluate the ability of the Sonomat to diagnose obstructive sleep apnea (OSA).
Design:
Prospective and randomized.
Setting:
Sleep laboratory and home.
Participants:
62 subjects; 54 with a clinical history of OSA and 8 normal control subjects.
Interventions:
N/A.
Measurements and Results:
Simultaneous PSG and Sonomat recordings were made in 62 subjects; 2 were excluded due to a poor nasal flow recording in PSG. There were positive correlations between the two devices for measures of sleep time, respiratory events, and the AHI (all correlations > 0.89). Bland-Altman analysis of the AHI showed positive agreement between devices, particularly at levels around common diagnostic thresholds. The mean difference in AHI values was 1.4 events per hour, and at a diagnostic threshold of 15 events per hour, sensitivity and specificity were 88% and 91%. More than 93% of PSG defined respiratory events were identified by the Sonomat and the absence of respiratory events was correctly identified in 91% of occasions. Gender, obesity, and body position did not influence the accuracy of the Sonomat. PSG snore sensors differed in how much snoring was detected when compared to the Sonomat.
Conclusion:
These data indicate that the Sonomat was reliable and accurate for the diagnosis of OSA. The provision of audible breath sound/snoring replay permits more accurate quantification of snoring. It requires no patient attachment and can be performed in the home with minimal training.
Citation:
Norman MB, Middleton S, Erskine O, Middleton PG, Wheatley JR, Sullivan CE. Validation of the Sonomat: a contactless monitoring system used for the diagnosis of sleep disordered breathing. SLEEP 2014;37(9):1477-1487.
Keywords: obstructive sleep apnea, contactless monitoring, portable monitoring, snoring
INTRODUCTION
Polysomnography (PSG) is the standard test for the diagnosis of sleep disordered breathing (SDB), as it provides measures of neurophysiologic sleep and breathing. Supervised PSG is a time-consuming, expensive, labor-intensive test that can be associated with long waiting lists.1 Many compact portable recording systems provide either a full or reduced array of PSG signals and can be used in the home. The “cut down” versions of PSG provide recordings of breathing without any measure of sleep and potentially underestimate the apnea-hypopnea index (AHI). Although some clinicians have opposed the use of such devices, claiming that neurophysiologic sleep must be recorded, several studies have shown that limited channel devices can be used to rule in and rule out SDB.2–4 Most portable recording systems still require the attachment of various sensors and most require a trained technician to set up the recording system. Some devices are intended for self set-up, but often this is limited by the understanding and capacity of the individual.
The two key signals that are required to detect and classify respiratory events are a measure of airflow and a simultaneous measure of breathing effort/movement. Although oxyhemoglobin desaturation events are used in the process of identifying hypopneas,5 and oximetry is an important measurement in its own right, pathological respiratory events can occur in the absence of significant oxyhemoglobin desaturation. Airflow during PSG is measured using nasal cannula attached to a pressure transducer and/or a thermistor that detects changes in temperature; both require attachment to the face and, in the case of the nasal cannula, insertion into the nostrils. Of all PSG sensors, these are the most uncomfortable and the most susceptible to dislodgement during the night.6–8 The simultaneous use of both of these airflow sensors is recommended in order for each to compensate for the inadequacies of the other.9 The measurement of breathing motion is typically made using sensors contained within belts worn around the thorax and abdomen.
There have been a range of technological approaches that provide less intrusive measures of breathing during sleep but the majority of them are experimental.10–18 Two systems that have been used clinically are the static charge sensitive bed (SCSB) and the SD-101. The SCSB is a capacitor-based system that detects the static charges contained within bedding material and bedclothes from which body movements, breathing movements, and heart movements (ballistocardiogram) are discernible.19,20 This system, coupled with an oximeter, has been used as a clinical tool in Scandinavia. The SD-101 is used within the Japanese health system and consists of more than 150 pressure sensors contained within a thin sheet that is placed onto a mattress.11,12 These devices measure breathing motion and can identify central apneas but do not reliably detect obstructive events because they do not have a measure of airflow.
The Sonomat is a new mat-based recording system that enables the diagnosis of SDB without the requirement of attaching sensors to the subject. The Sonomat contains a series of vibration/sound sensors that can identify body movements, breathing movements, and both breathing and heart sounds. The system records the two essential variables needed to detect and classify respiratory events—breathing movement and airflow in the form of breath sounds. Pathological sounds such as snoring and other adventitious sounds are also captured by the sensors.
Aim
The purpose of this study was to test the capacity of the Sonomat to diagnose SDB and to evaluate its performance against PSG. In addition to comparing AHI values, an additional aim was to compare all individual respiratory events that were detected.
METHODS
Participants
Consecutive patients ≥ 18 years of age who were to undergo PSG for suspected OSA at the David Read Laboratory, University of Sydney (n = 11), the North Gosford Private Hospital Sleep Unit (NGPH) (n = 23) or the Westmead Sleep Investigation and Research Centre (WSIRC) (n = 20) were recruited. Patients were initially referred due to a history of excessive daytime sleepiness, loud snoring, and/or witnessed apnea. Patients with insomnia, non-respiratory sleep disorders, neurological conditions, and those receiving ventilation or supplemental oxygen were excluded. In order to capture the entire spectrum of disease, 8 healthy volunteers without a clinical history of OSA were also recruited. Basic demographic information was recorded at enrollment. If a home recording was to be performed, participants possessed the ability to set up the recording equipment unaided. The protocols were approved by the Sydney University Human Research Ethics Committee (10-2007/10238) and the Westmead Hospital Human Research and Ethics Committee (HREC 2011/6/4.6 (3329) AU RED HREC/11/WMEAD/112). Participants were required to provide informed consent.
Protocol
Participants had simultaneous PSG and Sonomat recordings performed over a single night either in a sleep laboratory (n = 43) or in their own homes (n = 19). The home studies were unattended; although the laboratory-based study was supervised, no intervention in regard to the Sonomat was performed.
Polysomnography
A Type 1 Compumedics PSG system (Compumedics, Abbots-ford, Australia) was used in the sleep laboratory and either a Type 2 Embletta X100 (Embla, Denver, Colorado, USA) or a Type 2 Somté PSG (Compumedics, Abbotsford, Australia) was used in the home setting. The laboratory PSG studies recorded the following signals: electroencephalogram (EEG), electrooculogram (EOG), submental electromyogram (EMG), electrocardiogram (ECG), thoracoabdominal excursion (piezo sensors at NGPH and respiratory inductance plethysmography [RIP] at WSIRC), nasal flow (pressure transducer), oro-nasal flow (thermistor), snoring sounds (tracheal microphone at NGPH, calibrated room sound microphone [Rion NL-20, NL-31; Rion Co. Ltd. Tokyo, Japan] at WSIRC), pulse oximetry (SpO2), leg movements, and body position. The home-based PSG studies recorded all of the above except submental EMG, thermistor, and leg movements. Both home recording devices used RIP to record thoracoabdominal excursion, and both used the nasal cannula method of snore detection.
All PSG studies were scored according to the American Academy of Sleep Medicine (AASM) guidelines for scoring sleep, arousals, and respiratory events with the alternate (Type B) hypopnea criteria used.5 The AHI from the PSG studies (AHIPSG) was calculated using a method that has been shown to remove the systematic error introduced by sleep scoring software packages,21 a method that has been recently recommended by the AASM.22 Snoring was visually scored on the snore channel when a signal emerged from baseline that exceeded default thresholds (15 μbar or 10% using the nasal cannula method [Embletta and Somté], respectively: 10% using the tracheal microphone and a change of 3 standard deviations using the calibrated room sound microphone). Although the recordings utilizing the calibrated room sound microphone did contain an audiovisual recording that did permit audio playback, this was not used to identify snoring in this study. There was no minimum duration of a snoring event.
The Sonomat
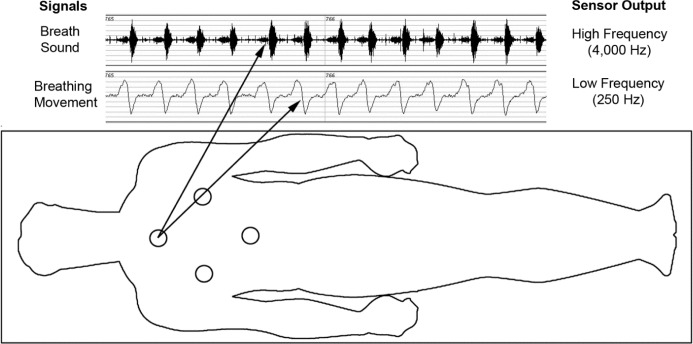
The Sonomat system was developed by Sonomedical Pty Ltd (Balmain, NSW Australia). The mattress is made from a thin piece of foam (Dunlop Foams, Dandenong, Victoria, Australia), with dimensions that fit a standard single sized bed, and is enclosed with StaphChek (Herculite, Emigsville, PA, USA), a protective thermoplastic fabric commonly used in healthcare. The mattress can be folded for ease of transport. Four identical sensors, situated at the approximate location of the thorax and abdomen (Figure 1), are embedded into the foam; these contain a polyvinylidene fluoride film that generates a voltage when deformed. Each sensor is filtered and amplified at different stages, with appropriate anti-aliasing techniques, to produce one movement signal sampled at 250 Hz and one acoustic (breath sound) signal sampled at 4,000 Hz.
Figure 1.
Location of the four Sonomat sensors within the mattress overlay and sample output from one sensor. The breath sound signal shows 13 consecutive breaths (biphasic signal with expiration louder than inspiration), and the breathing movement signal shows the associated breathing movements (inspiration is up). Each sensor records exactly the same data, allowing the subject to move around the bed unrestricted while maintaining good quality recordings.
The Sonomat is placed directly onto the mattress (Figure 2), then covered with a sheet and bedclothes arranged as normal, and the subject lies on the Sonomat but is in no way attached to the equipment. Data are stored on a Secure Digital card (SanDisk, Milpitas, CA) within the Sonomat in a proprietary file format. All files are manually transferred to a computer for analysis.
Figure 2.
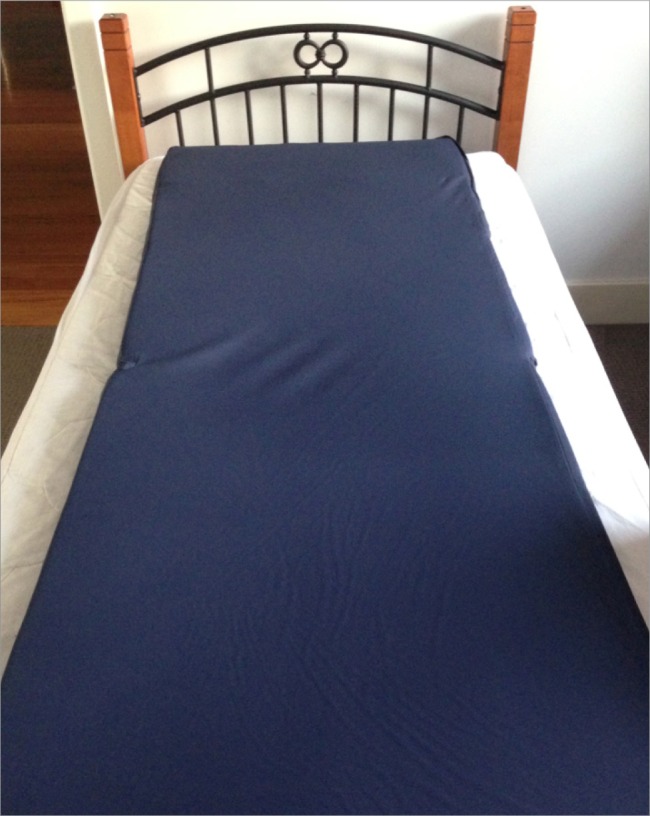
Photograph of the Sonomat positioned on a bed. During the night, a bedsheet completely covers the Sonomat, and this sheet is tucked under the existing mattress with all other bedclothes arranged as normal.
Sonomat Scoring Criteria
Sonomat events are visually scored in the same manner as PSG scoring but the Sonomat breath sound recordings can also be replayed through audio speakers, enabling auditory verification of events. Sonomat scoring criteria were developed to be similar to PSG scoring guidelines5; however, the Sonomat uses the breath sound signal as a measure of airflow. To ensure scoring consistency, the minimum duration of a respiratory event scored on the Sonomat was 10 seconds. The following events were scored within Sonomat recordings: snoring, apneas, hypopneas, and body movements.
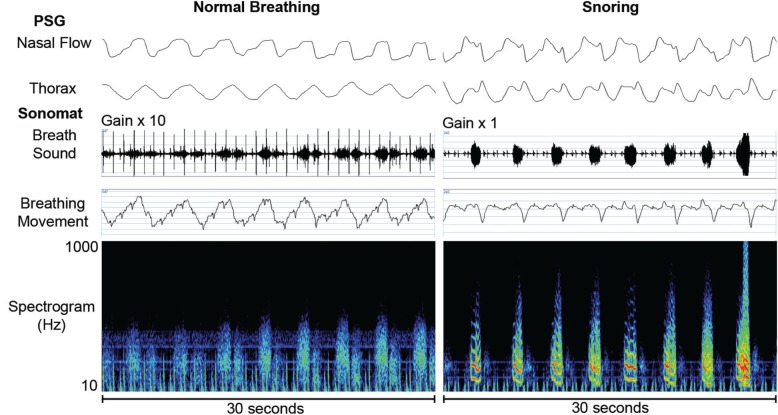
Breath sounds that contained periodic components with fundamental frequency peaks from 20-30 Hz up to approximately 250-300 Hz were scored as snores within Sonomat recordings; these could be confirmed aurally (Figure 3). There was no minimum duration of a snoring event.
Figure 3.
Representative examples of normal breathing and snoring with sound spectrograms. Normal breath sounds are amplified by 10, as these are very quiet sounds but no amplification is required when snoring is present. Normal breaths have no predominant frequencies but distinct bands of color can be seen when snoring (red and yellow colors) indicating the frequencies at which the upper airway is vibrating.
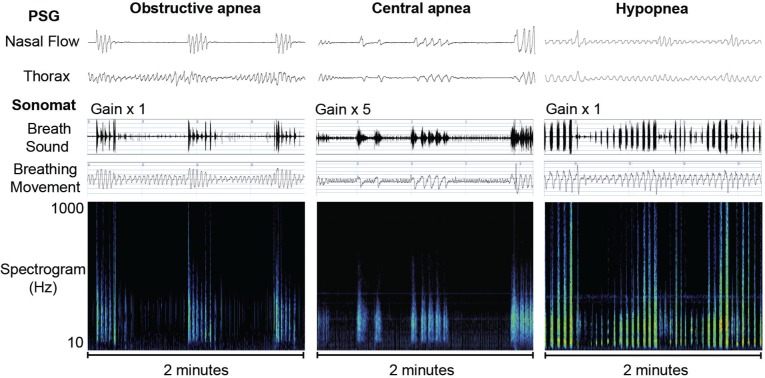
Apneas were identified on the breath sound trace as an absence of breath sounds (Figure 4). An obstructive apnea was scored when this absence was associated with continued breathing movements and a central apnea was scored when the absence was associated with no breathing movements. A mixed apnea was scored when the absence of breath sounds was associated with a combination of no breathing movements and a resumption of breathing movements, both occurring during the single apneic episode. Hypopneas were identified on the breathing movement trace as changes in amplitude that differed from baseline breathing movements by ≥ 30% (Figure 4). This degree of change is often used when describing a “discernible” difference and was chosen following work characterizing how PSG defined hypopneas appear within Sonomat recordings. Decreases in the amplitude of the breathing movement signal, a steady increase in a crescendo type pattern, or a combination of these two patterns were scored as hypopneas. The breath sound signal during hypopneas may consist of quieter normal breath sounds (relative to preceding normal breath sounds), louder obstructed breathing sounds, or a combination of the two.
Figure 4.
Representative examples of respiratory events with sound spectrograms. No breath sounds are present during the obstructive and central apneas. The low amplitude rapid movements on the breathing movement trace during the central apnea are cardiogenic. The third example shows a discernible and gradual change in the Sonomat breathing movement signal during the hypopnea with breath sounds becoming louder (yellow and red colors) as the hypopnea progresses.
Body movements were scored on the breathing movement channel when there was an abrupt change from a pattern of clear breathing movements, and terminated when there was either a return to a regular pattern of breathing, or the subject lay immobile not attempting to breathe (post-movement central apnea). Two different classes of body movements were scored—spontaneous and respiratory-related—each dependant on the type of breath sounds that were present within a window of 3 breaths or 5 seconds prior to the movement. “Spontaneous” movements were scored when a body movement was preceded by normal breath sounds, and “respiratory event induced” (REI) movements were scored when a body movement was preceded by apneas, hypopneas, or snoring. The minimum duration of a spontaneous body movement considered to be significant was 3 sec, which is analogous to the minimum duration of an EEG arousal,5 but REI movements of any length were considered significant, as these were associated with the termination of an abnormal breathing event. The total duration of all significant body movements was removed from the total recording time (TRT) to calculate the “quiescent” time (Qd). This Qd duration, containing all periods of postural immobility, was used as an estimate of total sleep time (TST). The AHI from the Sonomat studies (AHIMAT) was generated by dividing the number of valid respiratory events by the Qd.
Data Analysis
All studies were manually scored in random order by a scorer (first author) blinded to both the identity and relationship of paired recordings. In order to examine the reliability of PSG and Sonomat scoring by a single individual, a sample of 29 PSG recordings were re-scored by 3 additional PSG scorers, and 25 Sonomat recordings were selected and scored by a different group of 4 experienced Sonomat scorers; 10 Sonomat studies were scored by one additional scorer and 15 Sonomat studies were scored by 3 additional scorers. Matched PSG and Sonomat studies were time-synchronized to ensure that analysis periods were identical. The Sonomat was visually and aurally scored using Sonomat Replay (Sonomedical, Balmain, Australia) with criteria developed in the David Read Laboratory, University of Sydney. In the supervised recordings, analysis started from when “lights out” was noted in the PSG recording, but in the unsupervised studies analysis began after the last of a series of frequent body movements that followed the subject lying down with the intention to sleep. Periods containing an uninterpretable airflow signal were identified within both recording methods. These were scored within PSG recordings when the nasal pressure signal was poor and marked regardless of the quality of the thermistor trace, as this latter signal cannot be relied on for the identification of hypopneas.9 Within Sonomat recordings, a poor quality signal was scored if no breath sounds could be identified visually or aurally on the breath sound channel. In addition, if an uninterpretable airflow signal was identified within one method of recording, the same time period in the corresponding study was removed from further analysis, even if containing good quality signals, to allow for an unbiased comparison.
In order to treat all data in a similar fashion, and because the scoring software could not be used to compare individual respiratory events, all scored events from matched analysis periods were exported from the respective scoring programs as text delimited files and processed in exactly the same manner using Microsoft Excel (Microsoft, Redmond, WA). The exported files contained the epoch number, event name, start time, duration of event, and in the case of PSG recordings the sleep stage within which the event was scored. Calculations were basic mathematical operations involving addition, division, and conversion to percentages.
Comparison of Individual Respiratory Events
All respiratory events from all PSG and Sonomat studies were individually identified and compared. Events were then classified as true positive (TP): PSG and Sonomat events occurred at the same time; false positive (FP): present within a Sonomat recording but no evidence of an event in the paired PSG recording; and false negative (FN): present within a PSG recording but there was no evidence of an event in the paired Sonomat recording.
As the absence of a respiratory event is never scored within PSG or Sonomat recordings, the determination of true negative (TN) events required different analysis. A total of 3,000 individual 30-s PSG epochs (50 epochs per subject) were randomly selected and compared with the corresponding Sonomat recordings for the presence or absence of respiratory events. Epochs of wake were included, as it was possible that respiratory events were scored within Sonomat recordings during periods of PSG defined wake.
In order to determine if gender, BMI, or body position had any influence on Sonomat recordings, the relationship between these variables and FP and FN events was examined.
Statistical Analysis
Statistical and graphical analyses were performed using PASW Statistics GradPack 17.0 (SPSS Inc., Chicago, IL, USA) and GraphPad Prism 6 (GraphPad Software Inc., La Jolla, CA, USA). Normally distributed data are presented as mean ± standard error of the mean (SEM), and non-normally distributed data are presented as median and interquartile range (IQR). To test for differences a paired Student t-test was performed for normally distributed data and a Wilcoxon rank test was used for non-normally distributed data. Spearman correlation coefficient was used to examine the relationship between measures; the intraclass correlation coefficient (ICC) was used to examine correlation between methods; and a Kruskal-Wallis test was used to compare multiple measures. A P-value of < 0.05 was considered to be significant. To assess diagnostic accuracy, Cohen's κ statistic was calculated, Bland-Altman analysis was performed, and values for sensitivity, specificity, and accuracy were calculated.
To examine inter-scorer reliability several analyses were performed.
Cohen's κ statistic was used for the comparison of 2 scorers, and a Fleiss modified κ23 was used when multiple scorers were involved. The 4 categories for each of the 3 Fleiss analyses were: AHI (normal = AHI < 5; mild = AHI ≥ 5, < 15; moderate = AHI ≥ 15, < 30; severe = AHI ≥ 30), number of respiratory events (normal = < 40; mild = ≥ 40, < 120; moderate = ≥ 120, < 240; severe = ≥ 240), and Qd as a percentage of TRT (excellent ≥ 95%; adequate = ≥ 90%, < 95%; poor = ≥ 85%, < 90%; insufficient < 85%). The value of κ is 1.0 with complete agreement and 0.0 when agreement is due to chance
We examined how many scorers would have provided a different diagnosis (normal, mild, moderate, and severe) based on the Sonomat AHI. Severity categories are as per the previous point
A coefficient of variation was calculated for the Qd and the AHI in 15 Sonomat studies and for the TST and the AHI in 29 PSG studies
RESULTS
Sonomat and PSG recordings were performed in 62 subjects (37 male, age 56 ± 16 years, BMI = 31.3 ± 6.3 kg/m2). Two were excluded from further analysis because the PSG study contained < 4 h of interpretable nasal flow signal. In the remaining 60 subjects, the PSG recordings contained significantly more uninterpretable airflow signals than the Sonomat recordings (PSG = 11.7 ± 3.2 min, Sonomat = 3.9 ± 1.9 min; P = 0.028). Of 26,999 minutes of total recording time, there were 1,279 minutes of poor flow signal within PSG studies (4.7% of recording time) and 236 minutes of poor flow signal within Sonomat recordings (0.9% of recording time). At least one period of poor flow was present in 19 of the PSG studies (range 2.6–302.7 min) and in 9 Sonomat studies (range 0.9–89.1 min).
Table 1 summarizes the PSG findings relevant for the diagnosis of SDB and the equivalent Sonomat measurements in all 60 subjects.
Table 1.
Comparison of sleep and respiratory parameters as determined by PSG and the Sonomat

The relationship between the AHIPSG and the AHIMAT is shown in Figure 5. The largest differences occurred at AHI values > 50 events per hour, with a much tighter relationship present around values commonly used as diagnostic thresholds (5 and 15 events/h). Bland-Altman analysis (Figure 6) confirms that there is no systematic error present and differences in AHI values are small around common diagnostic thresholds.
Figure 5.
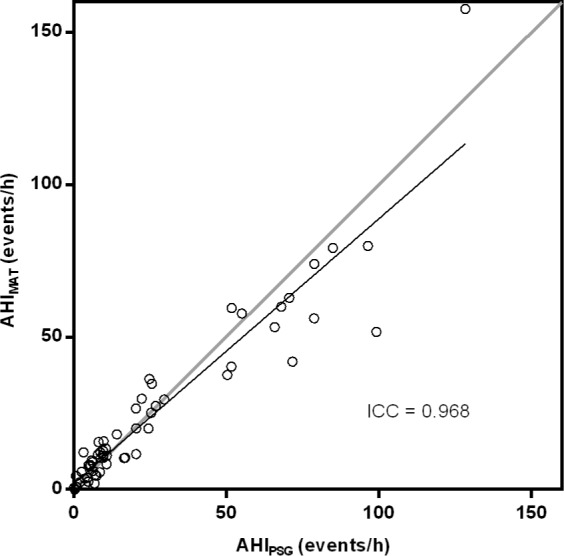
Relationship between the AHI derived from PSG and the Sonomat. There was a good correlation and no significant difference was found between the two methods (P = 0.908).
Figure 6.
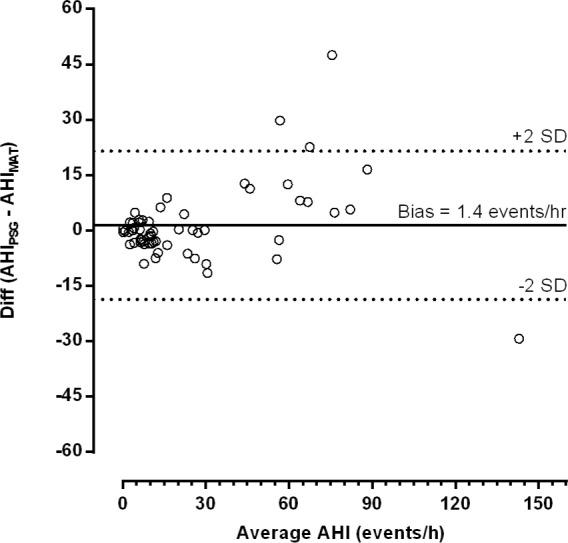
Bland-Altman plot showing the difference in AHI values. The mean bias indicates that, on average, the Sonomat underestimated the AHI by approximately 1.4 (95% CI -1.3 to 4.1) events per hour. The differences in values are small within the spectrum of common diagnostic thresholds (5–15 events per hour).
Data illustrating the diagnostic accuracy of the Sonomat at different AHI thresholds (5, 15, and 30 events per hour) are shown in Table 2 and Figure 7. Only small numbers of subjects were found to have their disease state either overestimated or underestimated by the Sonomat.
Table 2.
Measures of accuracy of the Sonomat in 60 subjects at commonly used AHI thresholds

Figure 7.
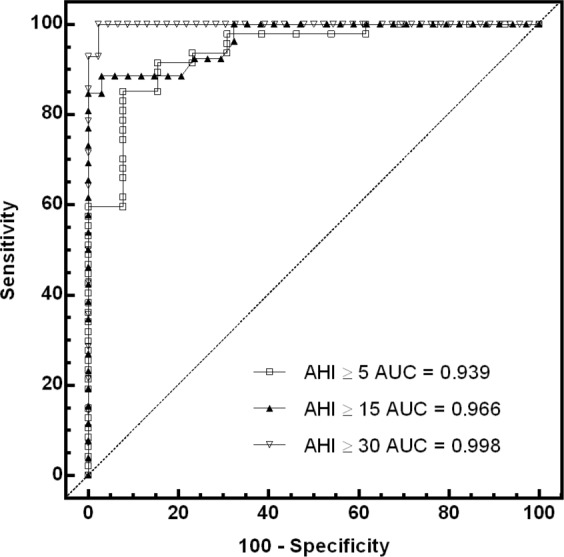
ROC curves and values for the area under the curve (AUC) at commonly used AHI thresholds.
At an AHI threshold of 15 events/h, Cohen's κ statistic for the PSG inter-scorer comparison was 0.8 and that for Sonomat inter-scorer comparison was 0.81. The ICC values were 0.958 and 0.964 for PSG and Sonomat scoring, respectively.
Sonomat scoring was shown to have minimal variability among four scorers. Table 3 shows the variability in the severity of OSA as assessed by different Sonomat scorers, with all but one subject observed to be categorized in adjacent levels of severity. Table 4 shows that there was good agreement between Sonomat scorers in the assessment of respiratory events and the AHI and less agreement for the measurement of Qd.
Table 3.
Severity of OSA based on four Sonomat technicians' AHI scores
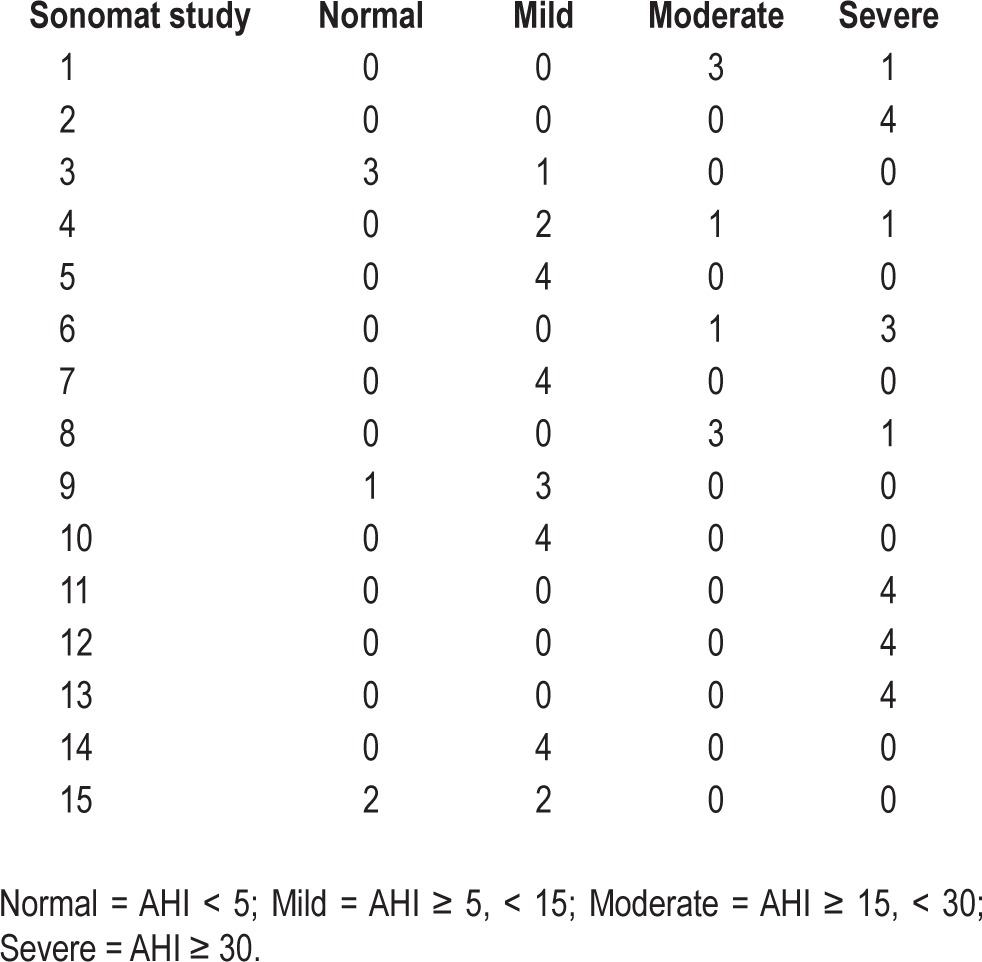
Table 4.
Variability in quiescent time (Qd), respiratory events, and the AHI
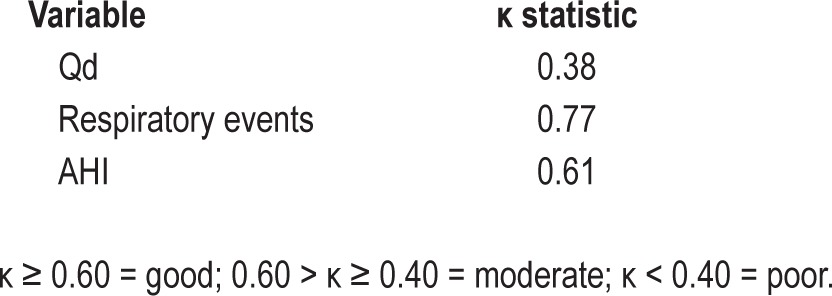
Figure 8 plots the coefficient of variation for the TST and the AHI in 29 PSG studies, and Figure 9 is a plot of the coefficient of variation for the Qd and the AHI in 15 Sonomat studies. There is minimal variability in the estimate of TST, but there is a very large variability in the AHI within PSG recordings. The variability of Qd is slightly more than that of the AHI in Sonomat recordings, which shows very little variability in the majority of studies; this contrasts markedly with the variation in PSG generated AHI values (Figure 8).
Figure 8.
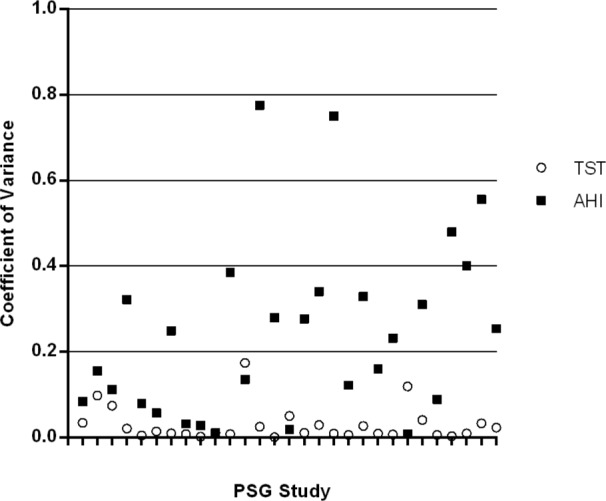
Coefficient of variation for TST and AHI values in PSG recordings (inter-scorer comparison). The higher the number the more variability is present. Each tick mark on the x axis represents a single PSG study.
Figure 9.
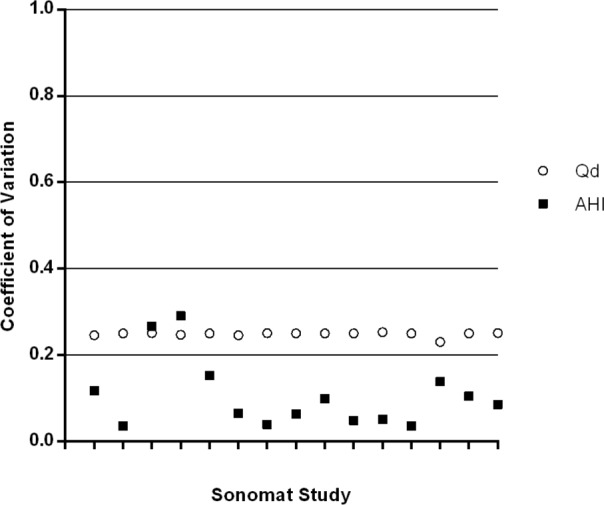
Coefficient of variation for Qd and AHI values in Sonomat recordings (inter-scorer comparison). The higher the number the more variability is present. Each tick mark on the x axis represents a single Sonomat study
There were 8,091 respiratory events identified within PSG recordings and 8,824 events identified within Sonomat recordings; of these there were 6,780 Sonomat events that corresponded to 6,742 events in the PSG studies (TP events). This discrepancy was due to one long PSG hypopnea being scored as two or more shorter hypopneas in the corresponding Sonomat study. The absence of respiratory events was correctly identified by the Sonomat in 91.3% of randomly selected epochs. There were 567 PSG events not identifiable within Sonomat recordings (FN events) and 507 Sonomat events not identifiable within PSG recordings (FP events); this translates to the Sonomat being able to identify 93% of respiratory events identifiable within PSG recordings, and PSG confirming that 94% of Sonomat events were abnormal breathing events. There were 98 respiratory events identified in Sonomat recordings (1.1% of all scored events) that were subsequently shown to have been scored during EEG defined wake in the paired PSG recordings.
There was no correlation between BMI and FN events (r = 0.066, P = 0.617) or FP events (r = 0.118, P = 0.370) and no difference in the numbers of FN and FP events in obese and non-obese subjects using a BMI threshold of 30 kg/m2 (FN < 30 = 3 (1, 14), FN > 30 = 6 (2, 14); P = 0.293 and FP < 30 = 4 (2, 14), FP > 30 = 9 (4, 12); P = 0.401). There was also no significant difference between gender and the numbers of FN (FN♂ = 8 (1, 15), FN♀ = 4 (0, 12); P = 0.142) and FP (FP♂ = 5 (2, 13), FP♀ = 9 (3, 12); P = 0.312) events.
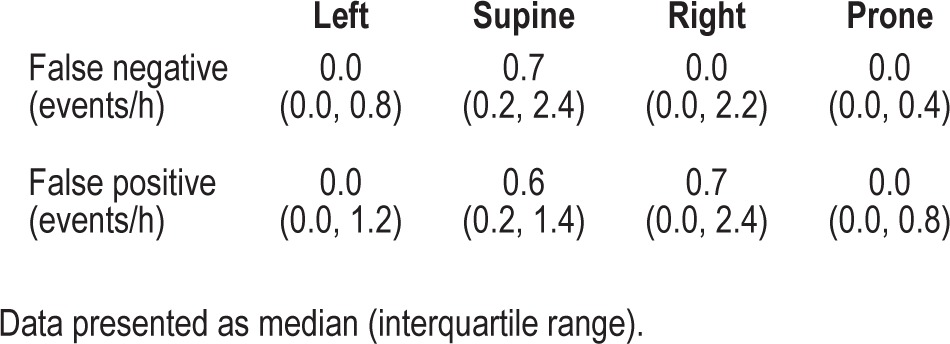
The time spent in different body positions was significantly different (supine = 220.1 [139.3, 363.7] min, left = 67.1 [1.7, 145.8] min, right = 26.9 [0.0, 165.2] min, prone = 0.0 [0.0, 20.3] min; P < 0.0001) and the rate of occurrence of false negative and false positive events is presented in Table 5. Body position had minimal influence on the ability of the Sonomat to correctly identify respiratory events. The overall impact of the events shown in Table 5 was to modify the reference AHI (PSG defined) by 0.2 events per hour.
Table 5.
False negative and false positive events occurred infrequently in all body positions.
Assessment of the ability of the Sonomat to differentiate central and obstructive events was performed and there was good correlation between these event types (obstructive apneas r = 0.831, P < 0.0001; central apneas r = 0.888, P < 0.0001; mixed apneas r = 0.630, P < 0.0001). Only 4.3% of PSG-defined obstructive events were misclassified by the Sonomat as central events, and only 0.2% of PSG-defined central events were misclassified by the Sonomat as obstructive events.
The total amount of snoring was not significantly different between PSG and the Sonomat (SnorePSG = 111.8 ± 11.6 min, SnoreMAT = 120.7 ± 10.7; P = 0.226). There were 22 subjects whose PSG snoring was recorded using a tracheal microphone, 18 whose PSG snoring was recorded using the nasal cannula method, and 20 subjects whose PSG snoring was recorded using a calibrated room sound microphone. The difference between these 3 methods is illustrated in Figure 10. The amount of snoring recorded using the tracheal microphone was not significantly different from that recorded using the Sonomat (SnoreMIC-TRA = 90.3 ± 14.3 min, SnoreMAT = 101.3 ± 16.3 min; P = 0.230) and the mean difference was -11.0 (95% CI -29.6 to 7.5) min (range -123.5 to 58.6). The amount of snoring recorded using the calibrated room sound microphone was also not significantly different from that recorded using the Sonomat (SnoreMIC-CAL = 172.0 ± 20.5 min, SnoreMAT = 143.3 ± 17.6 min; P = 0.059), and the mean difference was -28.7 (95% CI -58.6 to 1.2) min (range -167.9 to 107.0). In contrast to these 2 PSG methods, snoring recorded using the cannula snore method was significantly less than the amount identified on the Sonomat (SnoreCANN = 71.2 ± 18.9 min, SnoreMAT = 119.4 ± 22.1 min; P < 0.0001). The mean difference for the nasal cannula method was -48.2 (95% CI -64.7 to -31.8) min (range -114.0 to 0.1).
Figure 10.
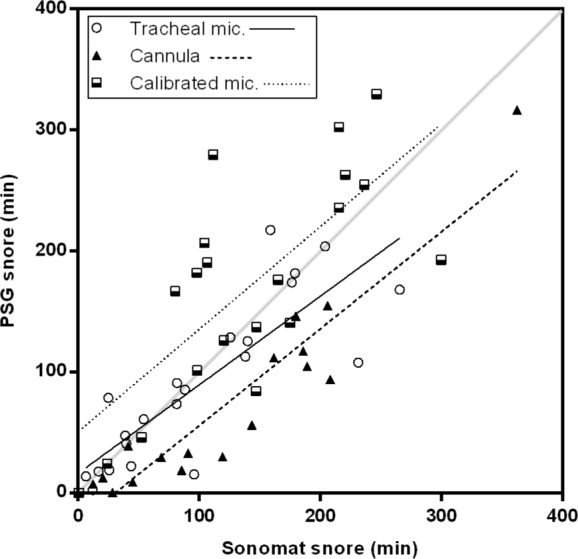
Relationship between snoring detected by the Sonomat and PSG methods. For this comparison the Sonomat results were considered to be the reference as snoring could be confirmed audibly; tracheal microphone method (n = 22, r = 0.850, P < 0.0001), calibrated room sound microphone (n = 20, r = 0.695, P = 0.0007), and the nasal cannula methods (n = 18, r = 0.907, P < 0.0001).
Examination of Figure 10 shows that the tracheal microphone method had a closer relationship to Sonomat snore detection than did both the calibrated room sound microphone and the nasal cannula methods. The nasal cannula method consistently underestimated the amount of snoring present, whereas the calibrated room sound microphone tended to overestimate snoring.
DISCUSSION
This study demonstrates that the Sonomat is capable of providing a reliable diagnosis of SDB. A particular advantage of the device is the high fidelity recording of breath sounds that permits accurate identification of pathological sounds and provides frequency and amplitude information that can be used to qualitatively confirm and quantify snoring. Another advantage of this system is that it records an airflow signal noninvasively. In the current study, the Sonomat detection of airflow was more reliable than the PSG flow sensors. This probably reflects that fact that breath sounds as detected by the Sonomat sensors are less influenced by breathing route than are nasal pressure and thermistor recordings. The measurement of body movement also provides a convenient and consistent measure of sleep time in the form of periods of immobility. While the system depends on the subject lying on the sensors, we found that gender, body position, and BMI had no significant impact on the detection of respiratory events, and there was only a small amount of time when the patient was not lying on a sensor.
The Sonomat AHI values were not significantly different from those generated using PSG, with the Sonomat underestimating the PSG derived AHI by approximately 1 event per hour (Figure 6). The biggest differences occurred when the AHI was higher than 50 events per hour, a level that becomes of minimal importance in clinical practice, as any AHI value above 30 represents severe disease. At commonly used diagnostic thresholds, measures of accuracy were very good to excellent (Table 2 and Figure 7), and very few subjects had their AHI overestimated or underestimated. There were, however, very few subjects with AHI values between 30 and 50 events per hour, and this may have enhanced the values for sensitivity and specificity (Table 2) and the shape of the ROC curve (Figure 7) when using an AHI threshold of 30 events per hour to examine accuracy. These results are similar to a study that used breath sound recordings to diagnose sleep apnea.24 SDB is often classified as mild (AHI ≥ 5), moderate (AHI ≥ 15) or severe (AHI ≥ 30),25 and all subjects whose disease severity, based on the Sonomat AHI, differed from the PSG determined level of severity (Table 2) were categorized into the adjacent level of severity. The precise numerical value of the AHI, although important in research and validation studies, may be less critical in most clinical practice, where physicians rely on clinical judgment, moreso than a single number produced from a single night of recording. Of more importance is the ability to assess the obstructive or central nature of respiratory events, and the Sonomat was shown to be able to differentiate these events accurately. The reliability of Sonomat scoring between scorers was high, and there was minimal variability in the assessment of the AHI, with κ values similar to, or better than those demonstrated in PSG scoring.26,27
Body movements were used to calculate the duration of immobility, the “quiescent time” (Qd), which was used as an index of sleep time. Thus, it is similar to actigraphy, which is a well-accepted method of estimating sleep time from movement signals.28 The Sonomat has an advantage over traditional actigraphy, which utilizes devices worn continuously by the subject, in that body movements are obtained while the subject is lying on the device. Therefore, it is actigraphy occurring during a period of “intention to sleep” and will not include any periods of immobility that occur out of bed. This study shows that the TST generated from Sonomat recordings overestimated the precise EEG derived TST by 37 minutes on average, and this difference was not sufficient to impact significantly on the AHI. Guidelines suggest that an EEG recording is required to confirm that sleep is present so that respiratory events may be scored, but this study found that only 1% of a very large number of respiratory events were scored when the subject was classified as awake on the PSG. This suggests that an EEG recording may not be essential in the diagnosis of SDB and explains why many other diagnostic devices that do not quantify sleep are still diagnostically accurate.
There was a statistically significant difference between the total numbers of respiratory events detected using PSG and the Sonomat (Table 1). Current PSG scoring conventions require an associated oxyhemoglobin desaturation or an EEG arousal when scoring hypopneas when there is a decrease in the amplitude of a nasal flow signal in PSG. However, as there is no such requirement in Sonomat recordings, more perturbations in breathing will be classified as respiratory events. A more relevant measure of accuracy is the mean difference, which showed that only 12 additional events were identified by the Sonomat— a difference of unknown clinical significance. A paired comparison of the total number of respiratory events does not, however, indicate whether or not respiratory events are being detected at the same points in time in both recording devices, and this may potentially mask inaccuracies in the detection of events by the test device. This is particularly important if different methods of measuring airflow are being compared. Examination of the relationship between individual respiratory events and the absence of respiratory events was undertaken in this study.
The Sonomat correctly identified both the absence of respiratory events and the presence of respiratory events in the majority of occasions. Most individual respiratory events recorded by the Sonomat were found to match a specific respiratory event within PSG recordings; however, long PSG hypopneas were often scored as two or more shorter hypopneas in the corresponding Sonomat study. This occurred when a loud snore (typically a loud, short “break-through” snore), combined with an observable difference in the amplitude of the breathing movement signal, signified the termination of a Sonomat hypopnea. However, as the snore was not associated with an increase in nasal flow amplitude exceeding the 50% threshold, the PSG hypopnea event was scored as a single event. This phenomenon has also been noted by other authors investigating breath sounds29–31 and illustrates how events can appear subtlety different when using different methods of recording airflow, confirming the necessity of examining respiratory events individually.
Analysis of the variability of PSG and Sonomat scoring produced interesting results. Inconsistency in PSG scoring is a well-documented issue, and the results shown in this study (Figure 8) are almost identical to those found previously.26 The variability of Sonomat scoring differed, however, as there was greater variability in the measure used in the denominator of the AHI equation (Qd), but there was much less variability in the actual AHI (Figure 9). To score a respiratory event within a PSG recording, an epoch of sleep must firstly be identified, then a decrease in a measure of breathing identified, and—in the case of hypopneas—a subsequent EEG arousal or significant level of desaturation identified. The lack of any one of these will result in a respiratory event not being scored, and if different scorers do not consistently identify all of these parameters, variability in the AHI will inevitably ensue. Any variability in the identification of Sonomat respiratory events relates to the variability in identifying one parameter only, a change in a measure of breathing. Arguably, a smaller level of variability in the measure used to diagnose SDB, shown by the Sonomat, is preferred.
The high sampling rate of the Sonomat enables audio replay of individual breath sounds, thus providing auditory and frequency spectrum confirmation of a visual event if there is any doubt about the nature of a signal. For this reason the Sonomat was used as the reference device in the snoring analyses. The tracheal microphone recordings and the nasal cannula method of snore detection in the PSG systems did not have audio replay capabilities, and, although the calibrated room sound microphone did produce an audio recording, it did not form part of the integrated snore signal within the PSG study but was contained within a video recording. Replaying the video recording to audibly score snoring was not performed as it was the visual representation of the different methods of recording snoring on PSG that was being examined; this is how snoring is typically scored on PSG, using visual cues. The nasal cannula method significantly underestimated the amount of snoring present, whereas the tracheal microphone and the calibrated room sound microphone did not (Figure 10). As the tracheal microphone is situated on the neck, the presence of mouth breathing would be unlikely to interfere with the detection of snoring vibrations, whereas mouthbreathing could affect snore detection when using the nasal cannula method. Furthermore, the recommended high-frequency filter setting of 100 Hz for recording snoring during PSG is inadequate5; this setting is too low to capture the typical range of snoring, and is probably one of the reasons that, in general, snoring is not adequately quantified. The Sonomat provides a quantitative measure of snoring across a more physiologically relevant frequency range (up to 2,000 Hz) and, by recording breath sounds, overcomes some of the limitations of PSG snore sensors. The calibrated room sound microphone, in contrast to the other two methods of recording snoring on PSG, does provide a much more accurate method of recording snoring by capturing frequencies up to 20,000 Hz. However, the visual snore trace produced by this method of recording is dependent on the amplitude of a sound and does not contain any information relating to frequency components, so therefore can include many non-snoring sounds. The sounds recorded by the room sound microphone must be replayed in real time to confirm the nature of the signals observed in the integrated snore sound trace and to eliminate other ambient non-snoring sounds (e.g., talking, door closure, loud normal breath sounds).
There were two subjects in whom noticeably more snoring appeared to be detected using the tracheal microphone than was evident in their Sonomat recordings (Figure 10). This, however, was not due to snoring sounds being detected by the tracheal microphone as these sounds were confirmed (audibly) to be non-snoring sounds during Sonomat analysis. There were several subjects who appeared to have a lot more snoring detected using the calibrated room sound microphone (Figure 10) but again, these were confirmed to be non-snoring sounds by the Sonomat. Calibrated room sound microphones are very sensitive, and any sound of sufficient amplitude will be detected and appear on the integrated snore sound trace. Normal breath sounds and many other adventitious sounds can contain the same frequency components as snoring32; therefore, different breath sounds may be wrongly identified as snoring if vibrations are present with sufficient power to register on a snore sensor that has no ability to present the frequency spectrum to allow for discrimination of the source of vibrations. As the Sonomat records a wide spectrum of vibration/sound, it can differentiate between snoring and other breathing sounds that contain similar frequency components, and opens up the possibility of recording and quantifying sounds such as wheezing and crackles. These are adventitious sounds that are associated with nocturnal asthma and heart failure, conditions that can occur with sleep apnea. The contactless nature of the Sonomat may permit long-term recording of these and other chronic disease states in the home, for the purpose of tracking disease progression and/or changes in disease severity or following new treatments.
Limitations of the study include a relatively small number of patients and different PSG recording devices used in different locations. The technical differences between the PSG equipment should have had minimal impact on any comparison as all meet the appropriate specifications as set out by the AASM.5 All PSG devices used similar sensors; the only significant exception was the lack of a thermistor in the home recordings. This would not have had a significant impact on the AHI, as this signal is used to discriminate between apneas and hypopneas,9 and this degree of precision was not examined. If the location of recording did influence the amount of sleep or SDB that was present, the same atypical data was being recorded by both devices, and the simultaneous nature of the study removed the influence of any night-to-night variability. Whereas the paired PSG and Sonomat studies were scored by a single individual, the inter-scorer accuracy was shown to be good for both PSG and Sonomat scoring. Further studies could examine the accuracy of the Sonomat when an oxygen saturation signal is incorporated to determine whether this increases the relative accuracy of hypopnea detection and subsequent diagnosis, although the accuracy presented here is very good.
CONCLUSION
This study suggests that the Sonomat appears to be an accurate and reliable device for the diagnosis of sleep disordered breathing. It generated an accurate AHI and detected snoring with more precision than commonly used methods. The lack of a requirement to attach sensors increased the potential of the equipment for diagnosis performed in the home, and there is potential for its use in ruling in or ruling out sleep disordered breathing in the many comorbidities in which the disorder is now known to occur.
DISCLOSURE STATEMENT
Sonomedical Pty. Ltd. provided free use of three Sonomat devices. Dr. Colin Sullivan is a director and co-owner of Sonomedical Pty. Ltd. Dr. Mark Norman has been sponsored to attend conferences by Sonomedical Pty. Ltd. The other authors have indicated no financial conflicts of interest.
ACKNOWLEDGMENTS
The authors thank the staff in the sleep laboratories at North Gosford Private Hospital and the Westmead Sleep Investigation and Research Centre for setting up and supervising the laboratory-based PSG recordings. Thanks also go to the additional scorers whose work was used in the inter-scorer analyses (Gordana Sears, Sara Cooper, Sonia Pithers, Caroline Hale, Hua Su, Pamela Johnson and Steven Mai).
ABBREVIATIONS
- AASM
American Academy of Sleep Medicine
- AHI
apnea/hypopnea index
- AI
apnea index
- AUC
area under the curve
- BMI
body mass index
- ECG
electrocardiogram
- EEG
electroencephalogram
- EMG
electromyogram
- EOG
electrooculogram
- FN
false negative
- FP
false positive
- HI
hypopnea index
- Hz
Hertz
- ICC
intraclass correlation coefficient
- IQR
interquartile range
- OSA
obstructive sleep apnea
- PSG
polysomnography
- Qd
quiescent time
- REI
respiratory event induced
- SaO2
oxygen saturation
- SDB
sleep disordered breathing
- SCSB
static charge sensitive bed
- SEM
standard error of the mean
- TN
true negative
- TP
true positive
- TST
total sleep time
REFERENCES
- 1.Flemons WW, Douglas NJ, Kuna ST, Rodenstein DO, Wheatley J. Access to diagnosis and treatment of patients with suspected sleep apnea. Am J Respir Crit Care Med. 2004;169:668–72. doi: 10.1164/rccm.200308-1124PP. [DOI] [PubMed] [Google Scholar]
- 2.Masa JF, Corral J, Pereira R, et al. Effectiveness of home respiratory polygraphy for the diagnosis of sleep apnoea and hypopnoea syndrome. Thorax. 2011;66:567–73. doi: 10.1136/thx.2010.152272. [DOI] [PubMed] [Google Scholar]
- 3.Deutsch PA, Simmons MS, Wallace JM. Cost-effectiveness of split-night polysomnography and home studies in the evaluation of obstructive sleep apnea syndrome. J Clin Sleep Med. 2006;2:145–53. [PubMed] [Google Scholar]
- 4.Ayas NT, Fox J, Epstein L, Ryan CF, Fleetham JA. Initial use of portable monitoring versus polysomnography to confirm obstructive sleep apnea in symptomatic patients: an economic decision model. Sleep Med. 2010;11:320–4. doi: 10.1016/j.sleep.2009.08.015. [DOI] [PubMed] [Google Scholar]
- 5.Iber C, Ancoli-Israel S, Chesson AL, Jr., Quan SF. 1st ed. Westchester IL: American Academy of Sleep Medicine; 2007. The AASM manual for the scoring of sleep and associated events. [Google Scholar]
- 6.Redline S, Sanders MH, Lind BK, et al. Methods for obtaining and analyzing unattended polysomnography data for a multicenter study. Sleep Heart Health Research Group. Sleep. 1998;21:759–67. [PubMed] [Google Scholar]
- 7.Poels PJ, Schilder AG, van den Berg S, Hoes AW, Joosten KF. Evaluation of a new device for home cardiorespiratory recording in children. Arch Otolaryngol Head Neck Surg. 2003;129:1281–4. doi: 10.1001/archotol.129.12.1281. [DOI] [PubMed] [Google Scholar]
- 8.Goodwin JL, Enright PL, Kaemingk KL, et al. Feasibility of using unattended polysomnography in children for research - report of the Tucson Children's Assessment of Sleep Apnea study (TuCASA) Sleep. 2001;24:937–44. doi: 10.1093/sleep/24.8.937. [DOI] [PubMed] [Google Scholar]
- 9.Redline S, Budhiraja R, Kapur V, et al. The scoring of respiratory events in sleep: reliability and validity. J Clin Sleep Med. 2007;3:169–200. [PubMed] [Google Scholar]
- 10.Acebo C, Watson RK, Bakos L, Thoman EB. Sleep and apnea in the elderly: reliability and validity of 24-hour recordings in the home. Sleep. 1991;14:56–64. doi: 10.1093/sleep/14.1.56. [DOI] [PubMed] [Google Scholar]
- 11.Agatsuma T, Fujimoto K, Komatsu Y, et al. A novel device (SD-101) with high accuracy for screening sleep apnoea-hypopnoea syndrome. Respirology. 2009;14:1143–50. doi: 10.1111/j.1440-1843.2009.01627.x. [DOI] [PubMed] [Google Scholar]
- 12.Arimoto M, Shiomi T, Sasanabe R, Inagawa S, Ueda H, Inafuku S. A sheet-type device for home-monitoring sleep apneas in children. Sleep Biol Rhythms. 2011;9:103–11. [Google Scholar]
- 13.Mack DC, Patrie JT, Suratt PM, Felder RA, Alwan MA. Development and preliminary validation of heart rate and breathing rate detection using a passive, ballistocardiography-based sleep monitoring system. IEEE Trans Inf Technol Biomed. 2009;13:111–20. doi: 10.1109/TITB.2008.2007194. [DOI] [PubMed] [Google Scholar]
- 14.Cavusoglu M, Ciloglu T, Serinagaoglu Y, Kamasak M, Erogul O, Akcam T. Investigation of sequential properties of snoring episodes for obstructive sleep apnoea identification. Physiol Meas. 2008;29:879–98. doi: 10.1088/0967-3334/29/8/003. [DOI] [PubMed] [Google Scholar]
- 15.Van Brunt DL, Lichstein KL, Noe SL, Aguillard RN, Lester KW. Intensity pattern of snoring sounds as a predictor for sleep-disordered breathing. Sleep. 1997;20:1151–6. doi: 10.1093/sleep/20.12.1151. [DOI] [PubMed] [Google Scholar]
- 16.Ng AK, Koh TS, Baey E, Lee TH, Abeyratne UR, Puvanendran K. Could formant frequencies of snore signals be an alternative means for the diagnosis of obstructive sleep apnea? Sleep Med. 2008;9:894–8. doi: 10.1016/j.sleep.2007.07.010. [DOI] [PubMed] [Google Scholar]
- 17.Goldman LJ. Nasal airflow and thoracoabdominal motion in children using infrared thermographic video processing. Pediatr Pulmonol. 2012;47:476–86. doi: 10.1002/ppul.21570. [DOI] [PubMed] [Google Scholar]
- 18.De Chazal P, Fox N, O'Hare E, et al. Sleep/wake measurement using a non-contact biomotion sensor. J Sleep Res. 2011;20:356–66. doi: 10.1111/j.1365-2869.2010.00876.x. [DOI] [PubMed] [Google Scholar]
- 19.Polo O. Partial upper airway obstruction during sleep. Studies with the static charge-sensitive bed (SCSB) Acta Physiol Scand Suppl. 1992;606:1–118. [PubMed] [Google Scholar]
- 20.Polo O, Brissaud L, Sales B, Besset A, Billiard M. The validity of the static charge sensitive bed in detecting obstructive sleep apnoeas. Eur Respir J. 1988;1:330–6. [PubMed] [Google Scholar]
- 21.Norman MB, Middleton S, Sullivan CE. The use of epochs to stage sleep results in incorrect computer-generated AHI values. Sleep Breath. 2011;15:385–92. doi: 10.1007/s11325-010-0344-5. [DOI] [PubMed] [Google Scholar]
- 22.Berry RB, Brooks R, Gamaldo CE, Harding SM, Marcus CL, Vaughn BV. Darien, IL: American Academy of Sleep Medicine; 2012. The AASM manual for the scoring of sleep and associated events: rules, terminology and technical specifications. Version 2.0. www.aasmnet.org. [Google Scholar]
- 23.Fleiss J, Levin B, Paik MC. The measurement of interrater agreement. In: Shewart WA, Wilks SS, editors. Statistical methods for rates and proportions. New York: John Wiley and Sons; 2003. pp. 598–626. [Google Scholar]
- 24.Nakano H, Hayashi M, Ohshima E, Nishikata N, Shinohara T. Validation of a new system of tracheal sound analysis for the diagnosis of sleep apnea-hypopnea syndrome. Sleep. 2004;27:951–7. doi: 10.1093/sleep/27.5.951. [DOI] [PubMed] [Google Scholar]
- 25.AASM Task Force. Sleep-related breathing disorders in adults: recommendations for syndrome definition and measurement techniques in clinical research. Sleep. 1999;22:667–89. [PubMed] [Google Scholar]
- 26.Collop NA. Scoring variability between polysomnography technologists in different sleep laboratories. Sleep Med. 2002;3:43–7. doi: 10.1016/s1389-9457(01)00115-0. [DOI] [PubMed] [Google Scholar]
- 27.Lord S, Sawyer B, Pond D, et al. Interrater reliability of computer-assisted scoring of breathing during sleep. Sleep. 1989;12:550–8. doi: 10.1093/sleep/12.6.550. [DOI] [PubMed] [Google Scholar]
- 28.Sadeh A, Hauri PJ, Kripke DF, Lavie P. The role of actigraphy in the evaluation of sleep disorders. Sleep. 1995;18:288–302. doi: 10.1093/sleep/18.4.288. [DOI] [PubMed] [Google Scholar]
- 29.Van Surell C, Lemaigre D, Leroy M, Foucher A, Hagenmuller MP, Raffestin B. Evaluation of an ambulatory device, CID 102, in the diagnosis of obstructive sleep apnoea syndrome. Eur Respir J. 1995;8:795–800. [PubMed] [Google Scholar]
- 30.Peirick J, Shepard JW., Jr Automated apnoea detection by computer: analysis of tracheal breath sounds. Med Biol Eng Comput. 1983;21:632–5. doi: 10.1007/BF02442390. [DOI] [PubMed] [Google Scholar]
- 31.Cummiskey J, Williams TC, Krumpe PE, Guilleminault C. The detection and quantification of sleep apnea by tracheal sound recordings. Am Rev Respir Dis. 1982;126:221–4. doi: 10.1164/arrd.1982.126.2.221. [DOI] [PubMed] [Google Scholar]
- 32.Sovijarvi AR, Malmberg LP, Charbonneau G, et al. Characteristics of breath sounds and adventitious respiratory sounds. Eur Respir Rev. 2000;10:591–6. [Google Scholar]


