Abstract
Background
Arterial blood gas (ABG) analysis is useful in evaluation of the clinical condition of critically ill patients; however, arterial puncture or insertion of an arterial catheter may cause many complications. The aim of this study was to determine whether venous blood gas (VBG) values can be used as an alternative to arterial blood gas measurements in patients under mechanical ventilation.
Materials and Methods
This study was carried out on patients admitted to the Intensive Care Unit of Kashan Beheshti Hospital. Blood for VBG analysis was obtained from the cubital vein, while for ABG analysis blood was taken simultaneously from the radial artery. ABG and VBG samples were obtained simultaneously, and indexes of pH, PCO2, HCO3, base excess (BE), PO2 and O2 saturation level were analyzed.
Results
A total of 102 pair of simultaneous venous and arterial blood samples were obtained from 102 patients (mean age 58.4±21.5 years). Seventy (69%) were males. The mean difference between arterial and venous values was 0.04 for pH, 5.6 mm/Hg for PCO2, -0.32 mmol/l for HCO3, -1.03 mmol/l for BE, 53.6 mm/Hg for PO2, and 23.5% for O2 saturation. The Pearson correlation coefficients between arterial and venous values for pH, PCO2, HCO3, BE, PO2 and O2 saturation were 0.874, 0.835, 0.768, 0.810, 0.287, and 0.310, respectively. Linear regression equations for the estimation of pH, PCO2, HCO3, BE, PO2 and O2 saturation were as follows: arterial pH=1.927+0.745×venous pH [r=0.801, p<0.001]; PCO2=6.470+0.706×venous PCO2 [r=0.835, p<0.001]; arterial HCO3=7.455+0.681×venous HCO3 [r=0.768, p<0.001]; arterial BE=-0.952+0.736×venous BE [r=0.810, p<0.001]; arterial PO2=70.374+0.620×venous PO2 [r=0.287, p=0.003]; arterial venous saturation= 89.753+0.082×venous O2 saturation [r=0.317, p=0.001].
Conclusion
Venous blood gases, especially pH, Base excess, and PCO2 levels have relatively good correlation with ABG values. Because this correlation is not close, VBG cannot substitute ABG in mechanically ventilated patients.
Keywords: Blood gas, Arterial, Venous, Mechanical ventilation
INTRODUCTION
Blood gas analysis is frequently requested as part of the point-of-care testing for emergency or critical care patients presenting with metabolic or respiratory abnormalities. Arterial blood gas analysis has an important role in determining acid-base balance and blood-gas status in mechanically ventilated patients. Despite its high efficacy in evaluating patient's response to treatment regimens, ABG test has some complications. The most common complications associated with arterial puncture are pain, arterial injury, infection, thrombosis with distal digit ischemia, hemorrhage, and aneurysm formation (1). An alternative to arterial blood gas sampling is VBG sampling obtaining venous blood is easier and the procedure is less complicated. Additionally, venous blood sample can be obtained when drawing blood for other laboratory.
Recently, studies have shown that values of acid–base status measured in peripheral venous blood correlate well with those measured in arterial blood, at least for values of pH, bicarbonate and carbon dioxide tension (PCO2) (2–4). In a study performed by Kelly et al, venous pH estimation showed a high degree of correlation (r=0.92) with the arterial value (4). Another study compared pH and PCO2 levels obtained from arterial and venous blood samples and demonstrated a significant correlation (5). Gennis et al. reported a high correlation for pH, PCO2, and HCO3, but the accuracy of predicting arterial values was limited, and they concluded that venous blood sampling can not be used for routine assessment of acid-base status (6). In patients with diabetic ketoacidosis, pH and PCO2 levels obtained from VBG have good correlation with ABG values (7). In Elborn et al. study conducted on COPD patients, no significant difference was observed between the arterial and venous CO2 tensions, and the two were closely correlated (8).
In a study by Rees et al. on 40 patients with chronic lung disease, they supported the use of peripheral venous blood for the estimation of PaO2 in a vast majority of patients (9). They also showed that peripheral venous carbon dioxide tension and pH correlate very well with arterial values (9). In another study, Malinoski et al. concluded that in mechanically ventilated traumatic patients, VBG and arterial PCO2, pH, and base excess values had good correlation (10).
The purpose of this study was to investigate the correlation between simultaneous ABG, and VBG values, to determine whether venous blood gases could correlate and replace arterial blood gases in the mechanically ventilated patients.
MATERIALS AND METHODS
This study was conducted in three adult ICUs in Kashan Beheshti Hospital on 102 patients who were admitted to receive mechanical ventilation. The hospital has 400-beds and is situated 950 meters above the sea level. The protocol was reviewed and approved by the local Ethics Committee of the Faculty of Medicine. Arterial and venous blood samples were collected simultaneously with minimum delay between obtaining samples. The Mean ± SD of pH, PCO2, HCO3, PO2, SaO2, and BE values in arterial and venous samples was determined. Arterial and venous blood samples were obtained with a heparinized syringe, labeled and sent to the laboratory in ice. Within less than 15 minutes, the 2 samples were analyzed using blood gas analysis machine (Gem Premier 3000, model 5700; Instrumentation laboratory, Lexington, MA) calibrated according to standard quality assurance protocols. Venous--arterial PCO2 gradient values were determined.
Comparison between ABG and VBG values such as pH, PCO2, HCO3, PO2, SaO2, and BE was done by Pearson test of correlation. The mean arterial and venous sample values were compared using Student's t-test. The estimation of arterial values from the venous values was performed using linear regression equations. P-value< 0.05 was considered statistically significant. Data was analyzed using SPSS version 11.1 software.
RESULTS
A total of 102 simultaneous venous and arterial blood samples were obtained from mechanically ventilated patients (70 males, 32 females, mean age 58.4±21.5 years). Clinical diagnoses included trauma, sepsis, cerebrovascular accident, pulmonary disease, heart failure, malignancy, and renal failure.
Table 1 presents a summary of arterial and venous blood gas values of pH, PCO2, HCO3, PO2, O2 saturation and base excess in mechanically ventilated patients.
Table 1.
Arterial and venous blood gas analysis in mechanically ventilated patients
| Variables | Arterial blood gas | Venous blood gas | P value |
|---|---|---|---|
| pH | 7.43±0.085 | 7.38± 0.092 | <0.001 |
| PCO 2 | 35.46± 9.76 | 41.07± 11.55 | <0.001 |
| HCO 3 | 24.05±4.84 | 24.36±5.46 | <0.001 |
| PO 2 | 97.69±37.66 | 44.08±17.42 | 0.003 |
| SaO 2 | 95.70±4.29 | 72.19±16.52 | 0.001 |
| Base excess | -0.74±6.15 | 0.29±6.76 | <0.001 |
Data are presented as mean ±SD.
PCO2: Partial pressure of carbon dioxide (mm/Hg); HCO3: bicarbonate (mmol/l); PO2: partial pressure of oxygen (mm/Hg); SaO2; oxygen saturation (%).
Table 2 presents the mean± SD of difference in venous-arterial gradient, and 95% confidence interval between arterial and venous blood gas values.
Table 2.
The correlation coefficient for pH, PCO2, HCO3, PO2, O2 saturation and Base excess in arterial and venous blood samples of mechanically ventilated patients.
| Variables | Arterial-Venous Gradient (mean ±SD) |
95% confidence interval |
P value |
|---|---|---|---|
| pH | 0.043±0.056 | (0.031 0.054) | <0.001 |
| PCO 2 | -5.62±6.35 | (-6.87 -4.37) | <0.001 |
| HCO 3 | -0.32 ±3.56 | (-1.02 0.38) | 0.369 |
| PO 2 | 53.61±36.68 | (46.41 60.82) | <0.001 |
| O 2 Saturation | 23.51±15.70 | (20.43 26.59) | <0.001 |
| Base excess | -1.023±4.026 | (-1.82 -0.24) | 0.011 |
Data are presented as mean ±SD.
PCO2: Partial pressure of carbon dioxide (mm/Hg); HCO3: bicarbonate (mmol/l); PO2: partial pressure of oxygen (mm/Hg); SaO2; oxygen saturation (%).
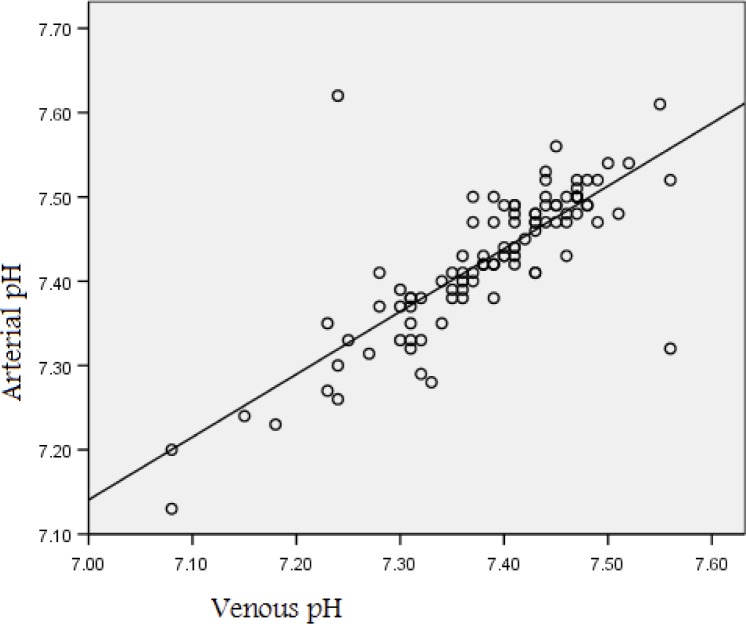
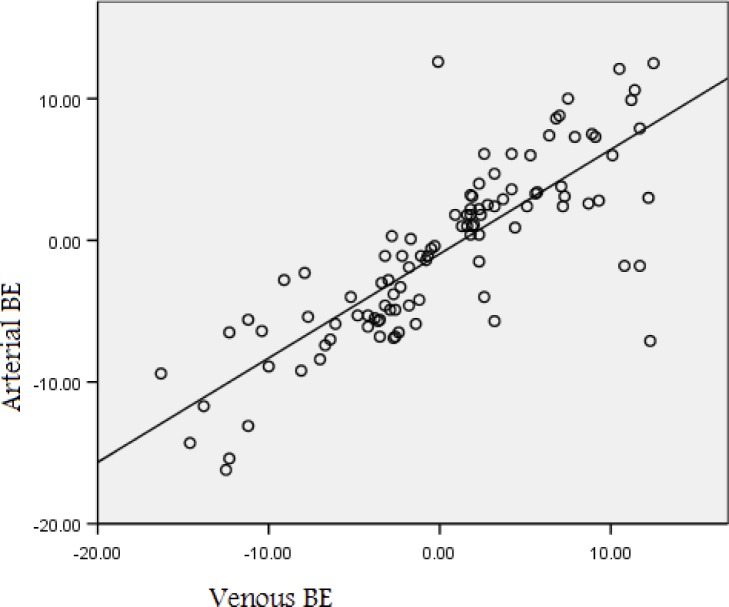
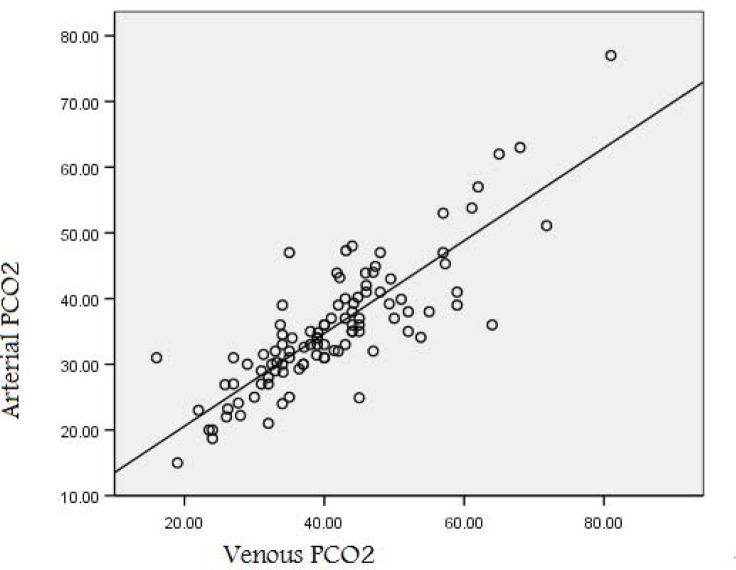
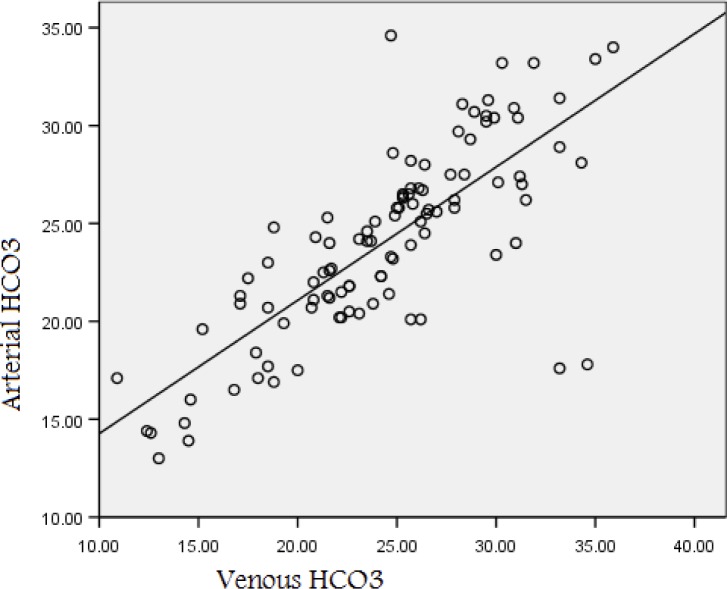
In Table 3 and Figures 1-4, the Pearson's correlation coefficient between ABG and VBG values was found to be 0.835, 0.810, 0.801, and 0.768 for PCO2, Base excess, pH and HCO3, respectively. On the other hand, there was a poor correlation between arterial PO2 and venous PO2 values (r=0.287), and also between arterial and venous saturation rates (r=0.317). As shown, there is better correlation regarding PCO2 value than other values in ABG and VBG samples (r=0.835, p<0.001).
Table 3.
The correlation coefficient of arterial and venous blood gas analysis for pH, PCO2, HCO3, PO2, O2 saturation and base excess in mechanically ventilated patients.
| pH | PCO2 | HCO3 | PO2 | SaO2 | BE | |||||||
|---|---|---|---|---|---|---|---|---|---|---|---|---|
| ABG | VBG | ABG | VBG | ABG | VBG | ABG | VBG | ABG | VBG | ABG | VBG | |
| ABG | 1 | 0.801 | 1 | 0.835 | 1 | 0.768 | 1 | 0.287 | 1 | 0.317 | 1 | 0.810 |
| VBG | 0.801 | 1 | 0.835 | 1 | 0.768 | 1 | 0.287 | 1 | 0.317 | 1 | 0.810 | 1 |
| p value | p<0.001 | p<0.001 | p<0.001 | p=0.003 | p= 0.001 | p<0.001 | ||||||
Figure 1.
Correlation between venous and arterial pH values (r=0.801).
Figure 4.
Correlation between venous and arterial base excess values (r=0.810).
In Table 4, regression equations for prediction of pH, PCO2, HCO3, BE, PO2 and O2 saturation were presented as follows: arterial pH=1.927+0.745×venous pH [r=0.801, p<0.001]; PCO2=6.470+0.706×venous PCO2 [r=0.835, p<0.001]; arterial HCO3=7.455+0.681×venous HCO3 [r=0.768, p<0.001]; arterial BE= -0.952+0.736×venous BE [r=0.810, p<0.001]; arterial PO2=70.374+0.620 ×venous PO2 [r=0.287, p=0.003]; arterial venous saturation= 89.753+0.082 ×venous O2 saturation [r=0.317, p=0.001].
Table 4.
Linear regression of arterial blood gas values and venous Blood gas values.
| Arterial | Venous Constant(SE) | β (SE) | R | R2 | SE of estimate |
|---|---|---|---|---|---|
| pH | 1.927(0.412) | 0.745(0.056) | 0.801 | 0.641 | 0.0514 |
| PCO 2 | 6.470(1.980) | 0.706(0.046) | 0.835 | 0.698 | 5.388 |
| HCO 3 | 7.455(1.418) | 0.681(0.057) | 0.768 | 0.590 | 3.117 |
| BE | -0.952(0.359) | 0.736(0.053) | 0.810 | 0.655 | 3.626 |
| PO 2 | 70.374(9.810) | 0.620(0.207) | 0.287 | 0.082 | 36.260 |
| O 2 Saturation | 89.753(1.825) | 0.082(0.025) | 0.317 | 0.1 | 4.092 |
Figure 2.
Correlation between venous and arterial PCO2 values (r=0.835).
Figure 3.
Correlation between venous and arterial HCO3 values (r=0.768)
DISCUSSION
This study demonstrated that venous blood gas values especially PCO2, base excess, and pH levels have relatively good correlation with ABG values (r<0.001). Because this correlation is not close (r<0.9), VBG cannot be a substitute for ABG in mechanically ventilated patients.
ABG analysis is a standard routine test for investigation of acid-base imbalance and ventilatory status. ABG is an invasive painful test associated with complications like infection, local hematoma, vascular injury, thrombosis and ischemic injury to the digits (1). Therefore, in order to decrease its complications, alternatives such as VBG analysis, pulse oximetry, End-tidal CO2, transcutaneous monitoring of oxygen and CO2 seem to be useful (1). Considering the ease of venous blood sample collection, it would be preferred over aterial sampling if a blood gas value determined by venous blood gas analysis could be used to reveal patient's acid-base status and had the same accuracy for patient management as that of arterial sampling. In this regard, various studies have been reported on children and adults in order to investigate the accuracy and efficacy of VBG analysis versus ABG (4, 11, 12, 13–16).
There is a growing body of evidence that for most patients venous pH is a clinically acceptable surrogate for arterial pH, (4, 7, 11, 17–19) and there is also some evidence supporting that agreement between venous and arterial bicarbonate concentrations is sufficient for clinical purposes (11, 19, 20). In a study carried out by Kelly et al. on 196 patients with acute respiratory disorder and 50 patients with suspected metabolic derangement, the venous and arterial pH showed a high degree of correlation (r=0.92) and with an average difference between the samples of -0.04 units (4). In the present study, this correlation was 0.801, which is not excellent (because r<0.90), and the difference between arterial and venous samples was 0.043±0.056. In another study conducted on 44 episodes of diabetic ketoacidosis, the mean difference between arterial and venous pH values was 0.03, which showed a high correlation (r=0.9689) (7). In a study by Gokel et al, on chronic uremia and diabetic ketoacidosis, the correlation between arterial and venous pH was 0.979 and 0.989 respectively; but in healthy control subjects this correlation was 0.595 (11). In Gokel et al. study, this rate was 0.05±0.01 and 0.04±0.02 in diabetic ketoacidosis and uremic acidosis; respectively (11).
Middleton et al. reported that in critically ill patients hospitalized in the ICU, central venous pH, bicarbonate, base excess, and lactate values had a high level of agreement with the respective arterial values (21). The mean difference between arterial and venous values was 0.03 Units for pH, 0.52 mmol/l for HCO3, 0.08 mmol/l for lactate, and 0.19 mmool/l for base excess (21). In a study by McBride et al. performed on infants and children after cardiothoracic surgery, the mean difference of pH and PCO2 values between ABG and VBG was 0.04 ± 0.02 and 8 ± 4mmHg; respectively (15). They concluded that VBG values did not provide a clinically useful estimate of ABG values following cardiothoracic surgery (15). Recently, Kelly in an article summarized the literature regarding the validity of VBG sampling in ketoacidosis and reported that venous and arterial pH had sufficient agreement to be clinically interchangeable (16). It should be mentioned that the majority of studies conducted on the substitution of VBG values for ABG ones have been carried out on pediatric patients. In a study carried out in pediatric intensive care unit, there was a significant correlation in pH, PCO2, and HCO3 between ABG and VBG values (14). Correlation in PO2 was also significant, but to a lesser extent (14).
Some studies have evaluated the substitution of VBG values for ABG in COPD patients (13, 22). In Kelly et al. study on 196 patients with acute respiratory disease 56 (29%) had significant hypercapnia. For pH, a good agreement with venous samples was found, but no sufficient agreement was detected for venous PCO2 to replace arterial PCO2 in clinical evaluation of ventilatory function (13). In a study by Rang et al. carried out on 218 patients with respiratory and metabolic illness, the correlation coefficient of pH, PCO2 and HCO3 values in arterial and venous samples was 0.913, 0.921, and 0.953 respectively (19). The mean differences of pH, PCO2, and HCO3 between arterial and venous samples were: 0.036, 6mmHg, and 1.5 mEq/L, respectively (19).
Limited studies have been conducted on the substitution of VBG values for ABG in mechanically ventilated patients (10, 23). Honarmand et al, in a study on 67 ventilated patients, concluded that arterialized earlobe blood gas can accurately predict the ABG values for patients who do not require close monitoring of arterial PO2 monitoring (23). In another study Malinoski et al. showed that in mechanically ventilated trauma patients, central venous and arterial PCO2, pH, and base excess values were well correlated (10). In their study, in spite of high correlation between arterial and venous blood for pH, PCO2, and base excess, the 95% limits of agreement were too wide to allow substitution (10).
In conclusion, venous blood gas analysis does not have excellent correlation with ABG analysis (r<0.9). The results show that VBG analysis cannot be a substitute for ABG for evaluation of ventilatory function and acid-base imbalance in mechanically ventilated patients.
REFERENCES
- 1.Barker . Arterial puncture and cannulation. In: Roberts JR, Hedges JR, editors. Clinical procedures in emergency medicine. 3rd edn. Philadelphia: WB Saunders; 1998. pp. 308–322. [Google Scholar]
- 2.Toftegaard M, Rees SE, Andreassen S. Correlation between acid-base parameters measured in arterial blood and venous blood sampled peripherally, from vena cavae superior, and from the pulmonary artery. Eur J Emerg Med. 2008;15(2):86–91. doi: 10.1097/MEJ.0b013e3282e6f5c5. [DOI] [PubMed] [Google Scholar]
- 3.Malatesha G, Singh NK, Bharija A, Rehani B, Goel A. Comparison of arterial and venous pH, bicarbonate, PCO2 and PO2 in initial emergency department assessment. Emerg Med J. 2007;24(8):569–71. doi: 10.1136/emj.2007.046979. [DOI] [PMC free article] [PubMed] [Google Scholar]
- 4.Kelly AM, McAlpine R, Kyle E. Venous pH can safely replace arterial pH in the initial evaluation of patients in the emergency department. Emerg Med J. 2001;18(5):340–2. doi: 10.1136/emj.18.5.340. [DOI] [PMC free article] [PubMed] [Google Scholar]
- 5.Paine EG, Boutwell JH, Soloff LA. The reliability of “arterialized” venous blood for measuring arterial pH and pCO2. Am J Med Sci. 1961;242:432–5. [PubMed] [Google Scholar]
- 6.Gennis PR, Skovron ML, Aronson ST, Gallagher EJ. The usefulness of peripheral venous blood in estimating acid-base status in acutely ill patients. Ann Emerg Med. 1985;14(9):845–9. doi: 10.1016/s0196-0644(85)80631-4. [DOI] [PubMed] [Google Scholar]
- 7.Brandenburg MA, Dire DJ. Comparison of arterial and venous blood gas values in the initial emergency department evaluation of patients with diabetic ketoacidosis. Ann Emerg Med. 1998;31(4):459–65. doi: 10.1016/s0196-0644(98)70254-9. [DOI] [PubMed] [Google Scholar]
- 8.Elborn JS, Finch MB, Stanford CF. Non-arterial assessment of blood gas status in patients with chronic pulmonary disease. Ulster Med J. 1991;60(2):164–7. [PMC free article] [PubMed] [Google Scholar]
- 9.Rees SE, Hansen A, Toftegaard M, Pedersen J, Kristensen SR, Harving H. Converting venous acid-base and oxygen status to arterial in patients with lung disease. Eur Respir J. 2009;33(5):1141–7. doi: 10.1183/09031936.00140408. [DOI] [PubMed] [Google Scholar]
- 10.Malinoski DJ, Todd SR, Slone S, Mullins RJ, Schreiber MA. Correlation of central venous and arterial blood gas measurements in mechanically ventilated trauma patients. Arch Surg. 2005;140(11):1122–5. doi: 10.1001/archsurg.140.11.1122. [DOI] [PubMed] [Google Scholar]
- 11.Gokel Y, Paydas S, Koseoglu Z, Alparslan N, Seydaoglu G. Comparison of blood gas and acid-base measurements in arterial and venous blood samples in patients with uremic acidosis and diabetic ketoacidosis in the emergency room. Am J Nephrol. 2000;20(4):319–23. doi: 10.1159/000013607. [DOI] [PubMed] [Google Scholar]
- 12.Harrison AM, Lynch JM, Dean JM, Witte MK. Comparison of simultaneously obtained arterial and capillary blood gases in pediatric intensive care unit patients. Crit Care Med. 1997;25(11):1904–8. doi: 10.1097/00003246-199711000-00032. [DOI] [PubMed] [Google Scholar]
- 13.Kelly AM, Kyle E, McAlpine R. Venous pCO(2) and pH can be used to screen for significant hypercarbia in emergency patients with acute respiratory disease. J Emerg Med. 2002;22(1):15–9. doi: 10.1016/s0736-4679(01)00431-0. [DOI] [PubMed] [Google Scholar]
- 14.Yildizdaş D, Yapicioğlu H, Yilmaz HL, Sertdemir Y. Correlation of simultaneously obtained capillary, venous, and arterial blood gases of patients in a paediatric intensive care unit. Arch Dis Child. 2004;89(2):176–80. doi: 10.1136/adc.2002.016261. [DOI] [PMC free article] [PubMed] [Google Scholar]
- 15.McBride ME, Berkenbosch JW, Tobias JD. Correlation of Venous and Arterial Blood Gas Values Following Cardiothoracic Surgery in Infants and Children. Journal of Intensive Care Medicine. 2001;16:231–5. [Google Scholar]
- 16.Kelly AM. The case for venous rather than arterial blood gases in diabetic ketoacidosis. Emerg Med Australas. 2006;18(1):64–7. doi: 10.1111/j.1742-6723.2006.00803.x. [DOI] [PubMed] [Google Scholar]
- 17.Gambino SR. Comparisons of pH in human arterial, venous and capillary blood. Am J Clin Pathol. 1959;32:298–300. [Google Scholar]
- 18.Ma OJ, Rush MD, Godfrey MM, Gaddis G. Arterial blood gas results rarely influence emergency physician management of patients with suspected diabetic ketoacidosis. Acad Emerg Med. 2003;10(8):836–41. doi: 10.1111/j.1553-2712.2003.tb00625.x. [DOI] [PubMed] [Google Scholar]
- 19.Rang LC, Murray HE, Wells GA, Macgougan CK. Can peripheral venous blood gases replace arterial blood gases in emergency department patients? CJEM. 2002;4(1):7–15. doi: 10.1017/s1481803500006011. [DOI] [PubMed] [Google Scholar]
- 20.Kelly AM, McAlpine R, Kyle E. Agreement between bicarbonate measured on arterial and venous blood gases. Emerg Med Australas. 2004;16(5-6):407–9. doi: 10.1111/j.1742-6723.2004.00642.x. [DOI] [PubMed] [Google Scholar]
- 21.Middleton P, Kelly AM, Brown J, Robertson M. Agreement between arterial and central venous values for pH, bicarbonate, base excess, and lactate. Emerg Med J. 2006;23(8):622–4. doi: 10.1136/emj.2006.035915. [DOI] [PMC free article] [PubMed] [Google Scholar]
- 22.Razi E, Moosavi GA. Comparison of arterial and venous blood gases analysis in patients with exacerbation of chronic obstructive pulmonary disease. Saudi Med J. 2007;28(6):862–5. [PubMed] [Google Scholar]
- 23.Honarmand A, Safavi M. Prediction of arterial blood gas values from arterialized earlobe blood gas values in patients treated with mechanical ventilation. Indian J Crit Care Med. 2008;12(3):96–101. doi: 10.4103/0972-5229.43677. [DOI] [PMC free article] [PubMed] [Google Scholar]


