

Abstract
Background
Determining the temporal variations and seasonal pattern of diseases and forecasting their incidence can help in promoting disease control and management programs. This study was performed to determine the seasonal variation of tuberculosis and forecast its incidence until the year 2015 in one of the northern provinces of Iran.
Materials and Methods
A longitudinal time series study was conducted. The study interval was from March 2001 to March 2011. The sum of daily registered cases in each month created 132 time points. The Box-Jenkins methods were used for determining the model. The best model was selected by analyzing the residuals and calculating the AIC and BIC.
Results
A total of 3,313 patients were diagnosed and recorded during this time. The highest number of cases was registered in May and the difference in monthly incidence of tuberculosis was significant (P=0.007). The incidence of tuberculosis was higher in spring and summer than winter (P=0.04). According to the best model which was SARIMA (0, 1, 1)(0, 1, 1)12 , the average incidence of tuberculosis in 2015 is estimated to be 12 in 100,000 persons per year.
Conclusion
The results of this study showed that in the north of Iran the incidence of tuberculosis has a cyclic pattern and the maximum incidence is in spring (May). Also, the trend of tuberculosis incidence is increasing and needs attention.
Keywords: Tuberculosis, Seasonality, Forecasting, Temporal variation
INTRODUCTION
Tuberculosis is an infectious disease caused by the Mycobacterium tuberculosis and transmitted by airborne particles from person to person. Although all deaths from tuberculosis are preventable, about 26% of the preventable adult deaths in developing countries are attributed to this disease (1–3).
The range of tuberculosis incidence in different countries is variable. For example, its incidence in Africa, UK, Spain and America is 365, 5, 21 and 4.5 cases in 100,000 persons, per year, respectively. The incidence rate of tuberculosis in Sistan and Bluchestan (Southeast), Kerman (Southeast), Golestan (North), Mazandaran (North) and nationwide in Iran is 73.5, 17.67, 44.8, 9.5 and 13.7 in 100,000 people per year, respectively (1, 4, 5).
Determining the temporal and seasonal pattern of tuberculosis incidence and forecasting its incidence is useful. By determining the pattern of incidence, the scope of health problems in the future and the range of effective health programs needed for proper and more efficient use of the available resources can be planned (6).
Season and climate change may have an effect on the mechanism of transmission and diagnosis of tuberculosis through different pathways. Weather can be effective in tuberculosis transmission through increasing the time people spend indoors due to rain, snow or low temperatures. Also, there is a possibility that in specific time periods and due to limited access to medical services the number of registered cases decreases. Other factors related to season such as metabolism and type of diet may also affect the incidence of tuberculosis. Therefore, it may be likely that the incidence of tuberculosis is related to seasonal changes and this can determine the time periods in which the disease diagnosis and registration are expected to be higher (7–9).
The seasonal pattern of tuberculosis has been evaluated in many studies and some of them have been mentioned here (6, 8–15). For example in South Africa the incidence of TB was the highest in late winter and early spring (14); in UK (8) and Hong Kong (11) it was the highest in summer, in Spain (9) and Japan (15) it was the highest in summer and autumn, and in Taiwan (16) the peak of disease incidence was in late spring and early summer.
According to the results of different studies it does seem that the seasonal pattern of tuberculosis around the world is not uniform. Even in different areas of a country with various climates, the seasonal pattern of tuberculosis might be different; also, the seasonal pattern in one geographical area during different time intervals might be different (9, 17).
In this study, we evaluate the temporal variation in tuberculosis diagnosis in Mazandaran province and forecast the incidence and patterns of tuberculosis by the year 2015.
MATERIALS AND METHODS
This longitudinal time series study evaluated the data from the north of Iran (Mazandaran Province). The population of this province according to the 2011 census is 3,028,923 persons, 50.1% are males and 55% live in urban areas (18). The climate of this part of Iran is temperate and humid. This study evaluated the diagnosed tuberculosis cases from March 22, 2001 to March 21, 2011.
The source of data was from the tuberculosis surveillance program which is conducted under the supervision of the Deputy of Health at the Iranian Ministry of Health and Medical Education. Eleven years data about the incidence of tuberculosis were inquired from the Disease Prevention and Control Unit of the Deputy of Health at the Mazandaran and Babol Universities of Medical Sciences. All identifying information was removed from the data.
The time unit in this study was month, and the cases were counted per month. The length of the study was 11 years and 132 time points were used. Spring was defined as March 21 to June 21, summer from June 22 to September 22, autumn from September 23 to December 21 and winter from December 22 to March 20.
In order to see the changes in tuberculosis diagnosis, in the first step the time series graphs were created. The stationary or non stationary of the mean and variance for determining the series was evaluated. Then ACF (autocorrelation function) and PACF (partial autocorrelation function) graphs were drawn.
In order to determine the best model, Box-Jenkins methods were used. Therefore, three steps including determining a probable model, calculating the model parameters (fitness of the model) and evaluating the appropriateness of the model were performed and eventually the most appropriate model was used for forecasting the number of cases in the future.
In order to determine the appropriateness of the model, residuals were evaluated and the AIC (Akaike information criterion) and BIC (Bayesian information criterion) were calculated and the model with the least amount of these parameters was used for prediction. The autocorrelations, differences and moving averages were shown as SARIMA(p,d,q)(P,D,Q)s. The (p, d, q) is non seasonal, the (P, D, Q) is seasonal and s shows the length of seasonal periodicity.
In order to show the effect of gender, age and place of residence, ANOVA was performed and the mean age was compared between men/women and urban/rural populations. In order to estimate the population during the years under study and to determine the incidence of tuberculosis in 100,000 persons, the results from the 2006 and 2011 census and by applying a populate growth rate of 1.12 for the years between 2001 and 2006 and a population growth rate of 0.72 between 2007 and 2015 were used.
RESULTS
During the time of the study, 3,313 tuberculosis cases were diagnosed among which 52.8% were males. The mean age of patients was 47.2±2.12 yrs. and the mean age of men and women was 48.2±20.9 and 46.1±21.5, respectively; the results of the independent t-test showed this difference to be significant (P=0.005). The average incidence of tuberculosis in males and females was 9.5 and 8.7 in 100,000 people per year, respectively. Also, 56% of the patients (1,867) were residing in urban areas. The average incidence of tuberculosis in the urban population was 9.4 in 100,000 people and in the rural population 8.8 in 100,000 people per year.
The highest average incidence was in May (31.4±6.3), July (30.0±6.1), August (27.2±7.8), June (26.9±7.8) and March (26.2±6.3), respectively and the lowest incidence was in February (20.9±5.5), January (21.4±6.4) and September (22.9±7.4), respectively; these differences were significant (F=2.52, p=0.007). According to Figure 1, the maximum number of male, female and total patients in the population during these 11 years was 172, 173 and 345 people per month, respectively which were diagnosed and registered in May. The maximum incidence of disease in urban and rural populations was 192 and 153 people, respectively and were again registered in May (Figure 1, 2).
Figure 1.

Aggregated monthly tuberculosis count by gender
Figure 2.
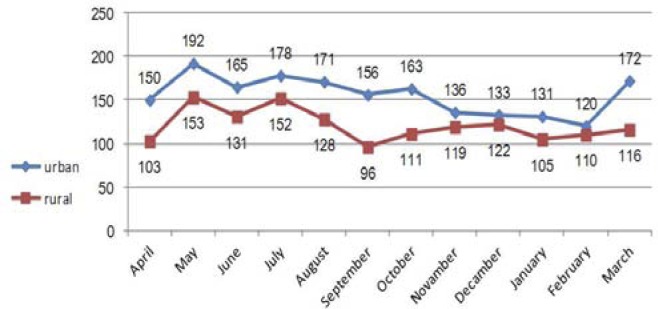
Aggregated monthly tuberculosis count by place of residence
Table 1 shows that the mean incidence of tuberculosis in both females and males, in urban and rural populations was higher in spring and summer than autumn and winter. According to the post hoc tests, the level of significance between total incidences in spring and winter was 0.02 and between summer and winter was 0.03.
Table 1.
Seasonal incidence of tuberculosis by gender and place of residence.
| Variables | Spring | Summer | Autumn | Winter | ANOVA | ||||||
|---|---|---|---|---|---|---|---|---|---|---|---|
|
| |||||||||||
| Mean | SD | Mean | SD | Mean | SD | Mean | SD | F | P | ||
| Gender | Male | 14.3 | 4.8 | 14.2 | 3.9 | 12.3 | 4.9 | 12.1 | 3.5 | 2.3 | 0.07 |
| Female | 12.8 | 4.1 | 12.5 | 5.2 | 11.4 | 4.03 | 10.7 | 4.6 | 1.5 | 0.2 | |
| Residence | Urban | 15.4 | 4.8 | 15.3 | 5.2 | 13.1 | 6 | 12.8 | 4.7 | 2.3 | 0.08 |
| Rural | 11.7 | 4.5 | 11.4 | 4.5 | 10.8 | 3.1 | 10.03 | 3.3 | 1.2 | 0.3 | |
| Total | 27.1 | 7.4 | 26.7 | 7.5 | 23.8 | 7.2 | 22.8 | 6.3 | 2.9 | 0.04 | |
The Bartlett test showed that the difference between variances was not significant (p=0.9). The time series, ACF and PACF graphs showed that the data had a seasonal pattern. Differences were calculated for eliminating non stationary in the means once and also once for eliminating the seasonal effect. The time series used in this study had an average of 25.1 cases of tuberculosis in each month and the standard deviation was 7.3.
Considering the fact that the time series after one difference and one seasonal difference became stable for fitting the Box-Jenkins model, the amount of d and D in the model was set as one. Also, by using the ACF, PACF and the result of the t-test for evaluating the difference of the estimated parameter from zero and according to the parameters(AIC and BIC) for determining the best fit, the final and best fit model for the time series was SARIMA(0,1,1)(0,1,1)(12)(Table 2). Using this model, forecasting for 48 months (4years) from March 2012 to March 2015 was done. From the 84th month to the 132th month the suggested model was compared with actual data and from the 133rd to the 180th month the forecasted data for monthly incidence of tuberculosis was predicted. Also, according to the methods described, the incidence of tuberculosis in 100,000 people was calculated and the rate in 2015 was estimated to be 12 in 100,000 people per year.
Table 2.
Significance of the parameters in the proposed models and the goodness of fit for each model.
| Model type | Lag | Coefficient | SE. Coef. | T | P | AIC | BIC | |
|---|---|---|---|---|---|---|---|---|
| SARIMA (1,1,1)(1,1,1) 12 | AR | 1 | 0.075 | 0.115 | 0.65 | 0.5 | 12.6037 | 3.6037 |
| SAR | 12 | -0.072 | 0.119 | -0.6 | 0.5 | |||
| MR | 1 | 0.829 | 0.06 | 12.9 | 0.0001 | |||
| SMA | 12 | 0.862 | 0.09 | 8.9 | 0.0001 | |||
| Constant | - | 0.011 | 0.02 | 0.57 | 0.57 | |||
| SARIMA (0,1,1)(0,1,1) 12 | MA | 1 | 0.79 | 0.05 | 14.5 | 0.0001 | 8.7022 | 3.7022 |
| AMA | 12 | 0.86 | 0.07 | 10.9 | 0.0001 | |||
| Constant | - | 0.008 | 0.03 | 0.31 | 0.7 |
DISCUSSION
The results showed that in the north of Iran (Mazandaran Province) the maximum number of tuberculosis patients diagnosed was in the second month of spring (May), followed by June and July. The minimum number of cases was in February. The same seasonal pattern was seen in males and females, and in urban and rural populations. The difference in the number of diagnosed cases among men and women was the highest in November. Also, the peak seen in March among the urban population was considerable in comparison to the rural population. The best choice for presentation of time series data was SARIMA model (0,1,1)(0,1,1). According to the forecast, the incidence of disease will slightly increase and reach 12 cases in 100,000 people per year in 2015.
In the present study, due to the cyclic pattern of tuberculosis incidence, Box-Jenkins SARIMA model was suitable for prediction. The seasonal ARIMA or SARIMA model is an expanded form of ARIMA, which allows for seasonal factors to be reflected (19). In a study, Permanasari et al. investigated the performance of six different forecasting methods, including linear regression, moving average, decomposition, Holt-Winter's, ARIMA, and artificial neural network (ANN) for monthly tuberculosis data forecasting and showed that the ARIMA model was the most appropriate model (19).
In this study, the highest number of diagnosed and registered cases of tuberculosis was in spring and summer. There was also a slight increase in late winter. In other countries, the peak of tuberculosis incidence in England (8) and Hong Kong (11) was in summer, in Taiwan (16) and Ireland (17) was in spring and summer, in America (20) was in spring (March) and in Mongolia (7) it was in spring (with a peak in April); the least number was in December and September. The peak of tuberculosis incidence in Japan as in Yamamoto et al's study (15) was in summer, in Nagayama et al's study (12) was in spring and summer, in Spain in Luqureo et al's study (13) it was in late winter and spring, in Rios et al's study (9) it was in summer and autumn, in South Africa in Fares et al's study (17) it was in spring and summer and in Schaaf et al's (14) study it was in spring. Also, in the north of India (10) the peak of tuberculosis was in spring and summer (maximum in April and June and minimum in October and December), but in the south of India (10) a seasonal pattern was not seen. In most studies the peak was seen in spring and summer which was in line with our study.
In our study, the seasonal pattern among men and women was similar to the observed general pattern. We did not find any other similar study for comparison. Also, we did not have any proper explanation for the slight difference observed among men and women in November.
In comparing the seasonal trend of tuberculosis among the urban and rural populations, the late winter peak was different in the two regions and this peak was more considerable in the urban areas. A similar study in this regard for comparison was not found. Based on our knowledge about the dominant climate in this region, this phenomenon can be explained by the fact that urban areas in this province enjoy spring weather from the beginning of March; however during this time in the rural areas of Mazandaran due to mountainous, snowy and cold climate people have limited access to medical services and therefore rate of diagnosis and registration may decrease.
The decrease in the number of registered cases in April is more likely due to the Iranian New Year holidays and the fact that in about half of the working days in this month the health centers are closed or half closed. Moreover, the chronic nature of the disease and the fact that patients can tolerate the disease for some time before visiting the health centers, may probably lead to delays in the registration of the disease, and this may lead to more cases being registered in May.
Explaining the reason for the seasonal pattern of tuberculosis is not easy. There are hypotheses about the transmission routes of tuberculosis. One of the hypotheses is that due to cold weather and living in confined spaces, transmission of the disease occurs more frequently in winter and eventually after passing the latency period and the presentation of symptoms, diagnosis of the disease happens to be in spring (21). Rios et al. (9) believe that acquiring tuberculosis in winter and spring is due to recurrent respiratory infections, influenza, immunodeficiency and also living in confined spaces, and after passing the pre-clinical stage the diagnosis of tuberculosis occurs in spring. Yamamoto et al. believe that the probable reason for the high incidence of the disease in summer is weakness of the immune system due to low vitamin D production in winter and its exacerbation in spring, the latency time of 1 to 4 months and registration of the cases in summer (15). Leung et al, in Hong Kong showed that decease in sunlight and therefore decrease in vitamin D significantly increases the incidence of tuberculosis with positive smear and sputum culture (11). The role of vitamin D has also been confirmed in several other studies (22–25). Also, in some studies it has been mentioned that other climate factors such as rainfall and humidity and factors like working load, religious and traditional ceremonies can also influence the time of disease peak (26, 27).
In the present study according to the prediction done by the Box-Jenkins models, the incidence of tuberculosis had an upward trend. A similar study in Spain with mathematical modeling of the registered cases of tuberculosis from 1971 to 1996 predicted the pattern of tuberculosis incidence in 1997 and the fitted model showed an increase in TB incidence (9). Because of the special conditions including the emergence of drug resistant tuberculosis, the prevalence of HIV/AIDS and immunosuppressive diseases that increase the incidence of tuberculosis, it does seem that control and decrease in the incidence of tuberculosis and eventually its eradication by 2050 will be difficult to achieve.
This study had limitations including the fact that the role of rainfall, humidity and dust with regard to the incidence of this disease were not studied. However, due to the similar climate of most areas in this province which is limited from the south to mountains and from the north to the Caspian Sea, and the fact that these factors change with season, we can conclude that these variables have already been considered.
The results of this study show that in the north of Iran there are seasonal changes in the diagnosis and registration of tuberculosis and the highest diagnosis and registration occurs from late winter to mid-summer. Using the selected model, we forecasted that the trend of tuberculosis incidence will increase after a period of decrease and this phenomenon is logical considering the increased prevalence of HIV/AIDS, diabetes, immunosuppressive diseases, cancers, addiction and drug resistance.
We suggest that in order to promote the quality of the tuberculosis control programs and minimize delayed diagnosis and treatment, initiatives have to be set for earlier detection and evaluation of suspicious subjects. Also, more educational programs about promoting personal hygiene especially in winter (when the risk of disease transmission is high) should be provided.
Acknowledgment
The authors wish to thank the personnel of the Deputy of Health of the Mazandaran and Babol Universities of Medical Sciences who cooperated in conduction of this study.
Conflict of interest
Authors declare no conflict of interest.
REFERENCES
- 1.Nasehi M, Moosazadeh M, Amiresmaeili M, Parsaee M, Nezammahalleh A. The Epidemiology of Factors Associated with Screening and Treatment Outcomes of Patients with Smear Positive Pulmonary Tuberculosis: A Population-Based Study. J Mazand Univ Med Sci. 2012;22:9–18. [Google Scholar]
- 2.Madico G, Gilman RH, Checkley W, Cabrera L, Kohlstadt I, Kacena K, et al. Community infection ratio as an indicator for tuberculosis control. Lancet. 1995;345(8947):416–9. doi: 10.1016/s0140-6736(95)90401-8. [DOI] [PubMed] [Google Scholar]
- 3.Morrison J, Pai M, Hopewell PC. Tuberculosis and latent tuberculosis infection in close contacts of people with pulmonary tuberculosis in low-income and middle-income countries: a systematic review and meta-analysis. Lancet Infect Dis. 2008;8(6):359–68. doi: 10.1016/S1473-3099(08)70071-9. [DOI] [PubMed] [Google Scholar]
- 4.Moosazadeh M, Khanjani N. The Existing Problems in the Tuberculosis Control Program of Iran: A Qualitative Study. Journal of qualitative Research in Health Sciences. 2012;1(3):189–201. [Google Scholar]
- 5.Fallah Khoshghalb S, Khanjani N, Samerehfekri M. Effects of climate on incidence of tuberculosis. Fifteenth National Conference on Environmental Health; Iran: Guilan. 2012. Nov, [Google Scholar]
- 6.Akhtar S, Mohammad HG. Seasonality in pulmonary tuberculosis among migrant workers entering Kuwait. BMC Infect Dis. 2008;8:3. doi: 10.1186/1471-2334-8-3. [DOI] [PMC free article] [PubMed] [Google Scholar]
- 7.Naranbat N, Nymadawa P, Schopfer K, Rieder HL. Seasonality of tuberculosis in an Eastern-Asian country with an extreme continental climate. Eur Respir J. 2009;34(4):921–5. doi: 10.1183/09031936.00035309. [DOI] [PubMed] [Google Scholar]
- 8.Douglas AS, Strachan DP, Maxwell JD. Seasonality of tuberculosis: the reverse of other respiratory diseases in the UK. Thorax. 1996;51(9):944–6. doi: 10.1136/thx.51.9.944. [DOI] [PMC free article] [PubMed] [Google Scholar]
- 9.Ríos M, García JM, Sánchez JA, Pérez D. A statistical analysis of the seasonality in pulmonary tuberculosis. Eur J Epidemiol. 2000;16(5):483–8. doi: 10.1023/a:1007653329972. [DOI] [PubMed] [Google Scholar]
- 10.Thorpe LE, Frieden TR, Laserson KF, Wells C, Khatri GR. Seasonality of tuberculosis in India: is it real and what does it tell us? Lancet. 2004;364(9445):1613–4. doi: 10.1016/S0140-6736(04)17316-9. [DOI] [PubMed] [Google Scholar]
- 11.Leung CC, Yew WW, Chan TY, Tam CM, Chan CY, Chan CK, et al. Seasonal pattern of tuberculosis in Hong Kong. Int J Epidemiol. 2005;34(4):924–30. doi: 10.1093/ije/dyi080. [DOI] [PubMed] [Google Scholar]
- 12.Nagayama N, Ohmori M. Seasonality in various forms of tuberculosis. Int J Tuberc Lung Dis. 2006;10(10):1117–22. [PubMed] [Google Scholar]
- 13.Luquero FJ, Sanchez-Padilla E, Simon-Soria F, Eiros JM, Golub JE. Trend and seasonality of tuberculosis in Spain, 1996-2004. Int J Tuberc Lung Dis. 2008;12(2):221–4. [PubMed] [Google Scholar]
- 14.Schaaf HS, Nel ED, Beyers N, Gie RP, Scott F, Donald PR. A decade of experience with Mycobacterium tuberculosis culture from children: a seasonal influence on incidence of childhood tuberculosis. Tuber Lung Dis. 1996;77(1):43–6. doi: 10.1016/s0962-8479(96)90074-x. [DOI] [PubMed] [Google Scholar]
- 15.Yamamoto S, Shimizu A, Kuchimura K, Ohmori M, M. A Seasonal variation in the incidence of pulmonary tuberculosis among the eldery in the Kanto area and its metrological factors. JPN J Biometeor. 2003;40(2):83–92. [Google Scholar]
- 16.Liao CM, Hsieh NH, Huang TL, Cheng YH, Lin YJ, Chio CP, et al. Assessing trends and predictors of tuberculosis in Taiwan. BMC Public Health. 2012;12:29. doi: 10.1186/1471-2458-12-29. [DOI] [PMC free article] [PubMed] [Google Scholar]
- 17.Fares A. Seasonality of tuberculosis. J Glob Infect Dis. 2011;3(1):46–55. doi: 10.4103/0974-777X.77296. [DOI] [PMC free article] [PubMed] [Google Scholar]
- 18.Statistical Center of Iran. Available: http://www.amar.org.ir.
- 19.Permanasari AE, Rambli DR, Dominic PD. Performance of univariate forecasting on seasonal diseases: the case of tuberculosis. Adv Exp Med Biol. 2011;696:171–9. doi: 10.1007/978-1-4419-7046-6_17. [DOI] [PubMed] [Google Scholar]
- 20.Willis MD, Winston CA, Heilig CM, Cain KP, Walter ND, Mac Kenzie WR. Seasonality of tuberculosis in the United States, 1993-2008. Clin Infect Dis. 2012;54(11):1553–60. doi: 10.1093/cid/cis235. [DOI] [PMC free article] [PubMed] [Google Scholar]
- 21.Taghizadeh Asl R, Mohammad K, Majdzadeh R. Seasonality pattern of Tuberculosis in Iran. Journal of School of Public Health and Institute of Public Health Research. 2005;3(2):1–9. [Google Scholar]
- 22.Douglas AS, Ali S, Bakhshi SS. Does vitamin D deficiency account for ethnic differences in tuberculosis seasonality in the UK? Ethn Health. 1998;3(4):247–53. doi: 10.1080/13557858.1998.9961867. [DOI] [PubMed] [Google Scholar]
- 23.Nnoaham KE, Clarke A. Low serum vitamin D levels and tuberculosis: a systematic review and meta-analysis. Int J Epidemiol. 2008;37(1):113–9. doi: 10.1093/ije/dym247. [DOI] [PubMed] [Google Scholar]
- 24.Roth DE, Soto G, Arenas F, Bautista CT, Ortiz J, Rodriguez R, et al. Association between vitamin D receptor gene polymorphisms and response to treatment of pulmonary tuberculosis. J Infect Dis. 2004;190(5):920–7. doi: 10.1086/423212. [DOI] [PubMed] [Google Scholar]
- 25.Martineau AR, Honecker FU, Wilkinson RJ, Griffiths CJ. Vitamin D in the treatment of pulmonary tuberculosis. J Steroid Biochem Mol Biol. 2007;103(3-5):793–8. doi: 10.1016/j.jsbmb.2006.12.052. [DOI] [PubMed] [Google Scholar]
- 26.Ane-Anyangwe IN, Akenji TN, Mbacham WF, Penlap VN, Titanji VP. Seasonal variation and prevalence of tuberculosis among health seekers in the South Western Cameroon. East Afr Med J. 2006;83(11):588–95. doi: 10.4314/eamj.v83i11.9474. [DOI] [PubMed] [Google Scholar]
- 27.Mabaera B, Naranbat N, Katamba A, Laticevschi D, Lauritsen JM, Rieder HL. Seasonal variation among tuberculosis suspects in four countries. Int Health. 2009;1(1):53–60. doi: 10.1016/j.inhe.2009.06.006. [DOI] [PubMed] [Google Scholar]