

Abstract
Twenty four fluorochemicals were quantified in landfill leachates recovered from municipal refuse using an analytical method based on solid-phase extraction, dispersive-carbon sorbent cleanup, and liquid chromatography/tandem mass spectrometry. The method was applied to six landfill leachates from four locations in the U.S. with as well as to a leachate generated by a laboratory bioreactor containing residential refuse. All seven leachates had the common characteristic that short-chain (C4-C7) carboxylates or sulfonates were greater in abundance than their respective longer-chain homologs (≥C8). Perfluoroalkyl carboxylates were the most abundant (67 ± 4% on a nanomolar (nM) basis) fluorochemicals measured in leachates; concentrations of individual carboxylates reaching levels up to 2,800 ng L−1. Perfluoroalkyl sulfonates were the next most abundant class (22 ± 2%) on a nM basis; their abundances in each of the seven leachates derived from municipal refuse were greater for the shorter-chain homologs (C4 and C6) compared to longer-chain homologs (C8 and C10). Perfluorobutane sulfonate concentrations were as high as 2,300 ng/L. Sulfonamide derivatives composed 8 ± 2.1% (nM basis) of the fluorochemicals in landfill leachates with methyl (C4 and C8) and ethyl (C8) sulfonamide acetic acids being the most abundant. Fluorotelomer sulfonates (6:2 and 8:2) composed 2.4 ± 1.3% (nM basis) of the fluorochemicals detected and were present in all leachates.
Keywords: fluorochemical, perfluorochemical, landfill leachate
1. Introduction
One of the primary applications of fluorochemicals is to coat solid materials such as paper and packaging (including food wrappers), textiles, and carpets (3M, 2001; Kissa, 2001). Of the perfluorooctane sulfonyl fluoride-based chemicals produced in the US in 2000, 36% was used on textile, leather, or carpet while 41% was used on paper and packaging. The use of fluorochemicals is now documented for food packaging and cookware (Sinclair et al., 2007; Begley et al., 2008), paper (Stadalius et al., 2006), textiles (Washburn et al., 2005), and carpeting (Washburn et al., 2005). Fluorochemicals in house dust (Strynar and Lindstrom, 2008; D'Hollander et al., 2010) and kitchen- and garden-derived refuse (Brandli et al., 2007) provide further evidence that fluorochemicals are associated with materials used in homes.
Municipal solid waste includes the aforementioned materials derived from residential, commercial, and institutional sources. In 2007, 54% of municipal solid waste was disposed of in landfills in the U.S. (U.S. Environmental Protection Agency, 2007). Municipal sewage sludge, which contains fluorochemicals (Higgins et al., 2005**********), is also landfilled (U.S. Environmental Protection Agency, 1999). Of the estimated 6.3 million Mg (metric ton) of municipal biosolids generated in the U.S. in 1998, an estimated 20% was disposed into landfills (U.S. Environmental Protection Agency, 1999). Landfills are anaerobic ecosystems (Christensen et al., 2001), and leachate is the term given to water that percolates through the refuse. Leachates are highly concentrated with organic contaminants, salts, and dissolved organic matter (Christensen et al., 2001; Kjeldsen et al., 2003).
Few studies document the association of fluorochemicals with solid wastes, in part, because of difficulties in handling such heterogeneous material. Of the six reports that document the concentrations of fluorochemicals in landfill leachate (3M, 2001; Kallenborn et al., 2004; Oliaei et al., 2006; Woldegiorgis et al., 2006; Bossi et al., 2008; Busch et al., 2010), only two include methodological details that permit replication of the methodology and actually report method recoveries (Bossi et al., 2008; Busch et al., 2010). In addition, only one report describes a method developed and validated specifically for the analysis of leachate (Busch et al., 2010). To date, data for up to only 12 fluorochemicals in leachate are available (Woldegiorgis et al., 2006; Busch et al., 2010). The existing dataset on fluorochemicals in landfill leachates is quite limited. While the study by Busch et al (Busch et al., 2010) reports data for 12 analytes in 22 leachates, most reports provide data on ≤12 analytes and for ≤6 leachates. The study described herein provides data for 24 fluorochemicals in 7 well characterized leachates.
Previous reports on fluorochemical concentrations in leachate indicate PFOS and PFOA concentrations ranging up to 82,000 ng L−1 in landfills that received wastes from fluorochemical manufacturing (3M, 2001; Oliaei et al., 2006). Other studies report concentrations similar to municipal wastewaters (e.g., tens to hundreds of ng L−1) (3M, 2001; Kallenborn et al., 2004; Bossi et al., 2008; Busch et al., 2010) or even up to hundreds of ng L−1 (Woldegiorgis et al., 2006). Of the two US municipal landfills studied, only three fluorochemicals were measured (3M, 2001), leaving a large gap in our understanding of the distribution of types and concentrations of fluorochemicals in US municipal landfill leachates.
The first objective of the present study was to modify existing analytical approaches based on liquid chromatography tandem mass spectrometry (LC-MS/MS) for the quantification of 24 fluorochemicals in four classes of fluorochemicals in landfill leachates. The second objective was to apply the developed methodology to a limited number of leachates including a laboratory bioreactor leachate and six leachates obtained from cells in landfills containing differently aged refuse.
2. Experimental
2.1 Standards and reagents
The standards and reagents used in this study are described in the Supplementary material.
2.2 Landfill and Laboratory Bioreactor Leachates
In 2006, six leachate samples were collected from four lined landfills prior to leachate treatment; the characteristics of each landfill and the respective cells sampled are listed in Table 1. Each site received primarily municipal solid waste, although all landfills received some non-municipal solid waste (e.g., industrial, construction, and demolition). One site (Site D) yielded samples from two different areas (cells) of the landfill that had been closed for several years (D2 and D3) and from one cell that remained open at the time of sample collection (D6). With the exception of Site B, all sites had been operated with leachate recirculation for some period. Leachate recirculation enhances anaerobic biological activity and results in higher in-situ moisture contents that could promote contaminant dissolution (Benson et al., 2007). For use during methods development, 5-L of leachate generated in a laboratory bioreactor was used. The leachate was generated from residential refuse that was decomposed in a ~210-L drum operated with leachate recirculation and incubated at 37°C. Based on methane generation, the refuse was well decomposed at the time of leachate sampling.
Table 1.
Site characteristics for leachate sampling sites.
| Site | Location | Collection Point | Mg refuse per day | Years of operation | Accepts biosolids | Leachate Recirculation | Average Annual Rainfall (cm) | Chloride (mg L−1) | Conductivity (mS cm−1) | Total Organic Carbon (mg L−1) |
|---|---|---|---|---|---|---|---|---|---|---|
| A | Gulf Coast | Tank – Enclosed AST | 2364 | 1998-active | Yes | Yes | 160 | 5200 | 12 | 22000 |
| B | Pacific Northwest | Sump (in cell goes to riser) | 1818 | 1996-active | Yes | No | 94 | 80 | 1.2 | 1030 |
| C | West Coast | Module D- Phase I- West Cell | 455 | 2003-active | Yes | Yes | 46 | 1330 | 4.8 | 950 |
| D-2 | Mid-Atlantic States | Area B, LDPE bailer | 236 | 1982–1988 | Yes | No longer | 107 | 730 | 3.9 | 93 |
| D-3 | Mid-Atlantic States | Area C, LDPE bailer | 300 | 1988–1993 | Yes | No longer | 107 | 290 | 3.1 | 63 |
| D-6 | Mid-Atlantic States | Area E, in line sample valves | 339 | 1999-active | Yes | Yes | 107 | 320 | 3.5 | 470 |
| E | Southeast | Laboratory bioreactor | N/A | 2006 | NA | Yes | NA | 1400 | 18 | 830 |
All samples were collected by grab methods involving either bailer, peristaltic pump, or collection from a tap. Leachates were collected in 125 mL polypropylene bottles from the landfills and shipped overnight on ice where they remained frozen until analysis. Trip blanks, consisting of deionized water in 125 mL polypropylene bottles, were sent along with each sampling kit. All leachates were analyzed for total organic carbon (TOC), chloride, and conductivity by an outside lab (CH2MHill, Corvallis, OR) using standard EPA methods 415.1, 300.0A (U.S. Environmental Protection Agency), and 120.1 (U.S. Environmental Protection Agency), respectively (Table 1).
2.3 Solid Phase Extraction
Leachate samples were thawed to room temperature and shaken; 5 mL aliquots were spiked with internal standards (2 ng each of 13CPFOA, 13CPFDA, and 18OPFOS and 10 ng of d5-EtFOSAA) prior to extraction. The internal standards used for each analyte are listed in Table S1 (Supplementary material).
Leachates, along with any suspended particulate matter, were extracted using Oasis HLB cartridges (200 mg, 6cc, Waters, Milford, MA) on a Supelco (Bellefonte, PA) vacuum manifold that was retro-fitted with Delrin valves (donated by Supelco) to replace the PTFE valves and O-rings. Prior to extraction, Oasis HLB cartridges were rinsed twice with 6 mL of 10% formic acid in isopropanol (v/v) to remove residual fluorochemicals, including PFOS and PFOA. The cartridges were then rinsed twice with 6 mL of 50:50 MeOH:H2O and subsequently conditioned with 12 mL of MeOH followed by 12 mL of H2O. Subsequent blank extractions conducted throughout the study indicated the absence of PFOS and PFOA above detection as a result of these pre-treatment steps.
Samples were extracted at a flow rate of 1 drop per s after which the cartridges containing sorbed analytes were removed from the manifold and centrifuged at 2,500 rpm (1,000 g) for 5 min to remove residual water. Note that no 20% MeOH wash step (Taniyasu et al., 2005) was employed after sample loading since this caused analyte loss (data not shown). Cartridges were then returned to the manifold and eluted with 1 mL of MeOH followed by two separate 0.75 mL fractions of MeOH; all three fractions were combined.
Extracts were cleaned up using a dispersive carbon sorbent (EnviCarb) as described in Powley et al. (2005). Briefly, a small amount (~20 mg) of 120/400 mesh EnviCarb (Supelco, Bellefonte, PA) was added to a micro centrifuge tube along with 50 μL of glacial acetic acid and 1 mL aliquot of leachate extract. The centrifuge tube was capped, vortexed for 30 s, and then centrifuged at 14,000 rpm (10,000 g) for 30 min. A 0.3 mL aliquot of this extract was removed, spiked with 60 pg of PFEES (used as the instrumental standard), and diluted with water to a total volume of 1.2 mL for LC-MS/MS analysis.
For quantification by standard addition, eight total aliquots of each leachate extract were prepared. Four of these aliquots were spiked only with internal standards; the remaining four aliquots were spiked with analyte-standards to produce a set of samples in which each analyte’s signal was increased respectively ~ 0.5, 1, 1.5, and 3 times that of the background signal. Linear regression was performed on each analyte’s corresponding eight data points, and the regression line’s intercept with the X-axis was interpreted as that compound’s average concentration in the unspiked aliquots. Uncertainty in this standard-addition background concentration was expressed as the X-intercept’s 95% confidence interval (CI).
2.4 Liquid Chromatography/Tandem Mass Spectrometry (LC/MS/MS)
Separations were performed on an Agilent 1100 HPLC system (Agilent, Palo Alto, CA). A 900 μL volume of sample was injected directly onto a 2.0 mm × 4.0 mm C18 Security Guard cartridge (Phenomenex, Torrence, CA) followed by a 150 × 2.1 mm Targa C18 column (Higgins Analytical, Mountain View, CA). The mobile phase system consisted of 2 mM ammonium acetate with 5% methanol (A) and methanol (B) at a temperature of 25 °C and a flow rate of 200 μL min−1. The initial mobile phase (10% A, 90% B) was held for 4 min and then ramped to 45% B over 6.5 min and held for two min. The mobile phase was then ramped to 90% B over one min and held until 18 min.
The HLPC was interfaced to a Quattro Micro tandem mass spectrometer (Waters, Milford, MA) through an electrospray ionization source operated in negative mode. Quantification of analytes was performed through multiple reaction monitoring with one transition monitored for each analyte. The transitions monitored are provided in Table S1 (Supplementary material)
Detailed experimental procedures that include the definition and use of blanks and the experiments conducted to determine method recovery, precision, and detection limits are described in the Supplementary material. Initial observations that led to the optimized analytical method are provided in the Supplementary material.
3. Results and Discussion
3.1 Whole Method Recovery, Precision, and Detection Limits
The peak shape and retention times for fluorochemicals extracted from leachate and analyzed by large volume injection (900 μL) LC/MS/MS can be seen in Figure 1. The double peak observed for PFOS is due to the presence of isomers. PFOS and other compounds with isomers (e.g., sulfonamides) were quantified using the entire peak area. Complete characterization of the isomeric profile of PFOS and other isomeric fluorochemical compounds in landfill leachate was an objective of this study.
Figure 1.

Chromatogram of fluorochemicals in leachate collected from Site B. The perfluoroalkyl carboxylates are on the left-hand side of the figure, and the perfluoroalkyl sulfonates and sulfonamides are on the right-hand side of the figure with the respective internal standards used. Detected peaks have been filled in.
Recoveries were lowest for the C4, C5, and C9-C14 perfluoroalkyl carboxylates and PFDS (Table 2), which is likely a result of not having internal standards that match these analytes. For the remaining analytes, whole method recoveries ranged from 54 ± 2% to 140 ± 12% (Table 2). The precision of the method, as indicated by relative standard deviation (RSD) was determined by replicate extractions (n=3) of a single leachate sample. RSDs ranged from 2 to 26% (Table 2). The estimated method detection limit determined for each analyte varied from 0.5 to 5.4 ng/L (Table 2).
Table 2.
Analytical precision indicated by relative standard deviation of replicate extractions of a single leachate sample; accuracy indicated by %-recovery ± 95% CI; and estimated method detection limit.a
| Analyte | Precision | Accuracy | EMDL |
|---|---|---|---|
|
| |||
| RSD | % recovery ± 95%CI (SD) | ng L−1 | |
| PFBA | 7 | 25 ± 5 (7) | 4.0 |
| PFPA | 15 | 39 ± 8 (11) | 2.4 |
| PFHxA | 4 | 64 ± 9 (12) | 2.2 |
| PFHpA | 5 | 110 ± 12 (26) | 1.4 |
| PFOA | 1 | 72 ± 16 (10) | 0.8 |
| PFNA | 8 | 120 ± 18 (26) | 1.2 |
| PFDA | 5 | 73 ± 7 (10) | 0.8 |
| PFUnDA | 21 | 44 ± 3 (4) | 1.3 |
| PFDoDA | 31 | 34 ± 6 (9) | 1.3 |
| PFTrDA | ND | 28 ± 7(10) | 2.5 |
| PFTDA | ND | 8 ± 3 (5) | 4.2 |
| FOUEA | 8 | 68 ± 3 (4) | 1.0 |
| PFBS | 4 | 54 ± 2(2) | 0.7 |
| PFHxS | 9 | 80 ± 3 (5) | 1.2 |
| PFOS | 7 | 69 ± 1 (4) | 1.8 |
| PFDS | 21 | 30 ± 2 (3) | 2.1 |
| 6:2 FtS | 17 | 74 ± 2 (3) | 3.9 |
| 8:2 FtS | 16 | 94 ± 7 (10) | 2.9 |
| MeFBSA | ND | 110 ± 12 (17) | 2.2 |
| MeFBSAA | 10 | 140 ± 12 (18) | 1.0 |
| FOSA | 5 | 110 ± 8 (12) | 0.5 |
| FOSAA | ND | 110 ± 8 (12) | 1.5 |
| Me-FOSAA | 9 | 71 ± 4 (6) | 5.0 |
| Et-FOSAA | 6 | 65 ± 3 (4) | 5.4 |
Based on internal standard quantification
3.2 Application to Municipal Landfill Leachates
Individual fluorochemical concentrations measured in the seven landfill leachates ranged from a few hundred ng/L to 2,800 ng/L (Table 3). In contrast, typical ranges in fluorochemical concentrations are 0.5 – 1,000 ng L−1 for municipal wastewaters (Schultz et al., 2006; Loganathan et al., 2007; Becker et al., 2008; Huset et al., 2008) and 0.1 – 150 ng L−1 for surface waters (Lange et al., 2007; McLachlan et al., 2007; Becker et al., 2008; Huset et al., 2008). Land-application of solid and liquid waste and point sources associated with fluorochemical manufacturing are thought to contribute to higher (1,200–34,000 ng L−1) surface water concentrations (Skutlarek et al., 2006; McLachlan et al., 2007; Konwick et al., 2008). Other systems that show fluorochemical concentrations in the thousands of ng L−1 to mg L−1 range are ground waters impacted by fire-fighting activity (Schultz et al., 2004; Tremoen, 2009).
Table 3.
Concentration (ng L−1 ± 95%CI) of fluorochemical analytes in leachate from 6 landfill leachates (A-D) and a laboratory bioreactor.
| Analyte | Site A | Site B | Site C | Site D-2 | Site D-3 | Site D-6 | Laboratory Bioreactor |
|---|---|---|---|---|---|---|---|
| PFBA | 1700 ± 63 | 170 ± 6 | 1400 ± 25 | 430 ± 34 | 250 ± 29 | 540 ± 48 | 63 ± 22 |
| PFPA | 1100 ± 170 | 120 ± 13 | 1500 ± 36 | 730 ± 36 | 500 ± 29 | 470 ± 34 | 460 ± 23 |
| PFHxA | 790 ± 50 | 270 ± 17 | 620 ± 14 | 360 ± 12 | 350 ± 21 | 430 ± 19 | 2200 ± 140 |
| PFHpA | 328 ± 21 | 100 ± 14 | 340 ± 15 | 170 ± 4.3 | 150 ± 10 | 170 ± 3.6 | 2800 ± 89 |
| PFOA | 490 ± 8 | 1000 ± 19 | 900 ± 10 | 380 ± 5.1 | 490 ± 31 | 720 ± 60 | 1100 ± 35 |
| PFNA | 23 ± 1.1 | 22 ± 4.1 | 28 ± 9.6 | 20 ± 2.1 | 19 ± 1.2 | 26 ± 3.1 | 140 ± 13 |
| PFDA | 15 ± 0.8 | 14 ± 1.9 | 23 ± 11 | 0.3 ± 0.8 | 11 ± 0.5 | 18 ± 1.4 | 64 ± 3.7 |
| PFUnDA | 0.4 ± 0.6 | 0 | 0.1 ± 0.3 | 0 | 9.5 ± 1.4 | 0.9 ± 2.5 | 0 |
| PFDoDA | 0.2 ± 0.7 | 6 ± 1.2 | 0.8 ± 0.4 | 0 | 0.7 ± 1.4 | 0.2 ± 0.7 | 8.7 ± 4.4 |
| PFTrDA | 0 | 0.4 ± 0.8 | 3 ± 1.7 | 0.2 ± 1.2 | 18 ± 2 | 0.7 ± 2.8 | 5 ± 10 |
| PFTDA | 0 | 1.2 ± 0.9 | 9 ± 6 | 2 ± 3 | 0.7 ± 1.7 | 13 ± 2.7 | 10 ± 20 |
| FOUEA | 1.5 ± 0.6 | 10 ± 1.2 | 0 | 1.1 ± 1.2 | 21 ± 2.2 | 3.2 ± 3 | 0 |
| PFBS | 750 ± 50 | 280 ± 13 | 810 ± 36 | 280 ± 12 | 390 ± 6.3 | 890 ± 100 | 2300 ± 130 |
| PFHxS | 700 ± 19 | 160 ± 8.2 | 430 ± 13 | 170 ± 7 | 200 ± 24 | 360 ± 110 | 120 ± 14 |
| PFOS | 160 ± 8.6 | 110 ± 7.5 | 97 ± 9.2 | 56 ± 2.5 | 91 ± 9.9 | 140 ± 8.9 | 104 ± 5 |
| PFDS | 5.3 ± 1.5 | 1.1 ± 0.7 | 0 | 0.8 ± 0.9 | 0 | 1.3 ± 1.2 | 16 ± 1.6 |
| 6:2 FtS | 280 ± 11 | 370 ± 20 | 280 ± 6.8 | 29 ± 2.6 | 56 ± 13 | 270 ± 67 | 260 ± 21 |
| 8:2 FtS | 30 ± 4 | 120 ± 12 | 70 ± 7.9 | 11 ± 1.6 | 26 ± 4.3 | 25 ± 1.8 | 210 ± 25 |
| MeFBSA | 1.9 ± 2.8 | 2.5 ± 1.7 | 3.2 ± 3.5 | 0 | 0.5 ± 1.6 | 2.4 ± 2.5 | 4.2 ± 4.7 |
| MeFBSAA | 440 ± 25 | 79 ± 11 | 440 ± 33 | 110 ± 12 | 58 ± 12 | 200 ± 14 | 810 ± 88 |
| FOSA | 1.3 ± 1.0 | 6.6 ± 0.2 | 0.2 ± 1.4 | 0 | 1.4 ± 1.5 | 0.5 ± 0.8 | 2.6 ± 1.9 |
| FOSAA | 0.7 ± 1.1 | 1.1 ±1.2 | 0.2 ± 1.5 | 0 | 0.9 ± 1.9 | 0 | 12 ± 1.6 |
| MeFOSAA | 110 ± 5 | 280 ± 14 | 290 ± 19 | 16 ± 0.4 | 23 ± 4.7 | 173 ± 7.1 | 43 ± 11 |
| EtFOSAA | 47 ± 5 | 480 ± 19 | 170 ± 24 | 38 ± 3.5 | 21 ± 0.7 | 140 ± 2.4 | 230 ± 11 |
ND = not detected
For purposes of comparing the relative abundance of the various fluorochemicals within four classes of fluorochemicals measured, ng L−1 concentrations were converted to nM so that when summed, the relative abundance of the fluorochemical classes could be compared (Figure 2).
Figure 2.
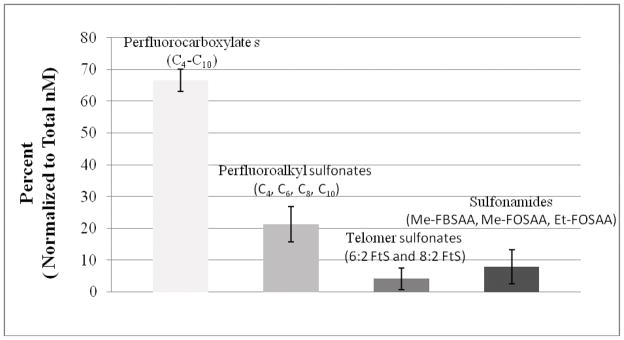
Relative abundance (nanomolar basis) of the four fluorochemical classes found in the seven landfill leachates. In order of abundance, they are perfluorocarboxylates, perfluoroalkyl sulfonates, sulfonamides and telomer sulfonates. Error bars are 95% confidence intervals.
3.2.1 Perfluoroalkyl carboxylates
Overall, on a nM basis, perfluoroalkyl carboxylates accounted for the majority (67±4%) of the fluorochemicals quantified in leachates (Figure 2). This finding is consistent with data for select US, Nordic, German, and Danish leachates (Kallenborn et al., 2004; Oliaei et al., 2006; Bossi et al., 2008; Busch et al., 2010) while others report greater perfluoroalkyl sulfonates concentrations than for carboxylates (3M, 2001; Bossi et al., 2008 ). Of the 14 individual (C4 to C14) carboxylate forms measured in the present study, the most abundant were C4-C10 with only infrequent detection of C11-C14 homologs above quantification limits (Table 3). Individual carboxylate concentrations (Table 3) were as high as 1,700 ng L−1 (PFBA) and 2,800 ng L−1 (PFHpA). Observed concentrations of perfluoroalkyl carboxylates are greater than or equal to those for leachates from landfills that did not receive fluorochemical manufacturing or related refuse (3M, 2001; Kallenborn et al., 2004; Woldegiorgis et al., 2006; Bossi et al., 2008). In contrast, leachates from landfill associated with the disposal of fluorochemical manufacturing wastes or refuse from industrial fluorochemical applications (textile, carpet, and paper production) have significantly higher perfluorocarboxylates concentrations ranging up to 48,000 ng L−1 (3M, 2001) to 82,000 ng L−1 (Oliaei et al., 2006).
The relative abundance of the shorter-chain carboxylates (≤C7) in six out of seven leachates is evident from the data set (Table 3). At the Pine Bend, MN landfill, which received sludge from a 3M fluorochemical manufacturing plant, leachate is characterized by greater ratios of PFOA to shorter-chain homologs (Oliaei et al., 2006); this finding could be a consequence of the commercial history of C8-based production of perfluoroalkyl carboxylates (Prevedouros et al., 2006). In treated leachate from German landfills (Busch et al., 2010), short chained carboxylates (PFBA and PFHxA) were the most abundant fluorochemical in 13 of 20 samples. We speculate that the dominance of C4-C7 perfluoroalkyl carboxylates over C8 and larger carboxylates in the municipal-waste derived in the present study is due to their preferential release from municipal solid refuse. Preferential release/leaching is consistent with estimates of the higher aqueous solubilities (Higgins and Luthy, 2007) and lower sediment:water partition coefficients (Higgins et al., 2005) of the shorter-chain homologs relative to the longer-chain homologs.
3.2.2 Perfluoroalkyl Sulfonates
Perfluoroalkyl sulfonates were the next most abundant class of fluorochemicals at 22±2% (Figure 2). Perfluoroalkyl sulfonate concentrations ranged from 16 to 2,300 ng L−1, which is higher than the typical concentrations observed for municipal wastewaters (Schultz et al., 2006; Sinclair and Kannan, 2006; Loganathan et al., 2007; Becker et al., 2008; Huset et al., 2008) or surface waters (Huset et al., 2008; Konwick et al., 2008). Concentrations of perfluoroalkyl sulfonates in the seven leachates tested were lower than for leachates from landfills that received fluorochemical manufacturing or industrial refuse (3M, 2001) but higher than those for landfills with no known or reported fluorochemical manufacturing or industrial refuse (3M, 2001; Kallenborn et al., 2004; Woldegiorgis et al., 2006; Bossi et al., 2008; Busch et al., 2010).
Of the four perfluoroalkyl sulfonate homologs quantified in the present study, PFBS was the most abundant with concentrations ranging from 280 to 2,300 ng L−1 (Table 3), which is consistent with study conducted in Germany (Busch et al., 2010). In contrast, PFOS (or PFHxS) was in greatest abundance for three out of four leachates impacted by fluorochemical manufacturing and industrial refuse (Oliaei et al., 2006) and in Nordic landfills receiving unspecified refuse (Kallenborn et al., 2004; Woldegiorgis et al., 2006). The dominance of PFBS over PFOS in landfill leachates is counter to the known historical production of C8-based chemicals (Paul et al., 2009). One possibility is that C4-based chemistry was present in the marketplace prior to the post-2002 announced change in C4-based formulations (Oliaei et al., 2006). The production of C4-based fluorochemicals prior to 2002 is substantiated by the quantification of perfluorobutanoate (PFBS) in groundwater near fire-training sites on military bases (Schultz et al., 2004). At Site D however, leachate from the new landfill cell (Site D6) would have been mixed with leachate from 1980s’ refuse in a tank prior to recirculation. Thus, the presence of PFBS may have originated from post-2002 leachate recirculated to Sites D2 and D3. It should be noted in this context that PFBS concentrations were highest in the laboratory system where all of the refuse was collected in 2006.
3.2.3 Perfluoroalkyl Sulfonamides
Sulfonamides made up the third most abundant class of fluorochemicals at 8±2.1% (Figure 2). Six individual sulfonamides were investigated, but Me-FBSA, FOSA, and FOSAA were detected infrequently and at concentrations near their detection limits (Table 3). FOSA was reported in several other landfill leachates (3M, 2001; Kallenborn et al., 2004; Oliaei et al., 2006; Busch et al., 2010).
The most abundant sulfonamide was the C4-based Me-FBSAA even though the historical production of sulfonamides is C8-based (Paul et al., 2009). Based on the biodegradation of the structurally analogous Et-FOSAA (Rhoads et al., 2008), Me-FBSAA is likely a precursor to PFBS resulting from degradation of methyl perfluorobutane sulfonamidoethanol (Me-FBSE); Me-FBSE was introduced as a replacement for longer-chained methyl perfluorooctane sulfonamide ethanol and Et-FOSE and is used in both paper and textile applications (D'Eon et al., 2006). Et-FOSAA, Me-FOSAA, and Me-FBSAA were the next most dominant sulfonamides forms detected in leachates. Et-FOSAA and MeFOSAA and are biodegradation products respectively of Et-FOSE (Rhoads et al., 2008) and Me-FOSE (Lange, 2000), which were associated with paper treatments and carpets respectively (Company, 1999). The concentration of Me-FOSAA was highest at Site C, which opened after the phase out of PFOS in 2002. However, since carpets typically last for more than five years, the disposal of carpets purchased and treated prior to 2002 offers one explanation for high concentrations of Me-FOSAA at a landfill that opened after 2002.
3.2.4 Fluorotelomer Sulfonates (6:2 and 8:2 FtS)
On a nM basis, fluorotelomer sulfonates were the fourth most abundant class of fluorochemicals (2.4 ± 1.3%) in landfill leachates (Figure 2). The 6:2 FtS and 8:2 FtS occurred in all leachates at concentrations ranging from 20 to 370 ng L−1 (Table 3); these levels are substantially lower than those found in groundwater impacted by firefighting activities, which have been measured up to 14,600,000 ng L−1 (14.6 mg L−1) (Schultz et al., 2004; Tremoen, 2009). Busch et al.(2010) reported 6:2 FtS in six of twenty German landfills in a similar range (9 – 82 ng L−1). More sampling would be needed to determine if the higher frequency of 6:2 FtS detection in US samples relative to German samples reflects a difference in 6:2 FtS sources such as consumer products.
3.2.5 Limitations and Implications
It is difficult to relate concentrations of specific fluorochemicals to landfill characteristics due to the multitude of factors that influence contaminant concentrations. While higher moisture in the landfills that recirculate leachate would potentially enhance dissolution/leaching, higher moisture levels would also dilute contaminants. Furthermore, the characteristics of the refuse present in each landfill are undoubtedly different, although the significance of these differences is unknown. The laboratory leachate differed from the field samples in several respects that make direct comparisons inappropriate. First, biodegradation rates in the laboratory system were potentially enhanced as the substrate was shredded and leachate was recirculated more intensely than at field-scale; however, the role that biodegradation plays is difficult to assess as there is little information on the anaerobic degradation of fluorochemicals. Second, the laboratory system contained residential refuse only, whereas actual landfills receive refuse from many sources. No attempt was made to collect different time points from the same landfill cell because the composition of the waste in the landfill and landfill leachate are not expected to change much over a period of days to weeks (Kjeldsen et al., 2003) and a monitoring program was not one of the study’s objectives.
4. Conclusions
A method validated for the determination of perfluoroalkyl carboxylates, perfluoroalkyl sulfonates, perfluoroalkyl sulfonamides and fluorotelomer sulfonates in landfill leachates has been developed and demonstrated. The method was validated using a complex leachate sample prepared in a laboratory bioreactor and concentrations of fluorochemicals were determined using standard additions where matrix effects (ionization enhancement and reduction) were found to affect quantification. Recoveries ranged from 54–140%, and detection limits were <10 ng/L after a direct injection of the extracts. The method was applied to leachate samples collected from municipal landfills from around the United States. All classes of fluorochemicals were detected at all sites with concentrations comparable to some of the highest reported for aqueous samples.
The characterization of the concentration and distribution of fluorochemicals in landfill leachates is important because landfills are reservoirs of solid waste (many fluorochemicals were applied to solids), receive wastewater treatment plant sludge (which contains fluorochemicals), discharge leachate to wastewater treatment plants (which do not always effectively remove fluorochemicals), and in the case of unlined landfills, have the potential to impact local groundwater, including drinking water. While the production of fluorochemicals has changed to control their release or to change the chemicals manufactured, landfills have the potential to continue to release fluorochemicals well into the future.
Supplementary Material
Research Highlights.
Twenty four fluorochemicals from four different classes of fluorochemicals were quantified in US landfill leachates. The distribution of fluorochemicals in leachate was dominated by short chained analytes including PFBA and PFBS. Perfluoroalkyl carboxylates were the most abundant class of fluorochemicals measured in leachate.
Acknowledgments
The authors thank the landfill site managers for sample collection and 3M for the donation of authentic standards. In addition, they are grateful for financial support from DuPont (unrestricted gift) and the Mass Spectrometry Facilities and Services Core of the Environmental Health Sciences Center, Oregon State University, grant number P30 ES00210 (NIEHS).
Role of the Funding Source
Financial support from DuPont in the form of an unrestricted gift supported some of this research. There was no oversight or role played by DuPont in any portion of the study design or in the collection, analysis and interpretation of data, nor in the writing of this paper and the decision to submit it for publication.
Appendix A. Supplementary material
Supplementary data associated with this article can be found in Appendix A.
Footnotes
Publisher's Disclaimer: This is a PDF file of an unedited manuscript that has been accepted for publication. As a service to our customers we are providing this early version of the manuscript. The manuscript will undergo copyediting, typesetting, and review of the resulting proof before it is published in its final citable form. Please note that during the production process errors may be discovered which could affect the content, and all legal disclaimers that apply to the journal pertain.
References
- 3M. Multi-City Study: Water, Sludge, Sediment, POTW Effluent and Landfill Leachate Samples. 3M Laboratories; St. Paul: 2001. p. 12. [Google Scholar]
- Becker AM, Gerstmann S, Frank H. Perfluorooctane surfactants in wastewaters, the major source of river pollution. Chemosphere. 2008;72:115–121. doi: 10.1016/j.chemosphere.2008.01.009. [DOI] [PubMed] [Google Scholar]
- Begley TH, Hsu W, Noonan G, Diachenko G. Migration of fluorochemical paper additives from food-contact paper into foods and food simulants. Food Addit Contam. 2008;25:384–390. doi: 10.1080/02652030701513784. [DOI] [PubMed] [Google Scholar]
- Benson CH, Barlaz MA, Lane DT, Rawe J. Bioreactor landfills in North America: Review of the state-of-the practice. Waste Manage. 2007;27:13–29. doi: 10.1016/j.wasman.2006.04.005. [DOI] [PubMed] [Google Scholar]
- Bossi R, Strand J, Sortkjaer O, Larsen MM. Perfluoroalkyl compounds in Danish wastewater treatment plants and aquatic environments. Environ Int. 2008;34:443–450. doi: 10.1016/j.envint.2007.10.002. [DOI] [PubMed] [Google Scholar]
- Brandli RC, Kupper T, Bucheli TD, Zennegg M, Huber S, Ortelli D, Muller J, Schaffner C, Iozza S, Schmid P, Berger U, Edder P, Oehme M, Stadelmann FX, Tarradellas J. Organic pollutants in compost and digestate. Part 2 Polychlorinated dibenzo-p-dioxins, and -furans, dioxin-like polychlorinated biphenyls, brominated flame retardants, perfluorinated alkyl substances, pesticides, and other compounds. J Environ Monit. 2007;9:465–472. doi: 10.1039/b617103f. [DOI] [PubMed] [Google Scholar]
- Busch J, Ahrens L, Sturm R, Ebinghaus R. Polyfluoroalkyl compounds in landfill leachates. Environ Pollut. 2010;158:1467–1471. doi: 10.1016/j.envpol.2009.12.031. [DOI] [PubMed] [Google Scholar]
- Christensen TH, Kjeldsen P, Bjerg PL, Jensen DL, Christensen JB, Baun A, Albrechtsen HJ, Heron G. Biogeochemistry of landfill leachate plumes. Appl Geochem. 2001;16:659–718. [Google Scholar]
- Company, 3M. Material Data Safety Sheet for FC-95 Fluorad Brand Fluorochemical Surfactant. St.. Paul, MN: 1999. [Google Scholar]
- D'Eon JC, Hurley MD, Wallington TJ, Mabury SA. Atmospheric chemistry of N-methyl perfluorobutane sulfonamidoethanol, C4F9SO2N(CH3)CH2CH2OH: Kinetics and mechanism of reaction with OH. Environ Sci Technol. 2006;40:1862–1868. doi: 10.1021/es0520767. [DOI] [PubMed] [Google Scholar]
- D'Hollander W, Roosens L, Covaci A, Cornelis C, Reynders H, Van Campenhout K, de Vooght P, Bervoets L. Brominated flame retardants and perfluorinated compounds in indoor dust from homes and offices in Flanders, Belgium. Chemosphere. 2010;81:478–487. doi: 10.1016/j.chemosphere.2010.07.043. [DOI] [PubMed] [Google Scholar]
- Higgins CP, Field JA, Criddle CS, Luthy RG. Quantitative determination of perfluorochemicals in sediments and domestic sludge. Environ Sci Technol. 2005;39:3946–3956. doi: 10.1021/es048245p. [DOI] [PubMed] [Google Scholar]
- Higgins CP, Luthy RG. Modeling sorption of anionic surfactants onto sediment materials: An a priori approach for perfluoroalkyl surfactants and linear alkylbenzene sulfonates. Environ Sci Technol. 2007;41:3254–3261. doi: 10.1021/es062449j. [DOI] [PubMed] [Google Scholar]
- Huset CA, Chiaia AC, Barofsky DF, Jonkers N, Kohler HPE, Ort C, Giger W, Field JA. Occurrence and mass flows of fluorochemicals in the Glatt Valley watershed, Switzerland. Environ Sci Technol. 2008;42:6369–6377. doi: 10.1021/es703062f. [DOI] [PMC free article] [PubMed] [Google Scholar]
- Kallenborn R, Berger U, Järnberg U. TemaNord 2004. Vol. 552. Nordic Council of Ministers; Copenhagen: 2004. Perfluorinated alkylated substances (PFAS) in the Nordic environment; p. 112. [Google Scholar]
- Kissa E. Fluorinated Surfactants and Repellants. Marcel Dekker, Inc; New York: 2001. [Google Scholar]
- Kjeldsen P, Barlaz MA, Rooker AP, Baun A, Ledin A, Christensen T. Present and long term composition of MSW landfill leachate - A Review. Crit Rev Environ Sci Technol. 2003;32:297–336. [Google Scholar]
- Konwick BJ, Tomy GT, Ismail N, Peterson JT, Fauver RJ, Higginbotham D, Fisk AT. Concentrations and patterns of perfluoroalkyl acids in Georgia, USA surface waters near and distant to a major use source. Environ Toxicol Chem. 2008;27:2011–2018. doi: 10.1897/07-659.1. [DOI] [PubMed] [Google Scholar]
- Lange CC. Report No. E00-2252. 3M Company; Minneapolis, MN: 2000. The aerobic biodegradation of N-EtFOSE alcohol by the microbial activity present in municipal wastewater treatment sludge. [Google Scholar]
- Lange FT, Wenz M, Schmidt CK, Brauch HJ. Occurrence of perfluoroalkyl sulfonate and carboxylates in German drinking water sources comapred to other countries. Water Sci Technol. 2007;56:151–158. doi: 10.2166/wst.2007.803. [DOI] [PubMed] [Google Scholar]
- Loganathan BG, Sajwan KS, Sinclair E, Kumar KS, Kannan K. Perfluoroalkyl sulfonates and perfluorocarboxylates in two wastewater treatment facilities in Kentucky and Georgia. Water Research. 2007;41:4611–4620. doi: 10.1016/j.watres.2007.06.045. [DOI] [PubMed] [Google Scholar]
- McLachlan MS, Holmstrom KE, Reth M, Berger U. Riverine discharge of perfluorinated carboxylates from the European continent. Environ Sci Technol. 2007;41:7260–7265. doi: 10.1021/es071471p. [DOI] [PubMed] [Google Scholar]
- Oliaei F, Kriens D, Kessler K. Investigation of perfluorohemical (PFC) contamination in Minnesota Phase One: Report to the Senate Environmental Committee. Minnesota Pollution Control Agency; Minneapolis: 2006. p. 79. ( http://www.peer.org/docs/mn/06_27_2_pfc_report.pdf) [Google Scholar]
- Paul AG, Jones KC, Sweetman AJ. A first global production, emission, And environmental inventory for perfluorooctane sulfonate. Environ Sci Technol. 2009;43:386–392. doi: 10.1021/es802216n. [DOI] [PubMed] [Google Scholar]
- Prevedouros K, Cousins IT, Buck RC, Korzeniowski SH. Sources, fate, and transport of perfluorocarboxylates. Environ Sci Technol. 2006;40:32–44. doi: 10.1021/es0512475. [DOI] [PubMed] [Google Scholar]
- Rhoads KR, Janssen EML, Luthy RG, Criddle CS. Aerobic biotransformation and fate of N-ethyl perfluorooctane sulfonamidoethanol (N-EtFOSE) in activated sludge. Environ Sci Technol. 2008;42:2873–2878. doi: 10.1021/es702866c. [DOI] [PubMed] [Google Scholar]
- Schultz MM, Barofsky D, Field J. Quantitative determination of fluorinated alkyl substances in municipal wastewater by large-volume-injection LC/MS/MS. Environ Sci Technol. 2006;40:289–295. doi: 10.1021/es051381p. [DOI] [PMC free article] [PubMed] [Google Scholar]
- Schultz MM, Barofsky D, Field JA. Quantitative determination of fluorotelomer sulfonates in groundwater by LC MS/MS. Environ Sci Technol. 2004;38:1828–1835. doi: 10.1021/es035031j. [DOI] [PubMed] [Google Scholar]
- Sinclair E, Kannan K. Mass loading and fate of perfluoroalkyl surfactants in wastewater treatment plants. Environ Sci Technol. 2006;40:1408–1414. doi: 10.1021/es051798v. [DOI] [PubMed] [Google Scholar]
- Sinclair E, Kim SK, Akinleye HB, Kannan K. Quantitation of gas-phase perfluoroalkyl surfactants and fluorotelomer alcohols released from nonstick cookware and microwave popcorn bags. Environ Sci Technol. 2007;41:1180–1185. doi: 10.1021/es062377w. [DOI] [PubMed] [Google Scholar]
- Skutlarek D, Exner M, Farber H. Perfluorinated surfactants in surface and drinking water. Environ Sci Pollut Res. 2006;13:299–307. doi: 10.1065/espr2006.07.326. [DOI] [PubMed] [Google Scholar]
- Stadalius M, Connolly P, L'Empereur K, Flaherty JM, Isemura T, Kaiser MA, Knaup W, Noguchi M. A method for the low-level (ng g(-1)) determination of perfluorooctanoate in paper and textile by liquid chromatography with tandem mass spectrometry. J Chromatogr A. 2006;1123:10–14. doi: 10.1016/j.chroma.2006.03.037. [DOI] [PubMed] [Google Scholar]
- Strynar MJ, Lindstrom AB. Perfluorinated compounds in house dust from Ohio and North Carolina, USA. Environ Sci Technol. 2008;42:3751–3756. doi: 10.1021/es7032058. [DOI] [PubMed] [Google Scholar]
- Taniyasu S, Kannan K, So MK, Gulkowska A, Sinclair E, Okazawa T, Yamashita N. Analysis of fluorotelomer alcohols, fluorotelorner acids, and short- and long-chain perfluorinated acids in water and biota. J Chromatogr A. 2005;1093:89–97. doi: 10.1016/j.chroma.2005.07.053. [DOI] [PubMed] [Google Scholar]
- Tremoen S. Screening of polyfluorinated organic compounds at four fire training facilities in Norway Report no. 2444. Norweigan Pollution Control Authority; Olso, Norway: 2009. p. 89. [Google Scholar]
- U.S. Environmental Protection Agency. Method 120.1, Conductance (Specific Conductance, umhos at 25C) EPA/600/4-79/020. Methods for the Chemical Analysis of Water and Wastes (MCAWW) [Google Scholar]
- U.S. Environmental Protection Agency. Method 300.0A: Determination of Inorganic Anions by Ion Chromatography. EPA/600/R-93/100. [Google Scholar]
- Biosolids Generation, Use, and Disposal in The United States. Washington D.C: Methods for the Determination of Inorganic Substances in Environmental Samples U.S. Environmental Protection Agency, 1999. EPA530-R-99-009. [Google Scholar]
- U.S. Environmental Protection Agency. Municipal Solid Waste in the United States: 2007 Facts and Figures. Washington DC: 2007. EPA530-R-08-010. [Google Scholar]
- Washburn ST, Bingman TS, Braithwaite SK, Buck RC, Buxton LW, Clewell HJ, Haroun LA, Kester JE, Rickard RW, Shipp AM. Exposure assessment and risk characterization for perfluorooctanoate in selected consumer articles. Environ Sci Technol. 2005;39:3904–3910. doi: 10.1021/es048353b. [DOI] [PubMed] [Google Scholar]
- Woldegiorgis A, Andersson J, Remberger M, Kaj L, Ekheden Y, Blom L, Brorstrom-Lunden E, Borgen A, Dye C, Schalaback M Instititute, I.S.E., editor . Results from the Swedish National Screening Programme 2005: Subreport3: Perfluorinated alkylated substances (PFAS) Stockholm: 2006. p. 48. [Google Scholar]
Associated Data
This section collects any data citations, data availability statements, or supplementary materials included in this article.