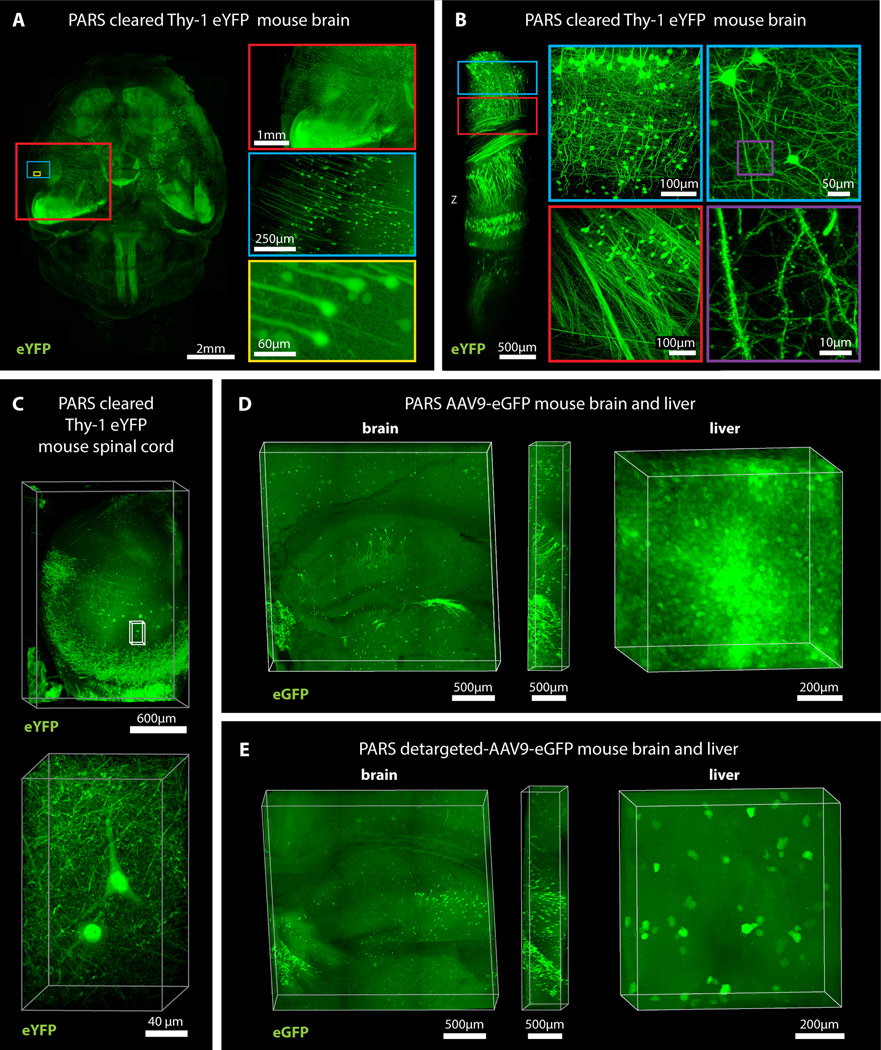
Figure 5. PARS enables whole-brain mapping of widespread and sparse genetically encoded fluorescent signals with subcellular resolution.
(A) Whole brain image (z = 6 mm), and (B) deep-brain imaging (z = 4 mm) of adult Thy1-eYFP mouse after PARS clearing for 10 days. The boxes on the right show high magnification images of indicated areas. (C) Spinal cord image of adult Thy1-eYFP mouse after PARS clearing for 2 weeks (z = 2 mm). Lower panel shows high magnification images of indicated region (z = 1.2 mm). (D) Images show native eGFP fluorescence in 1 mm coronal brain slices (left) and liver (right) prepared from the PARS cleared mice that received IV injections of AAV9:CAG-eGFP. Image columns to the right of each coronal brain image show the orthogonal views (z = 0.5 mm). (E) Native eGFP fluorescence in 1 mm coronal brain slices (left) and liver (right) prepared from PARS cleared mice injected with a liver detargeted variant, AAV9BD1:CAG-eGFP. Image columns to the right of each coronal brain image show the orthogonal views (z = 0.5 mm). For microscopy see Supplemental Methods. Also see Figure S5 and Supplemental Movie 2 (for 5B).

