Abstract
In this report, we demonstrate the feasibility of using optoacoustic tomography (OAT) to evaluate biodistributions of nanoparticles in animal models. The redistribution of single-walled carbon nanotubes (SWCNTs) was visualized in living mice. Nanoparticle concentrations in harvested organs were measured spectroscopically using the intrinsic optical absorption and fluorescence of SWCNTs. Observed increases in optoacoustic signal brightness in tissues were compared with increases in optical absorption coefficients caused by SWCNT accumulation. The methodology presented in this report can further be extended to calibrate the sensitivity of an optoacoustic imaging system for a range of changes in optical absorption coefficient values at specific locations or organs in a mouse body to enable noninvasive measurements of nanoparticle concentrations in vivo. Additionally, qualitative information provided by OAT and quantitative information obtained ex vivo may provide valuable feedback for advancing methods of quantitative analysis with OAT.
Observed changes in organ brightness in an optoacoustic mouse image can be correlated to quantitative changes in organ absorption coefficients.
Keywords: optoacoustic tomography, photoacoustic imaging, nanoparticle concentration, carbon nanotubes, SWCNT, biodistribution
1. Introduction
In recent years, biomedical applications of nanotechnology have emerged at an increasing pace. With their minute dimensions and large surface areas, nanoparticles can often penetrate cellular membranes and deliver high payloads of targeting agents and drugs to achieve better specificity and therapeutic effects than non-targeted treatments [1,2]. To aid the development of novel nanotechnology-based therapies, preclinical imaging techniques are needed to efficiently monitor nanoparticle accumulation and clearance rates in vivo. However, tedious ex vivo analysis of nanoparticle concentrations in organs of test animals remains a standard approach in such biodistribution studies [3–6].
While imaging methods, such as single photon emission computed tomography (SPECT), positron emission tomography (PET), magnetic resonance imaging (MRI) or computer tomography (CT), are currently available to detect specific types of nanoparticles, they rely on particular contrast agents and remain inaccessible to most researchers due to high instrumentation and operational costs [7]. In vivo fluorescence imaging is perhaps the simplest and most readily available method to observe fluorescent nanoparticles in small animals. However, it provides limited resolution and imaging depth, and is hampered by strong scattering of light in tissues.
Optoacoustic tomography (OAT) is an emerging imaging technology that utilizes ultrasound generated by absorption of nanosecond-scale laser pulses to recreate an image of the absorbing volume based on the spatial variation of optical absorption coefficients [8, 9]. This novel non-invasive imaging modality is capable of revealing internal organs and vasculature in three dimensions at depths of several centimeters and resolutions of 500 µm or less [10]. Three-dimensional OAT was successfully used to visualize the blood circulation system and blood-rich organs in live mice [11]. Strongly absorbing gold and carbon nanoparticles were used previously as optoacoustic (OA) contrast agents to enhance the imaging and detection capabilities of the technique [12–14]. Due to the unknown light distribution in a complex optical scattering environment, tomographic images of live animals typically contain only qualitative information and are not suitable for quantitative biodistribution analysis. In this report, we present a novel methodology that can establish the link between localized changes in OAT image intensities in tissues and organs of small animals and the underlying changes in tissue/organ absorption coefficients caused by nanoparticle accumulation. This technique represents an important enabling step towards quantitative in vivo measurements of optically absorbing contrast agents in small animals.
2. Experimental
2.1 Optoacoustic imaging setup
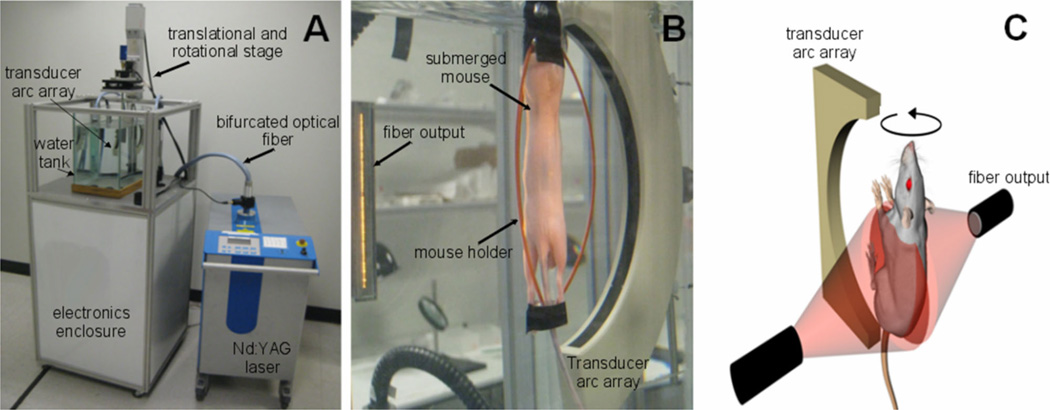
In these studies we used a prototype of a commercial three-dimensional laser optoacoustic imaging system (LOIS-3D), shown in Figure 1, which was developed for preclinical research at TomoWave Laboratories, Houston, TX, and introduced in our earlier publications [10, 14]. Laser pulses at 1064 nm (duration of 12 ns, ~200 mJ/pulse, 10 Hz repetition rate) were generated by a Nd:YAG component of SpectraWave laser (joint product of TomoWave Labs, Houston, TX and Quanta Systems, Solbiate Olona, Italy). Laser light was delivered to the sample via a custom bifurcated fiber bundle, whose outputs were placed outside of a water tank orthogonally to the transducer array. The laser fluence measured at the animal’s skin was ~0.8 mJ/(pulse.cm2). The water temperature was maintained at 36 °C. To acquire OA signals, we used a 64-channel arc array of piezocomposite elements (Imasonic SAS, France) with a detection bandwidth of 0.1– 3.1 MHz. The array was oriented vertically inside the tank, with an arc radius of 65 mm and an aperture of 150°. Acquired signals were amplified at a gain of 60 dB and digitized at a 25 MHz sampling rate. During the scan, the mouse was rotated about a vertical axis passing through the focal center of the array by a total of 360° in 2.4° steps. Signals were averaged 64 times at each step to reach optimal signal to noise ratio. The OA signals acquired at each rotational position of the mouse were amplified, digitized and saved in a computer. Post-processing of OA signals included: (1) synchronization with the time of laser emission; (2) Wiener deconvolution of the system’s acousto-electric impulse response with a constant signal-to-noise ratio of 10; (3) filtering and integration with the seven scales of the custom-designed wavelet filter; (4) removal of the first principal component from data of each individual channel [15]. The principal component analysis was done on a signal basis across all acquisitions to remove common features found in each particular channel [16]. Three-dimensional OA tomographic reconstruction was performed using a modified back projection algorithm [10] with 0.1 mm3 voxels. The OAT software was developed to run on CUDA-supported graphics processing units of Fermi videocard (NVIDIA, Santa Clara, CA), resulting in fast reconstruction of three-dimensional OA images (~90 seconds for 50 million voxels). Image processing and representation in VolView 2.0 (Kitware, Clifton Park, NY) included: 1) denoising by setting a ramp-like transparency mapping and median filtering with a 3×3×3 voxel kernel; 2) applying strong edge detection to emphasize large intensity changes (boundaries); 3) using a linear grayscale palette with saturation at a fixed level within the dynamic range of all the images.
Figure 1.
(A) A photograph of the LOIS-3D system. (B) A photograph of a mouse in a water tank during the scan. (C) A sketch of the experimental geometry showing the relative position of the illumination and detection elements.
2.2 Sample preparation and characterization
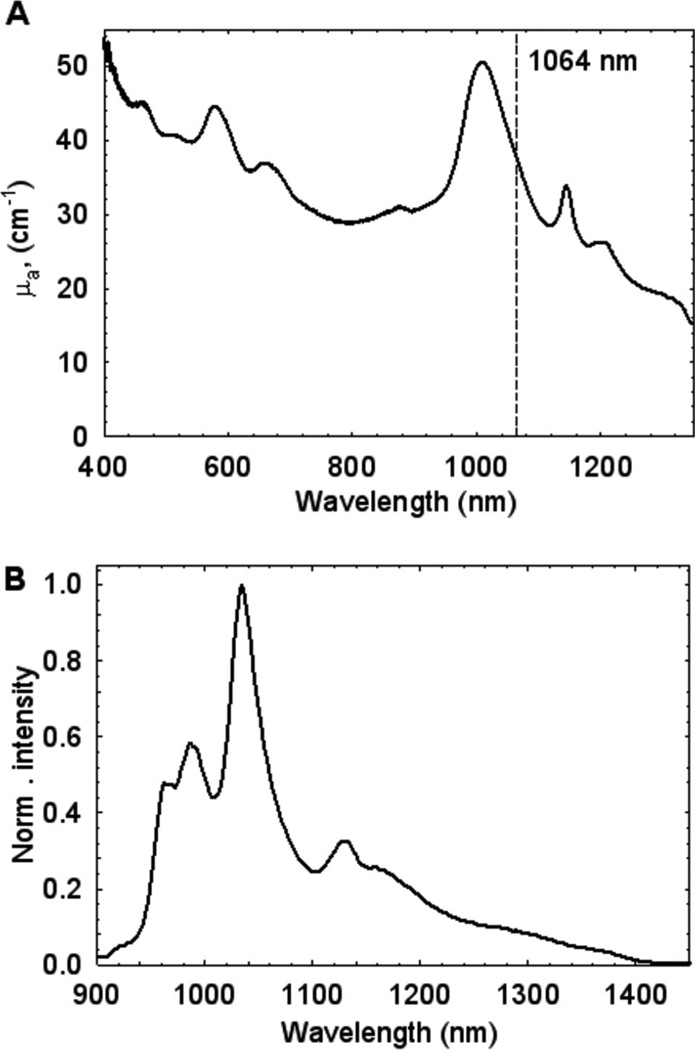
Suspensions of commercially available single-walled carbon nanotubes (SWCNTs) ((6,5)-abundant sample from SouthWest NanoTechnologies, Inc.) were prepared as follows. Approximately 5 mg of SWCNT material was placed in 12 mL of a 2% aqueous solution of Pluronic F-127 and sonicated with a tip ultrasonic cell processor (Misonics model Microson 2000 XL) for 40 min using on/off cycles with duration of 15 s each. An external water bath was used to prevent sample heating. The resulting suspension was centrifuged at 10,000 × g for 15 min to remove large undispersed aggregates. Only a small amount of precipitate remained after supernatant removal. Absorption and fluorescence (642 nm excitation wavelength) spectra of the stock SWCNT suspension were measured with a model NS2 NanoSpectralyzer (Applied NanoFluorescence, LLC) (Figure 2A, B).
Figure 2.
(A) Absorption and (B) emission (λexc = 642 nm) spectra of a stock SWCNT Pluronic suspension.
The optical absorption coefficient µa at 1064 nm was 38 cm−1. Using the experimentally determined base 10 mass extinction coefficient value of 0.036 mL/ (µg cm) at ~630 nm for SWCNTs in surfactant suspensions, we estimate the stock SWCNT solution concentration as ~0.43 mg/mL. Similar extinction coefficient values for SWCNTs were reported previously [4,17]. We note that Pluronic is a biocompatible surfactant that has been used earlier for intravenous nanoparticle injections in mammals [6,18].
2.3 Animal handling procedures
All procedures complied with a protocol approved by Institutional Animal Care and Use Committee (IACUC) of the Univ. of Houston. We used four athymic Nude-Foxn1nu mice (Harlan, Indianapolis, IN), 7–8 weeks old, weighing about 23–25 g. Animal handling, isoflurane anesthesia, and euthanasia were described earlier [10,14]. Each mouse was scanned prior to injection to obtain reference OA images. After the initial scan, 3 mice were intraperitoneally injected with 400 µL of SWCNT stock solution. A control mouse was administered 400 µL of a 2% aqueous Pluronic solution. Mice were scanned again 3 days after injection, and then sacrificed using the method of CO2 inhalation. Their organs were harvested for further inspection.
2.4 SWCNT concentration measurements in organs of mice
Fluorescence of disaggregated SWCNTs allows one to measure concentrations of SWCNTs in organs. Organs were rinsed in phosphate buffered saline, and their weights were recorded. These specimens were then homogenized using a tissue grinder (Ten-broeck, USA) with added homogenization buffer (2% solution of sodium deoxycholate (SDOC) in H2O) to provide dilutions of 1 : 15, 1 : 15 and 1 : 40 for liver, kidney and spleen, respectively. A 1.5 mL portion of the homogenized sample was placed in a 2 mL centrifuge tube and sonicated at an output power of ~8W for 40 min using 10 s on and 5 s off cycles while an external ice bath prevented sample heating. The required duration of ultrasonic treatment was determined empirically by repeated measurements of sample’s near-IR fluorescence signal until no further intensity increase was observed. The resulting suspensions showed very little scattering, which was beneficial for optical measurements. To prepare a reference sample, 100 µL of the stock SWCNT solution in Pluronic was added to 2 mL of 2% aqueous SDOC and sonicated as described above to maximize its fluorescence.
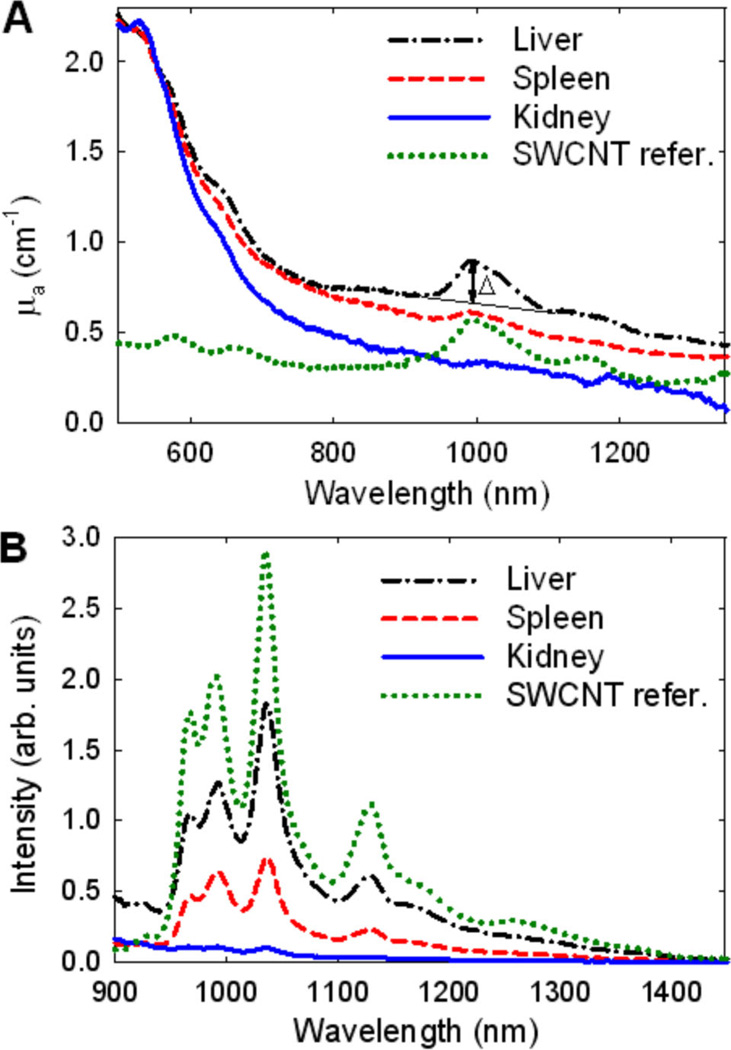
Tissue samples without nanotubes typically exhibit structureless autofluorescence and background absorptions that are markedly different from SWCNT features. Examples of the recorded emission and absorption spectra of processed organ samples are shown in Figure 3A, B. SWCNT fluorescence and SWCNT absorption peaks at 997 nm were separately used to measure nanotube concentrations in these samples. The net peak amplitude Δ (Figure 3A) is a stable feature of the nanotube absorption which does not change significantly during sample processing (Supporting Information, Section 1). Thus, comparing Δ values of a sample and a reference solution containing a known nanotube concentration allows one to measure SWCNT concentration in the sample.
Figure 3.
(A) Absorption and (B) emission spectra (λexc = 642 nm) of liver, spleen, and kidney samples. Spectra of a reference solution with nanotube concentration of ~4.3 µg/mL are shown for comparison.
The fluorescence method provides much higher sensitivity for measuring SWCNTs in biological specimens. Note that biological residues present in samples may interact with nanotubes to perturb their emission wavelengths and/or emission intensities. To account for these effects, we used the following procedure. The sample’s emission spectrum was measured, and then a 1.5 mL portion was spiked with precisely 10 or 20 µL of the reference SWCNT suspension in SDOC. The resulting mixture was briefly sonicated for 1 min to facilitate equilibration of surfactant and biological residues at the surface of added nanotubes. Then we measured the emission spectrum of the resulting suspension and determined the increase in distinct SWCNT features caused by spiking. This allowed us to reliably deduce the initial SWCNT concentration in the specimen (see Supporting Information, Section 1 for details).
3. Results and discussion
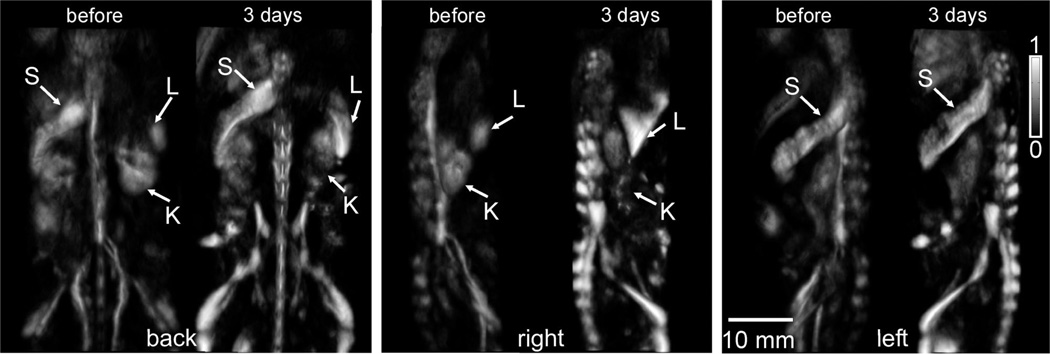
The brightness of a particular organ or tissue in an OAT image is defined by the amount of light it absorbs, and thus depends on the organ’s optical absorption coefficient µa and the amount of light that reaches it. A localized increase in OA image brightness generally implies an increase in µa value at that location. OA will detect nanoparticle accumulation as well as changes in blood or water saturation levels in organs. Figure 4 shows dorsoventral (back), left medio-lateral, and right medio-lateral OA images of a mouse before and after SWCNT injection. Significant increases in brightness are seen at the locations of liver and spleen, as well as the mouse skeleton. However, mouse kidneys show no noticeable brightness increases. Note that it is not feasible to overlay these images to show only localized changes in brightness because the precise mouse positioning differs between scans. Prior mammalian pharmacokinetic studies of carbon nanotubes suspended in Pluronic and other surfactants found predominant nanotube accumulation in liver and spleen after intravenous injection [6,18,19]. Our OAT images show qualitatively similar information.
Figure 4.
OA images of a mouse before and 3 days after SWCNT injection. The grayscale intensity is the same for all images. Dorsoventral, left medio-lateral, and right medio-lateral views are shown. S, L, K show locations of spleen, liver and kidney, respectively.
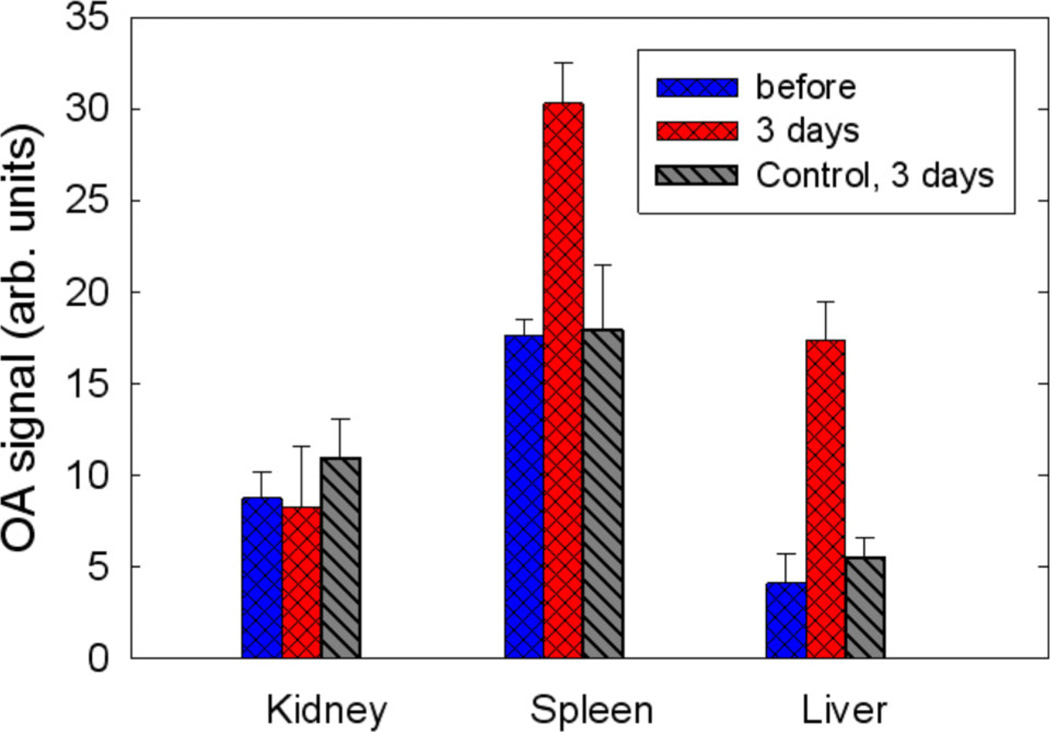
To quantify OA brightness of selected organs, namely liver, kidney and spleen, we selected a 2×2×2 mm region of interest (ROI), which fit inside the organ at approximately similar locations, and calculated the average voxel intensity values. The measured OA signals from organs of 4 mice are presented in Figure 5. We analyzed OA signals from organs of a few selected mice by shifting the ROI position within visible boundaries of a particular organ and evaluating variations in the corresponding average intensity values. We estimate that the error in the measured OA signal values associated with arbitrary positioning of the ROI inside an organ is ~15–20%. (We are currently developing numerical image processing algorithms that should provide better accuracy in quantifying optoacoustic response from an organ.) We observed no significant changes in the OA signal magnitudes from the organs of the control mouse before and after Pluronic injection. On average, OA signals from spleen and liver increased by 60% and 360%, respectively from SWCNT injection (Figure 5). These changes can be attributed predominantly to the accumulation of nanoparticles in these organs. Note that while it is not possible to entirely disregard physiological responses to injection of nanoparticles in an organism, their contributions at the imaging wavelength of 1064 nm are expected to be negligible. No abnormalities such as liver or spleen haemorrhages were detected in these mice during post mortem examination.
Figure 5.
Averaged OA signals from organs of 4 mice measured before and 3 days after SWCNT injection.
Quantitative measurement of µa in tissues using OAT is a complex problem that requires knowledge of the light distribution throughout the sample [11, 20, 21]. Although methods to quantify light intensities in tissues are being developed [20–22], their application in live animal models is not feasible at present. Indeed, the strong dependence of light penetration depth on µa in different organs and tissues, which is not known a priori; imprecisely known scattering properties of tissues; and complex and poorly characterized scattering environment geometries pose overwhelming difficulties for rigorous analysis and modeling of light distributions in live animals. Here we suggest an alternative and simplified method to enable concentration measurements of nanoparticles in vivo. By establishing a quantitative correlation between the changes in OA signal brightness from a specific organ and the corresponding changes in organ’s µa value in a given experimental geometry, concentration measurements of optical absorbers in vivo may become feasible.
The proposed approach represents a method for calibrating sensitivity of an optoacoustic imaging system in a particular experimental geometry and for specific type of animal. The differences in the amount of energy absorbed in a selected organ caused by natural variability of tissue optical properties from animal to animal are expected to be the major source of error in concentration measurements. The influence of acoustic attenuation on the accuracy of the method will be smaller, given significantly weaker attenuation and scattering of ultrasound waves in tissues. Athymic nude mice used in this work represent one of the standard cancer models. They are genetically uniform with very similar characteristics, which means that optical properties of their tissues and organs are similar. As a result, variability of light distribution in organs of different animals may not be excessive, and the suggested methodology will allow quantitative measurements, albeit with a limited accuracy. To our best knowledge, there have been no prior attempts to perform rigorous quantitative analysis of three-dimensional OAT images of small animals which include the modeling of light distributions throughout the imaging volume [21]. The presented methodology may further be applied to help develop and test future quantitative analytical techniques.
Brightness of an organ or an area in a reconstructed OA image is a complex function of many parameters, including the light distribution at this location, optical absorption contrast relative to its surroundings, the frequency spectrum of generated signals, and the detection bandwidth of the acoustic probe. Acoustic artifacts, as well as signal processing and image reconstruction algorithms, may change the background level at a specific location by an unknown value. It is expected that small increases in an organ’s µa will initially result in linear changes in OA signal magnitudes. However, large µa increases will affect the distribution of light in an organ and its surroundings, which would result in a nonlinear response. In an extreme case when all light reaching the organ is absorbed at its surface, further µa increase will not produce any additional increase in OA image brightness. Thus, one may expect an organ’s OAT brightness to show a monotonic and sublinear dependence on its µa value.
For a number of reasons, SWCNTs appear to be highly suitable contrast agents for quantifying changes in organ optical absorption. First, the bulk absorption spectrum of SWCNTs is fairly stable and not particularly sensitive to nanotube aggregation or changes to the SWCNT coating [18, 23, 24] (Supporting Information, Section 2). Second, SWCNTs in a biological environment can be detected by a variety of sensitive techniques, including fluorescence [6, 18], Raman [3, 19] and absorption spectroscopy, to obtain a reliable measure of SWCNT concentrations in mouse organs. Third, SWCNTs are physically and chemically stable and, unlike most dyes, cannot be easily photobleached by laser pulses [25, 26] or metabolized in vivo [27]. Note that even a small degree of SWCNT surface derivatization or structural damage results in strong quenching of SWCNT fluorescence but little change in SWCNT absorption [28].
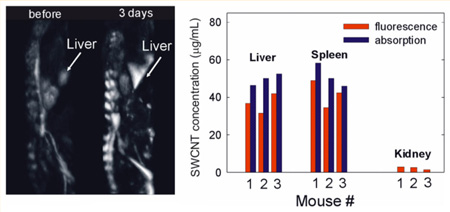
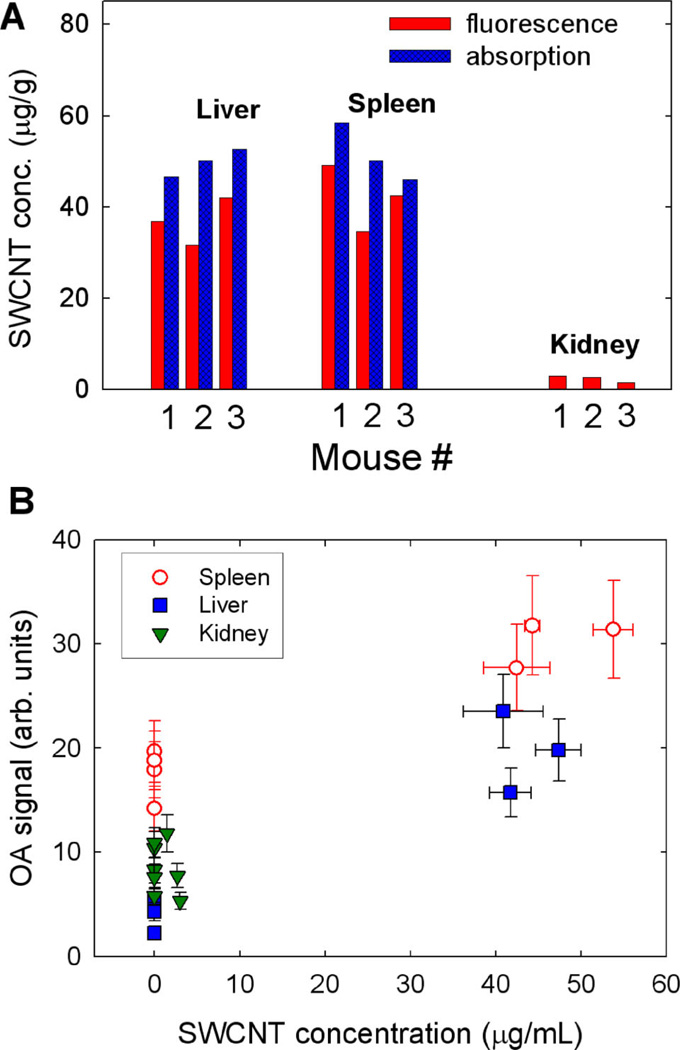
SWCNT concentrations in organs of mice, measured with absorption and fluorescence spectroscopy as described in the experimental section, are shown in Figure 6A. Absorption features attributable to SWCNTs were reliably detected only in the liver and spleen samples. Notably, the fluorescence method appears to consistently underestimate SWCNT concentrations by ~22% on average. While the origin of the observed discrepancy remains to be clarified, possible sources of error include potential SWCNT functionalization while in vivo, or the partial quenching of SWCNT fluorescence by biological residues present in the processed organ samples (see Supporting Information, Section 1 for details). Organ weights in all three mice were similar: liver − 1.5 ± 0.1 g, spleen − 0.105 ± 0.004 g, kidney − 0.21 ± 0.02 g. Averaged SWNCT concentrations in the liver, spleen, and kidneys of 3 mice were 43 ± 8, 47 ± 8 and 2.4 ± 0.8 µg/g, respectively. We estimate that approximately 65 µg of SWCNT material (~38% of the injected dose) was accumulated in these organs 3 days after SWCNT injection. Assuming a uniform distribution of nanoparticles in an organ, the µa of liver and spleen at 1064 nm was increased by ~3.8 cm−1 and ~4.7 cm−1, respectively. Since the initial µa values of mouse organs are unknown, we can present only a preliminary calibration graph showing the connection between measured OA signals from organs and the corresponding µa values. For comparison, reported µa values of liver (human, bovine) and spleen (human, albino rat) at 1064 nm are ~0.4– 0.7 cm−1, and ~6 cm−1, respectively [29–31].
Figure 6.
(A) Concentrations of SWCNTs in organs of mice measured 3 days after injection. (B) Correlation of OA signals from organs of 4 mice with the measured concentrations of SWCNTs accumulated in these organs. Vertical error bars show the estimated measurement error of OA organ brightness. Horizontal error bars show the discrepancy between concentration measurements via SWCNT absorption and fluorescence.
Figure 6B demonstrates the observed correlation between SWCNT concentration in organs and the corresponding change in brightness in OAT image. There appears to be qualitative agreement between the changes in OA signal magnitude and organ µa relative to the initial values. The absence of a clear monotonic dependence of OA signals on SWCNT concentration in organs suggests the presence of additional sources of error in the imaging method (e.g. variation in optical properties of tissues from animal to animal, differences in their organ sizes and positioning geometry). Additional studies involving larger animal subgroups with different concentrations of nanoparticles in their organs will be needed to reveal this trend and define the magnitude of the measurement error.
4. Conclusion
Quantitative in vivo measurements of nanoparticle concentrations are essential for nanotechnology-based preclinical research. We have developed a methodology to correlate changes in optoacoustic signal intensity from organs of live animals detected with OAT in relation to changes of optical absorption coefficient in those organs. The localized OAT brightness changes induced by nanoparticle accumulation in liver, kidney and spleen of nude mice were observed and quantified. Using the intrinsic fluorescence properties of disaggregated nanotubes, we readily measured SWCNT concentrations in the parts-per-million range in these organs and defined the corresponding changes in optical absorption coefficient. The combination of these methods allows one to perform sensitivity calibration of an OAT system for a selected type of animal and for a range of optical absorption coefficient values of their organs to enable non-invasive concentration measurements of optically absorbing nanoparticles and dyes in vivo. Furthermore, the methodology presented here may aid in the development and testing of new methods of optoacoustic quantitative analysis.
Supplementary Material
Acknowledgments
This work was supported by from the National Institutes of Health (SBIR grants 1R43ES021629, R44CA110137, R44CA110137-S1), and the Welch Foundation (grant C-0807).
Footnotes
Supporting information is provided describing the methodology of SWCNT concentration measurements in organs, stability of optical properties SWCNT ensembles, and the effects of SWCNT aggregation on the magnitude of optoacoustic signals.
Conflict of interest All Authors affiliated with Tomo-Wave have financial interests in the company.
Author biographies Please see Supporting Information online.
References
- 1.Ferrari M. Nat. Rev. Cancer. 2005;5:161–171. doi: 10.1038/nrc1566. [DOI] [PubMed] [Google Scholar]
- 2.Jain KK. Clin. Chem. 2007;53:2002–2009. doi: 10.1373/clinchem.2007.090795. [DOI] [PubMed] [Google Scholar]
- 3.Liu Z, Cai WB, He LN, Nakayama N, Chen K, Sun XM, Chen XY, Dai HJ. Nat. Nanotechnol. 2007;2:47–52. doi: 10.1038/nnano.2006.170. [DOI] [PubMed] [Google Scholar]
- 4.Schipper ML, Nakayama-Ratchford N, Davis CR, Kam NWS, Chu P, Liu Z, Sun XM, Dai HJ, Gambhir SS. Nat. Nanotechnol. 2008;3:216–221. doi: 10.1038/nnano.2008.68. [DOI] [PubMed] [Google Scholar]
- 5.Kang B, Yu DC, Dai YD, Chang SQ, Chen D, Ding YT. Carbon. 2009;47:1189–1192. [Google Scholar]
- 6.Kirkpatrick DL, Weiss M, Naumov A, Bartholomeusz G, Weisman RB, Gliko O. Materials. 2012;5:278–301. doi: 10.3390/ma5020278. [DOI] [PMC free article] [PubMed] [Google Scholar]
- 7.Kagadis GC, Loudos G, Katsanos K, Langer SG, Nikiforidis GC. Med. Phys. 2010;37:6421–6442. doi: 10.1118/1.3515456. [DOI] [PubMed] [Google Scholar]
- 8.Oraevsky AA, Jacques SL, Esenaliev RO, Tittel FK. Proc. SPIE. 1994;2134A:122–128. [Google Scholar]
- 9.Kruger RA, Liu P. Med. Phys. 1994;21:1179–1184. doi: 10.1118/1.597399. [DOI] [PubMed] [Google Scholar]
- 10.Brecht HP, Su R, Fronheiser M, Ermilov SA, Conjusteau A, Oraevsky AA. J. Biomed. Opt. 2009;14:064007/1–064007/8. doi: 10.1117/1.3259361. [DOI] [PMC free article] [PubMed] [Google Scholar]
- 11.Oraevsky AA. In: Photoacoustic imaging and spectroscopy. Wang LV, editor. New York: Taylor and Francis Group; 2009. p. 411. [Google Scholar]
- 12.De La Zerda A, Zavaleta C, Keren S, Vaithilingam S, Bodapati S, Liu Z, Levi J, Smith BR, Ma TJ, Oralkan O, Cheng Z, Y Chen X, Dai HJ, Khuri-Yakub BT, Gambhir SS. Nat. Nanotechnol. 2008;3:557–562. doi: 10.1038/nnano.2008.231. [DOI] [PMC free article] [PubMed] [Google Scholar]
- 13.Pramanik M, Song KH, Swierczewska M, Green D, Sitharaman B, Wang LHV. Phys. Med. Biol. 2009;54:3291–3301. doi: 10.1088/0031-9155/54/11/001. [DOI] [PMC free article] [PubMed] [Google Scholar]
- 14.Su R, Ermilov SA, Liopo AV, Oraevsky AA. J. Biomed. Opt. 2012;17:101506/1–101506/7. doi: 10.1117/1.JBO.17.10.101506. [DOI] [PMC free article] [PubMed] [Google Scholar]
- 15.Ermilov SA, Gharieb R, Conjusteau A, Miller T, Mehta K, Oraevsky AA. Proc. SPIE. 2008;6856:685603/1–685603/6. [Google Scholar]
- 16.Wall WM, Rechtsteiner A, Rocha LM. In: A Practical Approach to Microarray Data Analysis. Berrar DP, Dubitzky W, Granzow M, editors. Kluwer, Norwell, MA: 2003. pp. 91–109. [Google Scholar]
- 17.Moore VC. Ph.D. thesis. Rice University (USA); 2005. [Google Scholar]
- 18.Cherukuri P, Gannon CJ, Leeuw TK, Schmidt HK, Smalley RE, Curley SA, Weisman RB. Proc. Natl. Acad. Sci. USA. 2006;103:18882–18886. doi: 10.1073/pnas.0609265103. [DOI] [PMC free article] [PubMed] [Google Scholar]
- 19.Liu Z, Davis C, Cai WB, He L, Chen XY, Dai HJ. Proc. Natl. Acad. Sci. USA. 2008;105:1410–1415. doi: 10.1073/pnas.0707654105. [DOI] [PMC free article] [PubMed] [Google Scholar]
- 20.Bauer AQ, Nothdurft RE, N Erpelding T, Wang LHV, Culver JP. J. Biomed. Opt. 2011;16:096016/1–096016/7. doi: 10.1117/1.3626212. [DOI] [PMC free article] [PubMed] [Google Scholar]
- 21.Cox B, Laufer JG, R Arridge S, Beard PC. J. Biomed. Opt. 2012;17 doi: 10.1117/1.JBO.17.6.061202. 061202-122. [DOI] [PubMed] [Google Scholar]
- 22.Cox BT, Laufer JG, Beard PC. Biomed. Opt. 2010:201–208. doi: 10.1364/BOE.1.000201. Express 1. [DOI] [PMC free article] [PubMed] [Google Scholar]
- 23.Moore VC, Strano MS, Haroz EH, Hauge RH, Smalley RE. Nano Lett. 2003;3:1379–1382. [Google Scholar]
- 24.Niyogi S, Boukhalfa S, Chikkannanavar SB, McDonald TJ, Heben MJ, Doom SK. J. Am. Chem. Soc. 2007;129:1898–1899. doi: 10.1021/ja068321j. [DOI] [PubMed] [Google Scholar]
- 25.W Baac H, Ok JG, Park HJ, Ling T, Chen SL, Hart AJ, Guo J. Appl. Phys. Lett. 2010;97:234104/1–234104/3. doi: 10.1063/1.3522833. [DOI] [PMC free article] [PubMed] [Google Scholar]
- 26.Boghossian A, Zhang J, Barone PW, Reuel NF, Kim J, Heller DA, Ahn J, Hilmer AJ, Rwei A, Arkalgud JR, Zhang CT, Strano MS. Chem-SusChem. 2011;4:848–863. doi: 10.1002/cssc.201100070. [DOI] [PubMed] [Google Scholar]
- 27.Yang ST, Luo J, Zhou Q, Wang H. Theranostics. 2012;2:271–282. doi: 10.7150/thno.3618. [DOI] [PMC free article] [PubMed] [Google Scholar]
- 28.Cognet L, Tsyboulski D, Rocha JDR, Doyle CD, Tour JM, Weisman RB. Science. 2007;316:1465–1468. doi: 10.1126/science.1141316. [DOI] [PubMed] [Google Scholar]
- 29.Cheong WF, Prahl SA, Welch AJ. IEEE J. Quant. Elec. 1990;26:2166–2185. [Google Scholar]
- 30.Yu Y, Xiao C, Chen K, Zheng J, Zhang J, Zhao X, Xue X. J. Huazhong Univ. Sci. Technol. 2011;31:515–519. doi: 10.1007/s11596-011-0482-4. [DOI] [PubMed] [Google Scholar]
- 31.Mobley J, Vo-Dinh T. In: Biomedical Photonics Handbook. Vo-Dinh T, editor. Boca Raton: CRC Press; 2003. p. 269. [Google Scholar]
Associated Data
This section collects any data citations, data availability statements, or supplementary materials included in this article.


