Abstract
Optical aberrations limit resolution in biological tissues, and their influence is particularly large for promising techniques like light-sheet microscopy. In principle, image quality might be improved by adaptive optics (AO), in which aberrations are corrected using a deformable mirror (DM). To implement AO in microscopy, one requires a method to measure wavefront aberrations, but the most commonly used methods have limitations for samples lacking point-source emitters. Here we implement an image-based wavefront-sensing technique, a variant of generalized phase-diverse imaging called multi-frame blind deconvolution, and exploit it to calibrate a DM in a light-sheet microscope. We describe two methods of parameterizing the influence of the DM on aberrations: a traditional Zernike expansion requiring 1,040 parameters, and a direct physical model of the DM requiring just 8 or 110 parameters. By randomizing voltages on all actuators, we show that the Zernike expansion successfully predicts wavefronts to an accuracy of approximately 30 nm (rms) even for large aberrations. We thus show that image-based wavefront sensing, which requires no additional optical equipment, allows for a simple but powerful method to calibrate a deformable optical element in a microscope setting.
1. Introduction
Light is refracted by biological tissues. This interaction can be exploited to generate image contrast; however, refractions also present a significant hindrance to image resolution deeper into tissue. The interactions between light and tissue are conventionally discussed in terms of two extremes: “scattering” typically describes the effects of small inhomogeneities in tissue, whereas the term “aberrations” most commonly refers to refractions induced by bulk (average) properties of tissue [1]. One common source for aberrations is the mismatch in index of refraction between the immersion fluid and the sample; for example, water or saline has a refractive index near 1.33, but tissue typically has a variable refractive index ranging from 1.36–1.40 [2].
In a situation in which the tissue is face-on with the objective (i.e., the tissue surface is orthogonal to objective’s optical axis), this refractive index mismatch leads primarily to two types of aberrations, defocus and spherical aberration [3]. The defocus aberration is often not even noticed (it is corrected by changing the focus of the objective), but the spherical aberration typically remains uncorrected and serves as an impediment to imaging deeper into the tissue. More problematic is the case where the tissue is not perfectly flat and/or the tissue surface is not orthogonal to the objective axis, because additional aberrations, which can be substantially larger, are introduced into the images [4]. An extreme case of such tilted imaging is found in a light-sheet based microscopic technique called objective coupled planar illumination microscopy (OCPI) [5].
In typical light-sheet microscopy (also sometimes called planar illumination microscopy) a cylindrical lens is used to create a sheet of light [5–8]. This sheet of light is placed at the focal plane of the objective and the tissue is placed in this overlap region. This arrangement allows for only the in-focus region of the tissue to be illuminated and allows the entire illuminated plane to be imaged simultaneously. Thus light-sheet microscopy allows for high speed and low photo-toxic imaging. To use such light-sheet microscopy to image large samples (i.e., the surface of the mouse brain in vivo), one should minimize the distance in tissue traversed by the excitation light and emitted light; consequently, the light sheet is tilted with respect to the tissue surface, and the objective is tilted correspondingly [Fig. 1(a)]. This tilted imaging introduces sizable new optical aberrations, including defocus, coma, and astigmatism. Previously we showed that the defocus aberration can be corrected by tilting the angle of the light sheet by a few degrees [4]. We hypothesize that wavefront-correcting techniques such as adaptive optics (AO) can be used to correct the remaining aberrations.
Fig. 1.
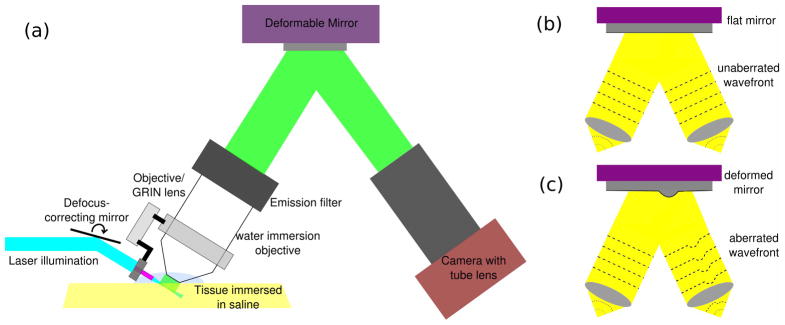
AO-OCPI schematic: (a) The experimental setup for AO-OCPI microscope. A DM is placed behind the back aperture of the objective. The light reflected off the DM is imaged onto a camera. (b,c) Schematic of wavefront aberration when the DM is “flat” and when one actuator on the DM is moved.
AO has been used in a variety of settings, initially by astronomers to correct the loss of resolution in images taken from earth-bound telescopes due to atmospheric turbulence [9]. In AO, a wavefront sensor (typically Shack-Hartmann Wavefront Sensor, SHWFS) is used to measure the aberrations, and a deformable mirror (DM) is used to correct the wavefront to achieve diffraction limited imaging. The resulting improvement in image quality has made adaptive optics an integral part of major new ground-based telescope designs. Similar adaptive optics systems have also been used in vision science where the aberrations of the eye can be measured and corrected [10].
The most crucial element of any AO system is the wavefront sensor; here we focus on this problem as it applies to wide-field microscopy. A traditional SHWFS is difficult to apply directly to most applications in microscopy because tissue samples typically lack point-source emitters [3]; generalizations to extended samples have been described [11], and this might be a useful approach for microscopy, but the need to sample the wavefront at high resolution means that aberrations can only be measured over a region corresponding to a few tens of pixels. Several alternative methods for wavefront sensing have been developed. Coherence-gated techniques [12, 13] are applicable only for scattered light, and these methods introduce some degree of complexity in the apparatus. A more general and (in terms of instrumentation) simpler approach is to use the images themselves to estimate the wavefront aberration. Approaches that iteratively improve the “sharpness” of an image have been found to be applicable in microscopy [14, 15]. But such methods require large number of iterations and/or large number of images, and thus place constraints on the speed and fluorescence levels of the biological preparations. Phase retrieval is a method used to measure the point-spread-function (PSF) of the microscope [16], but such a method is not capable of measuring wavefront aberrations of extended objects. However, a closely related method—phase diverse imaging (PDI)—is capable of measuring wavefront aberrations of extended objects [17, 18]. Phase diverse imaging can be described as follows: In a typical imaging experiment there are two unknowns, (i) the object and (ii) the wavefront aberration; a single image is insufficient to accurately measure the two unknowns. In typical PDI, one image is acquired with the camera in-focus and a second image is acquired with the camera slightly out-of-focus. Thus with the two known images the two unknowns (object and wavefront aberration) can be extracted computationally [17,18]. In principle, such an image-based wavefront sensor is readily applicable in the high signal-to-noise imaging performed through OCPI microscopy.
In order to apply AO to OCPI microscopy, a DM needs to be placed in the light path of the microscope; the DM has a number of control signals, and the effect of these control signals on the aberration structure must be calibrated. SHWFS or interferometry-based systems can be used to calibrate a DM, but that would entail adding a new optical system to the microscope. Since this problem is conceptually equivalent to the wavefront sensing needed for AO, PDI algorithms should also be useful for calibration [19] [Fig. 1(b)]. In practice we apply a technique known as multiframe blind deconvolution (MFBD) [20]. In MFBD one usually acquires multiple images of the same object with multiple unknown aberrations (here caused by DM actuator movement), and exploits the fact that the object is constant to infer the structure of the aberrations. MFBD differs from PDI only by having fewer constraints on the aberrations. Thus, virtually all of the mathematical and algorithmic apparatus can be shared both for aberration correction and DM calibration. In this paper we describe the calibration of a DM in an OCPI microscopy setting. It should be noted that such an image-based wavefront sensing is not limited to light-sheet microscopy, but can be implemented in other imaging applications.
2. AO-OCPI optical layout
In OCPI microscopy the optics needed to form a light sheet are rigidly coupled to the objective, illuminating just the focal place of the objective [5] [Fig. 1(a)]. To permit imaging of extended neural tissues, we tilt the objective (with the coupled laser sheet) from the traditional face-on imaging to an angle of 30 degrees. This minimizes the distance through tissue traveled by both the excitation light and the emitted light.
To correct the resulting aberrations, a DM (Mirao 52-d, Imagine Optics) is placed behind the back aperture of the microscope objective (20× infinity-corrected, 0.5 NA, water immersion, Olympus). The light collected by the objective is reflected off the DM before it is focussed onto a camera (GRAS-14S5M, Point Grey) by a 200 mm tube lens (Edmund Optics) [Fig. 1(a)].
The Mirao 52-d is a 52-actuator DM [21], with the actuators encompassing a circular pupil of 15 mm diameter [Fig. 2(a)]. The reflective surface is made of a silver-coated sheet with an array of permanent magnets on the back side; to change the shape of the mirror, one applies force by controlling the current in coils placed opposite each magnet [Fig. 2(b)].
Fig. 2.

Mirao 52-d. (a) A schematic image of the Mirao 52-d deformable mirror. The 52 actuators encompass a pupil of diameter 15 mm. The numbering of the actuators presented here is used in rest of the paper. (b) The mirror is made of a sheet of mirror with voltage-controlled magnetic actuators on the back surface of the mirror.
3. Phase-diverse imaging: Theory
Consider a base object emitting light with (scalar) intensity f (x) at the position x in a two-dimensional plane. (One challenge in applying traditional phase-diverse imaging to microscopy is the extended, three-dimensional nature of typical objects. The localization of excitation in light-sheet microscopy makes its application more straightforward.) A total of K different images are collected of this fixed object; these images have different aberrations, which here are generated by different settings of the voltages for the DM. These K diversity images are denoted dk (x), k = 1, . . . , K. The PSF for the kth diversity image is denoted sk (x), and because the imaging path is incoherent we write
| (1) |
where hk is the inverse Fourier transform of the optical transfer function for coherent illumination, Hk . Explicitly,
| (2) |
where FT−1 is the inverse Fourier transform, u is a point in the pupil, H0 is the aperture mask (usually zero outside the pupil and one inside) and ϕk is the aberration phase associated with the kth diversity image.
The unknowns, f and the set {ϕk } of all aberration phases, will be determined by nonlinear optimization, minimizing the square-difference between observed (dk ) and predicted (sk * f , where * is convolution) images:
| (3) |
where Dk , F, Sk are the Fourier transforms of dk , f, sk respectively.
As shown previously [17,18], the penalty Eq. (3) can be converted to a pure function of the ϕk by substituting the analytic solution for the optimum F ,
| (4) |
where † is the complex conjugate, leading to a phase-only penalty function
| (5) |
We note that the second term does not depend upon the aberration. In minimizing the resulting penalty function, the speed of convergence is substantially enhanced by using the penalty gradient [18], which for our parametrization is
| (6) |
where
| (7) |
From Eqs. (1) and (2), note that the images are unchanged by adding a constant to ϕk (a “piston shift”). Thus, the mean value of ϕk is not meaningful. Moreover, the images are also unaltered by replacing ϕ(u) → −ϕ(−u), because this merely results in h(x) being replaced with its complex conjugate. In our calibration procedure, we used the knowledge that the actuators are arranged in a grid to ensure that a consistent sign convention was adopted for all actuators.
4. Parametrizations of the aberration function ϕ
For a parametric representation of {ϕk }, Eq. (6) allows the derivative with respect to any parameter p to be calculated via the chain rule,
| (8) |
4.A. Gaussian parametrization
Since individual actuators are expected to have a localized influence in the pupil plane, one simple (few-parameter) approximation of the aberration phase would be a Gaussian. (Here, the primary value of a Gaussian parametrization is to provide an initial guess for a more accurate method requiring more parameters.) We postulate that the phase aberration can be approximated as
| (9) |
where A is the amplitude of deformation, u0 is the center of deformation, and σ is the estimate of the width of the deformation. The partial derivative of ϕk with respect to the parameters is
| (10) |
| (11) |
| (12) |
Together with Eq. (6) and (8), these equations allow one to calculate the gradient of the penalty with respect to the parameters of the Gaussian.
4.B. Zernike parametrization
The most common way to parametrize aberrations is with a Zernike expansion [22],
| (13) |
where Zj is the jth Zernike function (using a single-indexing scheme [23]) and αj is the coefficient for the jth Zernike function.
The partial derivative of ϕk with respect to αj is simply
| (14) |
4.C. Biharmonic parametrization
An attractive alternative to these phenomenological parametrizations is to consider a direct physical model of the deformable mirror, i.e., parametrizing ϕ in terms of the shape of the surface of the mirror. In the general case, the alignment of the pupil with respect to the DM is unknown, and in any event the projection of the pupil onto the DM surface is “compressed” along one axis due to the angle of reflection off the surface (Fig. 1). These statements may be encapsulated as
| (15) |
where the matrix A and offset ξ0 correspond to a “rigid body deformation” of the pupil, and ψk (ξ) is effectively the mirror shape represented in two-dimensional coordinates ξ in the plane of the mirror. This representation thus casts the problem as fundamentally a rigid registration problem, but with respect to pupil coordinates (phase) rather than a registration of two observed images. A needs to allow rotation and scaling but not shearing (A = RSRT where R is a rotation matrix and S is diagonal), and thus is a generic 2×2 symmetric matrix
| (16) |
After fitting, the rotation angle and scaling diagonals may be extracted from a singular value decomposition of A; in particular, the absolute value of the ratio of the diagonals of S should be equal to the cosine of the angle of reflection off the mirror surface.
The form of ψ depends on the DM. For the Mirao 52-d, the linearity with respect to perturbation of individual actuators (see Fig. 5) suggests a model
Fig. 5.
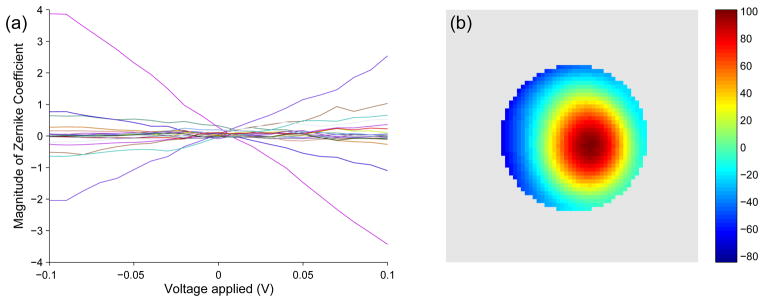
Actuator 22 calibration using a Zernike parametrization. (a) Each of the 20 Zernike coefficients varies nearly linearly with voltage. The slope of the relationship is plotted as a phase plot in (b). (b) The “single-hump” peak of the phase plot depicts the movement of the actuator at the location of the peak (colorbar units = radians/V).
| (17) |
where vki is the control voltage applied to the ith actuator in the kth diversity image, mi and ζi are the slope and offset for this actuator, respectively, and bi(ξ) describes the shape of the surface induced by applying “unit” voltage to the ith actuator. bi encapsulates the physics of the device, and in this case the necessary details (equation of motion and boundary conditions) are not publicly disclosed by the manufacturer. However, because this mirror is constructed from an elastic membrane, we postulate that the membrane energy is a function of the curvature, i.e.,
| (18) |
where ∇2 is the Laplacian with respect to coordinates ξ . Hence b satisfies the fourth-order biharmonic equation
| (19) |
This equation of motion needs to be supplemented by the boundary conditions, for which we will assume that the membrane is clamped at some radius R, and that this clamp sets both the membrane height and slope to zero on the boundary (b = 0 and r̂·∇b = 0 on the boundary, where r̂ is the unit radial vector). Consequently, application of a “unit” force at point c will induce a (normalized) displacement given by the Green’s function [24],
| (20) |
where ξ̃ = ξx + iξy is the complex number formed from the x- and y-coordinates of ξ and similarly for c̃. For each actuator, the corresponding ci is specified from the known grid arrangement of the actuators (Fig. 2a).
The advantage of this approach is in the comparatively small number of parameters required: rather than needing the first five orders of Zernike functions (20 Zernike coefficients for each actuator, a total of 1040 parameters), here each actuator is rep-resented by only two parameters, mi and ζi. Indeed, in a first-pass optimization one may take ζi = 0 and use a common value mi = m for all actuators (assuming that each electromagnet produces similar force), and thus all 52 actuators contribute just a single parameter, m. One also must fit R and the rigid-deformation parameters A and ξ0, and for calibration with a single bead we also modify Eq. (15) to allow a defocus,
| (21) |
to include the possibility that the bead is slightly above or below the focal plane (which may not be readily detectable in the “mirror flat” condition but can nevertheless have a substantial impact on the aberrated images). Consequently, this approach requires a total of either 8 parameters (A, ξ0, α, and m) or 110 parameters (A, ξ0, α, and susceptibility and offset, mi and ζi respectively, for each actuator).
Optimization of these parameters greatly benefits from an analytic calculation of the gradients; for reasons of space we do not present explicit formulas, but their derivation is entirely straightforward (if slightly tedious) from Eqs. (21) and (20). The initial guess for the 8-parameter model is supplied by the user with the help of a custom GUI program, to ensure that the pupil registration parameters do not get trapped in a local minimum far from the optimum solution.
5. Experiments
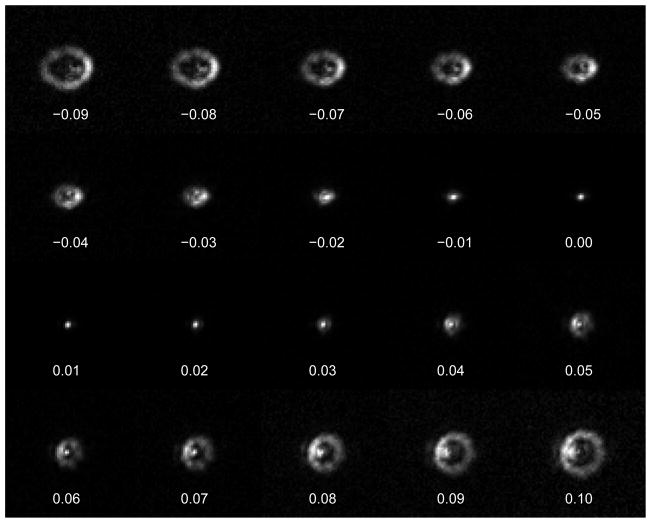
We imaged a 0.2 μm (diffraction limited) fluorescent bead embedded at the surface of a flat slab of poly-dimethylsiloxane (PDMS, Dow Corning, DC 184-A and DC 184- B with a weight ratio of 10:1). Each actuator was manipulated by applying voltages ranging from −0.1 V to 0.1 V with 0.01 V steps (all the other actuators were maintained at 0 V), and an image was collected at each step. Thus, we obtained 21 images for each of the 52 actuators, for a total of 1092 images. In Fig. 3 we show the images obtained by moving one of the actuators (actuator 22, see Fig. 2(a)) from −0.09 V to 0.1 V (data from all actuators is supplied as Movie 1).
Fig. 3.
The images of a 0.2 μm bead obtained after applying -0.09 V to 0.1 V to actuator 22 (see Fig. 2a for the location of the actuator). Each image is 64×64 pixels, with 1 pixel = 0.29 μm×0.29 μm. (All consequent bead images have the same dimensions). Movie 1 shows images obtained from moving each of the 52 actuators.
6. Results
6.A. Calibration of DM using Zernike parametrization
Each actuator was calibrated separately. The image-based wavefront reconstruction described in Section 3 was applied on the 21 images — obtained from applying different voltages to a single actuator — to calculate the unknown underlying aberration function ϕ.
In the optimization, the initial estimate of ϕ was created by fitting a Gaussian model of the aberration, which (having far fewer parameters) allowed for rapid and relatively exhaustive search. In Fig. 4 we show that the images obtained using Gaussian parametrization of ϕ yielded moderate agreement between experimental and calculated images. We expanded the ϕ obtained from the Gaussian parametrization in terms of the first five orders of Zernike functions (20 parameters in total per actuator), and used the obtained Zernike coefficients as the initial guess for the Zernike-based optimization. We found that the calculated estimate of ϕ did not improve substantially when larger number of Zernike functions were used (see Fig. 12).
Fig. 4.
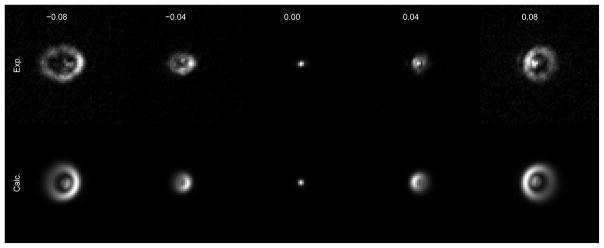
Measured (top) and calculated (bottom) images of a bead when different voltages (V) are applied to actuator 22. The calculated images were obtained from the calculated estimate of ϕ using Gaussian parametrization.
Fig. 12.
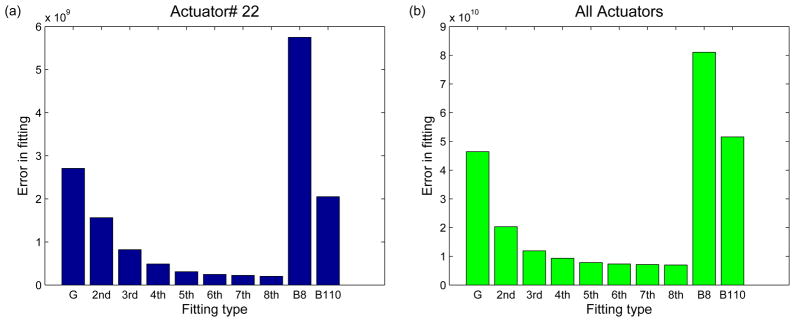
Comparison of fitting errors: (a) Fitting error between experimental and calculated images using different ϕ parametrizations, for actuator 22. The different parametrizations are Gaussian (G), from 2nd to 8th order Zernike parameters (2nd-8th), biharmonic parametrization using 8 parameters (B8), and biharmonic parametrization using 110 parameters (B110). (b) The total fitting error between the experimental and calculated images for all actuators.
In Fig. 5a we show the optimized values for the Zernike coefficients. Each of the Zernike parameters varies approximately linearly with voltage; the slope of the relationship is plotted as a phase plot in Fig. 5b. The “single-hump” peak depicts the movement of an actuator at the location of the peak. In Fig. 6 we demonstrate the accuracy of the calibration of one actuator (number 22, Fig. 2a) by showing the measured and calculated images for images obtained when different voltages are applied to this actuator.
Fig. 6.
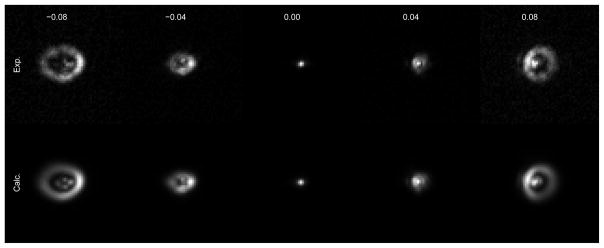
Measured (top) and calculated (bottom) images of a bead when different voltages (V) are applied to actuator 22. The calculated images were obtained from the Zernike parametrization. Movie 2 shows corresponding images obtained for all actuators.
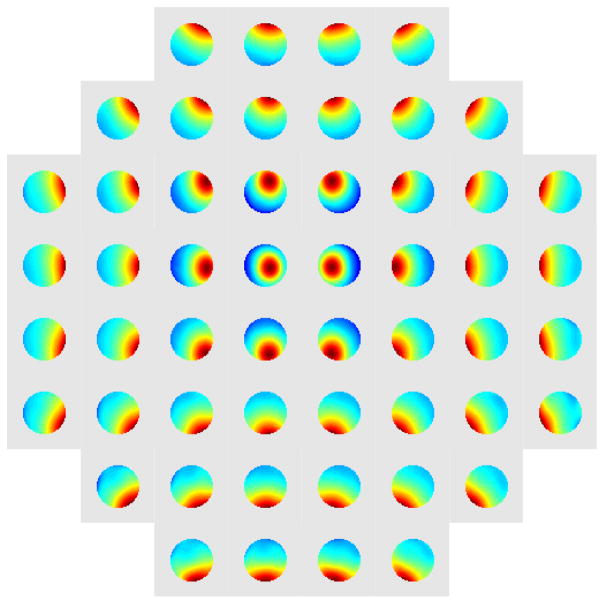
Each actuator was calibrated individually with an identical voltage series comprising 21 images. One observes that the resulting aberrations define a grid structure reminiscent, as one might expect, of the underlying grid of actuators (Fig. 7). To visualize the alignment between Fig. 2(a) and Fig. 7 one needs to reflect the DM actuator grid across the vertical. In Movie 2 we show the measured and calculated images obtained for all the actuators.
Fig. 7.
The phase plots obtained for all 52 actuators using Zernike parametrization. Each of the phase plots is scaled independently to demonstrate the underlying differences.
In Fig. 5a we can see that the Zernike coefficients have a non-zero component at zero applied voltage. This yields an estimate of the baseline aberrations of the system, which include any imperfections in the system optics (which tend to be small) and deviations in the mirror shape from nominally flat (which can be more substantial). In Fig. 8a we show that the zero-offsets measured for each of the actuators have similar values even though they were measured independently. By calculating the means of the offsets for each of the 20 Zernike coefficients, we estimated the shape of the mirror when all actuators are set to zero voltage (Fig. 8b). The flatness of the mirror can be improved by supplying an array of offset voltages v0, with
Fig. 8.
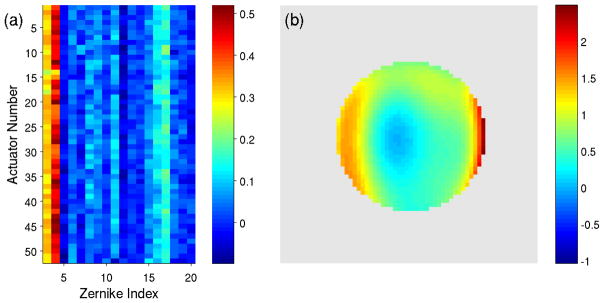
DM “flat” (a) Magnitude of Zernike coefficients for each of the actuators at zero applied voltage obtained from optimization of each actuator independently; note the consistency of the fitting result. The first two Zernike coefficients contribute to overall tip and tilt of the PSF, and are not shown in this figure. (b) The phase present at zero applied voltage (colorbar units = radians).
| (22) |
where Z0 is the vector of Zernike coefficients in the nominally-flat condition, M is the matrix formed from the slope of the Zernike coefficients for each actuator [Fig. 5a], and + denotes the Moore-Penrose pseudoinverse.
6.B. Calibration of DM using a physical membrane based model of DM
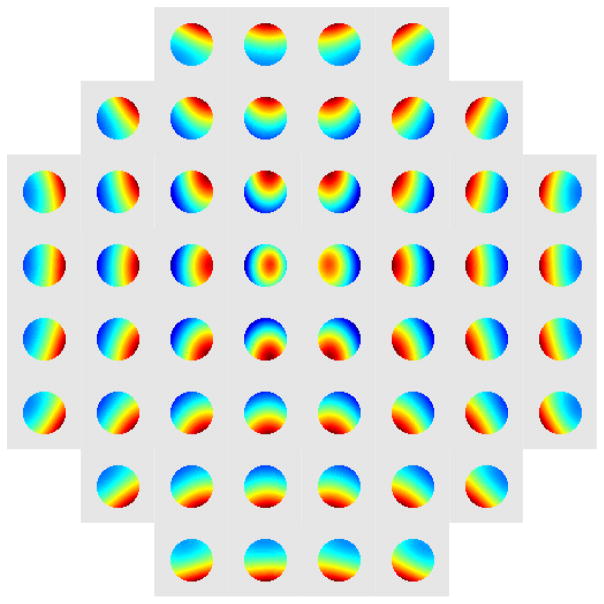
We performed the 8 parameter and 110 parameter biharmonic parametrization of the aberrations caused by individual actuators. The eight parameter model was obtained by using all the 21×52 images to fit the parameters A, ξ0, α, and a single value of m for all actuators, while setting ζ = 0. The resulting phases for each of the actuators are shown in Fig. 9.
Fig. 9.
The phase plot obtained for all 52 actuators using the 8 parameter biharmonic parametrization. Each of the phase plots is scaled independently to demonstrate the underlying differences.
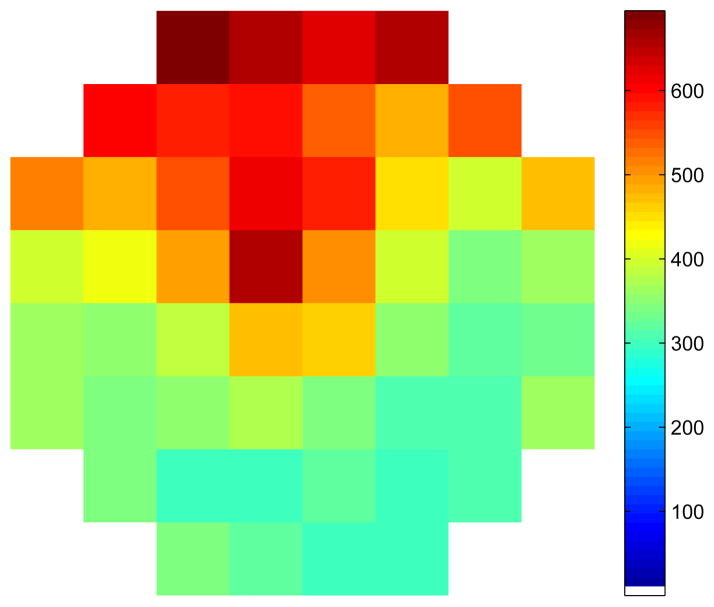
To obtain the actuator phases for the 110 parameter model, A, ξ0 and α were held constant while m and ζ were fit separately for each actuator. In Fig. 10 we show the value of mi obtained for each of the actuators. The mi values appear to be dependent on the location of the corresponding actuator—suggesting an underlying asymmetry in the DM.
Fig. 10.
The values of mi obtained for each of the actuators after a 110 parameter biharmonic parametrization of ϕ. colorbar units = radians/V.
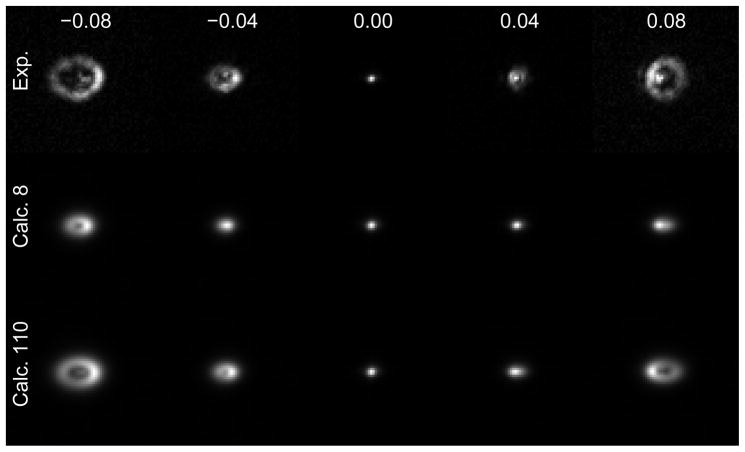
In Fig. 11 we show the experimental and calculated images (using biharmonic parametrization) obtained when voltage is applied to actuator 22. The quality of the agreement is lower than observed for the Zernike fit (Fig. 6). Therefore, henceforth we adopted the Zernike parametrization.
Fig. 11.
Measured (top) and calculated (middle, bottom) images of a bead when different voltages are applied to actuator 22. The calculated images were obtainedusing a biharmonic parametrization with 8 (middle) and 110 (bottom) parameters. Movie 3 shows corresponding images obtained for all actuators.
To quantitatively compare the different parametrizations implemented in this paper, we calculated the fitting error (given by Eq. (3)) for each of the cases (Fig. 12). Gaussian and biharmonic parametrizations lead to the greatest fitting error. The fit-ting error decreased as greater number of Zernike coefficients were used. Most of the decrease in fitting error was achieved by including Zernike polynomials up through 5th order, and so we truncated the expansion at this point for the tests described below.
6.C. Testing the calibration
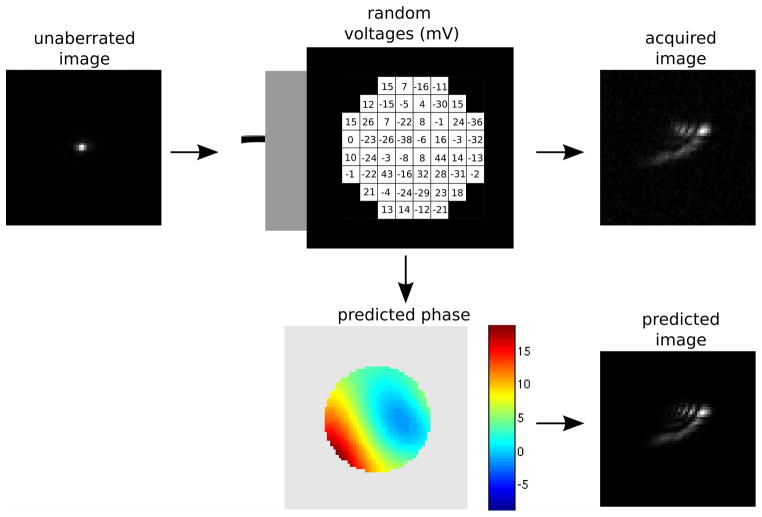
The calibration was performed individually for each actuator, yet for AO one must manipulate all of the actuators simultaneously to compensate for arbitrary aberrations. To test whether the calibration procedure suffices in this circumstance, we specified random voltages for all the actuators in the DM and measured the resulting images of beads. Using the Zernike calibration data, we estimated the total wavefront aberration as the linear sum of aberrations caused by individual actuators. This predicted aberration was then used to calculate the theoretical PSF to obtain a calculated estimate of the image. A schematic of the procedure is shown in Fig. 13 (see Movie 4). In the figure, the “unaberrated” image is the image acquired when all the actuators are set to zero voltage. The “predicted” aberrated image is produced by the convolution of the estimated wavefront aberration with a point (since the underlying object is unknown).
Fig. 13.
A random set of voltages are applied to the DM to produce the acquired image. The Zernike parametrization based calibration of the DM is used to calculate the predicted phase produced by the set of random voltages (colorbar units = radians). The predicted phase is then used to create the predicted image. The agreement between the acquired and predicted images demonstrates the accuracy of the calibration of the DM. Movie 4 shows images obtained from using the 50 sets of random voltages.
To explore whether the deviation from nominal “flatness” requires compensation, we considered the random voltage test both before and after correcting for the true mirror flatness (Fig. 14). The calculated images are modestly improved by including the flatness correction. We performed such a “random-voltage test” using 50 different sets of random voltages, with all of them leading to good agreement between the measured and calculated images (Fig. 14, Movie 4).
Fig. 14.
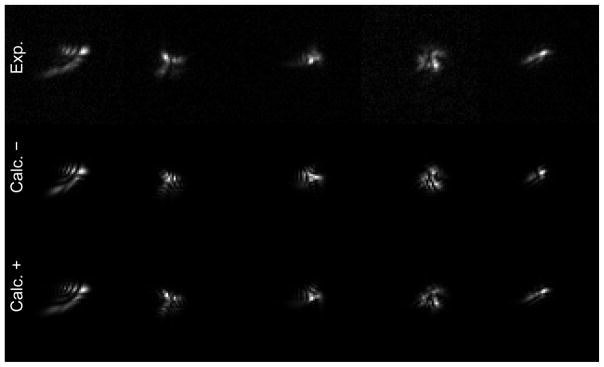
Sets of random voltages were applied to the DM to obtain the experimental (Exp.) images. Zernike based calibration of the DM was used without (Calc.-) and with (Calc.+) offset correction to obtain the calculated images for the given set of random voltages. Each column represents images obtained from a different set of random voltages.
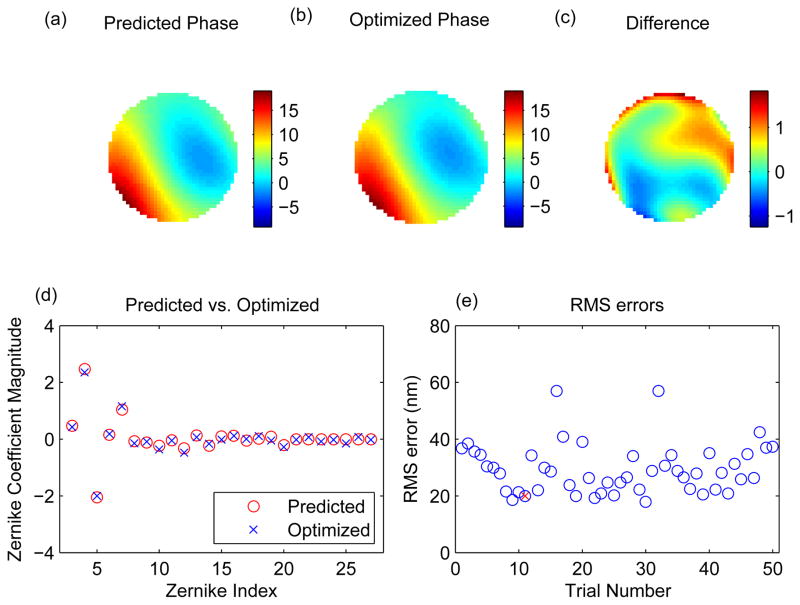
The accuracy of the calibration can also be tested by comparing the calibration-derived random aberration to the “true” random aberration. We calculated the “true” random aberration using PDI, as described in Section 3. We used the unaberrated image and the randomly aberrated image as the two input images, and optimized the phase. As an initial estimate we used the calibration-derived phase, which consisted of up to 5th order Zernike coefficients. To explore a possible role for the higher-order coefficients in representing the error, we extended the phase to consist of up to 6th order Zernike coefficient, setting the 6th order Zernike coefficients initially to zero. The Zernike coefficients were optimized to produce the optimum aberrated phase. Fig. 15 shows the calibration-derived phase (predicted phase), the PDI-derived phase (optimized phase) and the difference in the two phases for the images shown in Fig. 13. Fig. 15d shows that the calibration-derived estimates for the Zernike coefficients are very close to the optimized values. We performed the same calculation on each of the 50 sets of the random voltages tested (Movie 4) and plotted the RMS error in Fig. 15e. The RMS error averaged across realizations was ~30 nm, which is below the threshold for making a significant impact on image quality. Thus we conclude that the calibrated DM data yields an accurate model of the mirror.
Fig. 15.
(a) The predicted phase from calibration data (colorbar units = radians). (b) The optimized phase calculated using PDI on the unaberrated and aberrated images shown in Fig. 13. (c) The difference in the two phases. Note the colormap has been rescaled to show fine detail. (d) The Zernike coefficients for predicted (a) and optimized (b) phases. (e) The RMS error (in nm) between the two phases for all the 50 sets of random voltages tested. The red × represents the RMS error obtained for the example shown in (d).
7. Discussion
By using only an image-based analysis we have shown that MFBD can be used to accurately calibrate a DM. The decision whether to use MFBD or other methods depends upon several factors. (i) Equipment: MFBD-based calibration does not require specialized optical equipment such as SHWFS and interferometers. The MFBD method even avoids the need for a beam splitter [19]. (ii) Speed: The speed of wavefront sensing in SHWFS and interferometry — by virtue of being specialized devises to measure wavefronts — is near instantaneous. In MFBD-based calibration, the wavefront calculation is a computationally intensive process. The calibration of a single actuator, using 21 images (see Section 6) took ~3 minutes (this includes a preliminary GUI based Gaussian estimate, followed by a Zernike based optimization of the aberration function ϕ) on a 32 GB RAM, single core processor. Thus the calibration of the 52 actuator DM took ~2.5 hours. Fortunately such a CPU intensive calculation needs to be performed only once, during the construction of the microscope. (iii) Accuracy: The MFBD-based calibration is ultimately limited by the noise the images. We have shown that the method produces an error of ~30 nm, which is well below the threshold where the error has a significant impact on the image quality. We note that this accuracy compares well with previous studies [19], in that this represents the open-loop calibration error, and that it is a small fraction of a much larger underlying aberration (Figs. 12 and 15) of a type—generated by applying random voltages to all actuators—not included in the data used to perform the calibration.
We explored two different parametrizations for the phase aberration. The Zernike parametrization of the DM (using 1040 parameters) led to accurate calibration of the DM. The parametrization based on a physical model was attractive due to the smaller number of parameters (8 or 110). This reduction in number of parameters required to describe a 52 actuator DM can be attributed to the grid-like placement of the actuators on the DM and the physical characteristics of a membrane mirror. The physical model led to a useful but less-accurate calibration of the DM. We suspect this reflects the fact that the biharmonic model is an imprecise description of the underlying physics of the Mirao 52-d, for which important details are not publicly available. For example, if the membrane is under some tension, the equation of motion might require the addition to Eq. (18) of a term penalizing the gradient of b. Nevertheless, our results demonstrate that physical models have considerable potential for parametrizing aberrations with small numbers of parameters. Given that PDI/MFBD is fundamentally an optimization technique, reducing the number of parameters may improve the speed and/or robustness of convergence, potentially extending the range of applications of PDI.
MFBD was shown to be an accurate and efficient method for calibrating a DM in a light sheet microscope. A major advantage of this approach is that the hardware demands are minimal; most of the complexity is contained in the mathematical analysis and therefore encapsulated in software. We have made our software freely-available at http://holylab.wustl.edu (post-publication). These developments should contribute to more widespread application of AO in microscopy.
Acknowledgments
The authors thank Zhongsheng Guo for computational help. The research was supported by McKnight Technological Innovations in Neuroscience Award and the NIH (NINDS/NIAAA R01NS068409) (TEH).
Footnotes
OCIS codes: (110.1080) Active or adaptive optics; (180.2520) Fluorescence microscopy
References
- 1.Pawley JB. Handbook of biological confocal microscopy. 3. Springer; 2006. [Google Scholar]
- 2.Dirckx JJ, Kuypers LC, Decraemer WF. Refractive index of tissue measured with confocal microscopy. J Biomed Opt. 2005;10:44014. doi: 10.1117/1.1993487. [DOI] [PubMed] [Google Scholar]
- 3.Booth MJ. Adaptive optics in microscopy. Philos Transact A Math Phys Eng Sci. 2007;365:2829. doi: 10.1098/rsta.2007.0013. [DOI] [PubMed] [Google Scholar]
- 4.Turaga D, Holy TE. Miniaturization and defocus correction for objective-coupled planar illumination microscopy. Opt Lett. 2008;33:2302. doi: 10.1364/ol.33.002302. [DOI] [PubMed] [Google Scholar]
- 5.Holekamp TF, Turaga D, Holy TE. Fast three-dimensional fluorescence imaging of activity in neural populations by objective-coupled planar illumination microscopy. Neuron. 2008;57:661. doi: 10.1016/j.neuron.2008.01.011. [DOI] [PubMed] [Google Scholar]
- 6.Fuchs E, Jaffe JS, Long RA, Adam F. Thin laser light sheet microscope for microbial oceanography. Opt Express. 2002;10:145. doi: 10.1364/oe.10.000145. [DOI] [PubMed] [Google Scholar]
- 7.Huisken J, Swoger J, Del Bene F, Wittbrodth J, Stelzer EHK. Optical sectioning deep inside live embryos by selective plane illumination microscopy. Science. 2004;31:1007. doi: 10.1126/science.1100035. [DOI] [PubMed] [Google Scholar]
- 8.Dodt H-U, Leischner U, Schierloh A, Jahrling N, Mauch CP, Deininger K, Deussing JM, Eder M, Zieglgansberger W, Becker K. Ultramicroscopy: three-dimensional visualization of neuronal networks in the whole mouse brain. Nat Methods. 2007;4:331. doi: 10.1038/nmeth1036. [DOI] [PubMed] [Google Scholar]
- 9.Tyson RK. Introduction to adaptive optics. SPIE Press; 2000. [Google Scholar]
- 10.Porter J, Queener H, Lin J, Thorn K, Awwal A. Adaptive optics for vision science. Wiley-Interscience; 2006. [Google Scholar]
- 11.Poyneer LA. Scene-based Shack-Hartmann wave-front sensing: analysis and simulation. App Opt. 2003;42:5807. doi: 10.1364/ao.42.005807. [DOI] [PubMed] [Google Scholar]
- 12.Feierabend M, Ruckel M, Denk W. Coherence-gated wave-front sensing in strongly scattering samples. Opt Lett. 2004;29:2255. doi: 10.1364/ol.29.002255. [DOI] [PubMed] [Google Scholar]
- 13.Hermann B, Fernandez EJ, Unterhuber A, Sattmann H, Fercher AF, Drexler W, Prieto PM, Artal P. Adaptive-optics ultrahigh-resolution optical coherence tomography. Opt Lett. 2004;29:2142. doi: 10.1364/ol.29.002142. [DOI] [PubMed] [Google Scholar]
- 14.Booth MJ, Neil MAA, Juskaitis R, Wilson T. Adaptive aberration correction in a confocal microscope. PNAS. 2002;99:5788. doi: 10.1073/pnas.082544799. [DOI] [PMC free article] [PubMed] [Google Scholar]
- 15.Debarre D, Botcherby EJ, Watanabe T, Srinivas S, Booth MJ, Wilson T. Image-based adaptive optics for two-photon microscopy. Opt Lett. 2009;34:2495. doi: 10.1364/ol.34.002495. [DOI] [PMC free article] [PubMed] [Google Scholar]
- 16.Hanser BM, Gustafsson MGL, Agard DA, Sedat JW. Phase-retrieved pupil functions in wide-field fluorescence microscopy. J Microscopy. 2004;216:32. doi: 10.1111/j.0022-2720.2004.01393.x. [DOI] [PubMed] [Google Scholar]
- 17.Gonsalves RA. Phase retrieval and diversity in adaptive optics. Opt Eng. 1982;21:829. [Google Scholar]
- 18.Paxman RG, Schulz TJ, Fienup JR. Joint estimation of object and aberrations by using phase diversity. J Opt Soc Am A. 1992;9:1072. [Google Scholar]
- 19.Lofdahl MG, Scharmer GB, Wei W. Calibration of a deformable mirror and Strehl ratio measurements by use of phase diversity. Appl Opt. 2000;39:94. doi: 10.1364/ao.39.000094. [DOI] [PubMed] [Google Scholar]
- 20.Schulz TJ. Multi-frame blind deconvolution of astronomical images. J Opt Soc Am A. 1993;10:1064. [Google Scholar]
- 21.Fernandez EJ, Vabre L, Hermann B, Unterhuber A, Povazay B, Drexler W. Adaptive optics with a magnetic deformable mirror: applications in the human eye. Opt Express. 2006;14:8900. doi: 10.1364/oe.14.008900. [DOI] [PubMed] [Google Scholar]
- 22.Born M, Wolf E. Principles of optics. Pergamon press; 1986. [Google Scholar]
- 23.Noll RJ. Zernike polynomials and atmospheric turbulence. J Opt Soc Am. 1976;66:207–211. [Google Scholar]
- 24.Melnikov YA. Influence functions of a point force for Kirchoff plates with rigid inclusions. J Mechanics. 2004;20:249. [Google Scholar]


