Abstract
Proteins in the nucleus accumbens mediate many cocaine-induced behaviors. In an effort to measure changes in nucleus accumbens protein expression as potential biomarkers for addiction, coronal tissue sections were obtained from rats that developed behavioral sensitization after daily administration of cocaine, or from daily saline-treated controls. The tissue sections were subjected to matrix-assisted laser desorption/ionization (MALDI) mass spectrometry (MS) profiling and tissue imaging. For profiling experiments, brain sections were manually spotted with matrix over the nucleus accumbens, a brain region known to regulate cocaine sensitization. Summed mass spectra (10 000 laser shots, grid) were acquired and spectra were aligned to reference peaks. Using bioinformatics tools, eight spectral features were found to be altered by cocaine treatment. Based on additional sequencing experiments with MALDI tandem MS and database searches of measured masses, secretoneurin (m/z 3653) was identified as having an increased expression. In addition, the distribution of m/z 3653 in the nucleus accumbens was determined by MALDI tissue imaging, and the increased expression of its precursor protein, secretogranin II, was verified by immunoblotting.
Keywords: MALDI tissue imaging, MALDI profiling, cocaine addiction, secretoneurin, neuropeptides
Introduction
Drug addiction remains a serious health concern, and according to the 2007 report from the National Survey on Drug Use and Health, 1.6 million Americans abused or were dependent on cocaine during the previous year, underscoring the need to develop treatments for cocaine addiction.[1] Since addiction is characterized as an impairment in the ability to control drug-seeking behaviors, research examining the neurobiological underpinnings of addiction has focused on brain circuits, which are known to be critical for regulating homeostatic behavior. Accordingly, cocaine addiction has been shown to cause persistent neuroadaptations in the mesocorticolimbic dopaminergic and corticostriatal glutamatergic projections.[2] An important anatomical structure in common between these projections is the nucleus accumbens (NAc) which receives glutamatergic inputs from the prefrontal cortex (PFC) that initiates drug seeking once this maladaptive behavior is well-learned.[2] Repeated cocaine administration leads to persistent alterations in NAc proteins such as GluR1,[3] actin-binding proteins,[4] ERK2 and AMPA receptor surface expression[5] and causes a progressive increase in locomotor activity that is termed behavioral sensitization.[6–8] For example, levels of GluR1 expression correlate with the appearance of behavioral sensitization,[3,5] thus suggesting a functional relationship between proteins and cocaine-induced sensitized behavior. In humans, sensitization may reflect an increase in attention and motivational focus on cocaine and cocaine-related stimuli.[9] Accordingly, investigating cocaine sensitization-induced protein dysregulation could reveal novel pharmacotherapeutic targets or biomarkers for addiction.
Recent advances in matrix-assisted laser desorption/ionization (MALDI) mass spectrometry (MS) permit profiling of proteins directly from frozen tissue sections.[10–12] In a MALDI MS tissue profiling experiment, matrix solution is applied directly to tissue structures of interest and mass-to-charge (m/z) signals in the MALDI mass spectrum, which can represent lipids,[13] drug compounds,[14] peptides or proteins[15] depending on the tissue preparation method, are detected from the prepared tissue region only. Advantages of this method over traditional proteomic approaches include relatively simple sample preparation, no analyte extraction and separation, and the maintenance of spatial information. Generally most signals detected are below 50 kDa, although higher mass signals can be detected using more specialized tissue preparation methods.[16] Together with statistical methodologies, this technology has been used to identify biomarkers of nephropathy in rats[17] and non-small-cell lung cancer from human tissue biopsies.[18] In protein and peptide MALDI tissue imaging, matrix solution is usually applied either by a spray of fine droplets, which results in a thin, homogenous layer of matrix across the entire tissue, or in a high density microdroplet array using an automated deposition instrument.[12] The MALDI laser is then raster scanned across the entire tissue section, and a mass spectrum collected at each sampling location. Data are displayed by plotting the intensity of any m/z signal observed as a function of sampling position to produce two-dimensional ion density maps, or MALDI images, where each m/z signal represents a protein form or peptide.[12] Other researchers have been successful in detecting and localizing small molecules such as chlorisondamine and cocaine in rat brain tissue with MALDI tissue imaging techniques.[19] In the present study, we applied a combination of MALDI MS tissue profiling, MALDI MS tissue imaging and bioinformatic analysis to determine differences in protein expression and localization in the NAc of cocaine-sensitized rats.
Experimental
Tissue preparation
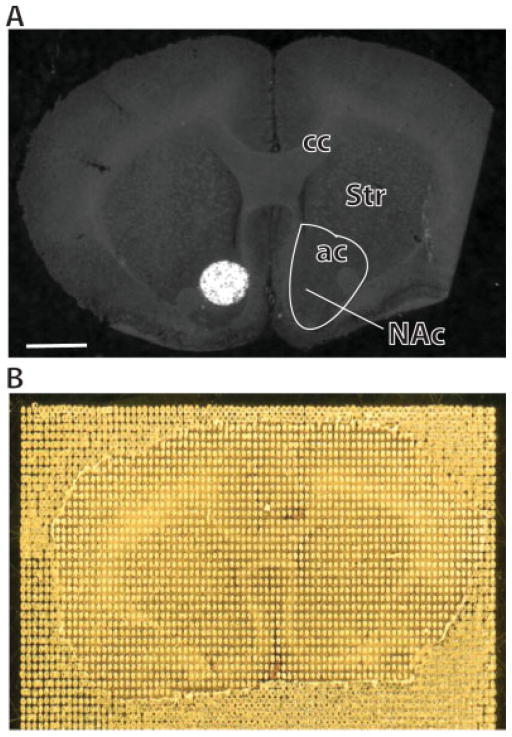
Male rats (N = 18, 9 animals per group, 200–250 g) were purchased from Charles River Laboratories and housed with food and water provided ad libitum using a 12-h light/dark cycle with the light cycle starting at 6 am. All experiments were conducted in accordance with the National Institutes of Health Guidelines for the Care and Use of Laboratory Animals. On days 1 and 7 rats were injected with 15 mg/kg cocaine i.p. and 30 mg/kg was administered on days 2–6, while control rats received saline injections on all days. Locomotor activity was assessed on days 1 and 7 in computer-monitored, photocell activity boxes. Fifteen mg/kg of cocaine was administered on days 1 and 7 because this dose produces submaximal locomotor activity, thereby allowing locomotor sensitization to be more readily observed. After daily treatment, animals remained in their home cages for 21 days of withdrawal. For MALDI profiling experiments, rats were decapitated and the brains rapidly frozen at −80 °C until sectioning. Brains were sectioned at −20 °C into 12 μm-thick coronal tissue sections (bregma 2.28–1.44 mm[20]) using a disposable blade stage-equipped cryostat (Microm HM 550, Walldorf, Germany). Every third tissue section was thaw-mounted onto an indium tin oxide-coated conductive glass slide (Bruker Daltonics, Billerica, MA). Data were collected on six sections per animal. Control and cocaine-treated animal brain sections from the same brain region were mounted on the same conductive glass slide to treat paired sections in an identical manner. Tissue sections were bath-washed successively for 45 s each in 70% ethanol, 95% ethanol and 100% ethanol which facilitated matrix crystal formation by fixing the tissue and washing away physiological salts and lipids. After air-drying, 0.06 μl of matrix solution (15 mg/ml Sinapinic acid in 50% acetonitrile (ACN)/0.3% trifluoroacetic acid (TFA)), was manually spotted three times on the NAc (Fig. 1(A)) of each section, with air-drying in between successive spot applications. Dried, prepared NAc regions were subjected to MALDI MS profiling analysis.
Figure 1.
Example of MALDI matrix spotting on the nucleus accumbens. Matrix solution (0.06 μl) consisting of 15 mg/ml sinapinic acid in 50% acetonitrile/0.3% TFA was manually spotted in triplicate on the NAc for MALDI profiling experiments (A). For MALDI tissue imaging analysis, automated matrix deposition was carried out using a Portrait 630 acoustic reagent multispotter. Forty passes of one spot (170 pl) per pass of 15 mg/ml sinapinic acid in 50% ACN/0.3% TFA were applied with a center-to-center spot distance of 200 μM (B). ac, anterior commissure; cc, corpus callosum; Str, ventromedial striatum. Scale bar = 1 mm.
For MALDI tissue imaging analysis, automated matrix deposition was carried out using a Portrait 630 acoustic reagent multispotter (Labcyte Inc., Sunnyvale, CA). Forty passes of one spot (170 pl) per pass of 15 mg/ml sinapinic acid in 50% ACN/0.3% TFA were applied with a center-to-center spot distance of 200 μM (Fig. 1(B)). This array printing method ensured no contamination of adjacent matrix spots.
For MALDI–LTQ ion trap tandem MS, images obtained from the MALDI tissue imaging were used to guide dissection of the medial brain region, including nucleus accumbens, from a frozen control rat brain using a scalpel blade. Extracted tissue was homogenized in 50% ACN/0.3% TFA. Tissue debris was pelleted for 20 min at 12 000 g using an Eppendorf 5415 C benchtop centrifuge (Eppendorf, Hamburg, Germany) at 4 °C. The supernatant was removed, dried using a SPD SpeedVac© (ThermoFisher Scientific, Waltham, MA), and reconstituted in 100 μl of 10% ACN/0.1% TFA. Twenty-five microliters of sample was de-salted using a C18 zip tip (Millipore, Billerica, MA), and bound peptides eluted in 1 μl of matrix solution containing 20 mg/ml sinapinic acid in 50% ACN/0.3% TFA and saturated α-cyano-4-hydroxycinnamic acid in 70% ACN/0.15% TFA (1 : 1, v/v).
MALDI MS
MALDI MS profiling analyses were performed using a Bruker Autoflex III time-of-flight (TOF) mass spectrometer (Bruker Daltonics, Billerica, MA), operating in the linear, positive ion mode with optimized delayed extraction time. Prior to data collection, a linear, external calibration was applied to the instrument using Bruker Protein Standard 1 (bovine insulin, equine cytochrome C, bovine ubiquitin I, equine myoglobin, Bruker Daltonik, Bremen, Germany). Mass spectra from m/z 3000–30 000 were collected in a user-defined 4 × 5 grid pattern of 20 individual sampling locations, within a single spot, which encompassed the entire matrix-spotted NAc region. At each individual sampling location, 500 laser shots were used to acquire a mass spectrum. Mass spectra from each individual sampling location in the 4 × 5 grid were summed, making a total of 10 000 individual laser shots in each summed mass spectrum, which provided high-definition protein profiles across the core and shell subcompartments of NAc. To investigate potential differences in protein profiles of the control and cocaine-treated animals, summed mass spectra were subjected to statistical analysis.
MALDI MS tissue imaging analyses were performed in positive ion mode at +20 kV accelerating potential on a Bruker Autoflex II linear TOF mass spectrometer (Bruker Daltonics, Billerica, MA), which was equipped with a Smartbeam laser capable of operating at a repetition rate of 200 Hz. Following application of a linear, external calibration, mass spectral data sets were acquired over whole rat brain sections using flexImaging™ software (Bruker Daltonik, Bremen, Germany) in the mass range of m/z 3000–30 000, with a raster step size of 200 μM and 200 laser shots per spectrum. After data acquisition, MALDI images were reconstituted using the flexImaging™ software. Each m/z signal was plotted ±0.1% mass-to-charge units. For display purposes, data were interpolated and pixel intensities were rescaled in flexImaging™ for each individual signal to utilize the entire dynamic range.
MALDI–LTQ ion trap tandem mass spectra of m/z 3653 were collected using a MALDI Duo ion trap instrument (ThermoFisher Scientific, Waltham, MA) operating in high mass mode. The precursor ion was isolated with a 4-amu wide window centered on the precursor m/z value and subjected to collision-induced dissociation with collision energy set to 80%.
Data analysis, algorithm design and database searching
Algorithms for smoothing, baseline correction and normalization were applied to each of the summed MALDI mass spectra from the NAc profiling experiments, and the preprocessed spectra were saved for further analysis. MALDI spectra were first preprocessed to reduce noise, eliminate the non-informative baseline and normalize the intensity. The Whittaker smoother, with d = 3 and λ = 104, was used to smooth each of the spectra.[21] The penalty term (λ) was chosen to reduce loss of potentially informative peaks in the spectrum, and the difference order (d) was selected to reduce the effects of smoothing on sharp peaks. For each spectrum, the non-informative baseline was estimated using asymmetric penalized least squares as described in Ref. [22]. subtracted from the smoothed spectrum, and the resulting spectra were then normalized to total ion current. Iterative baseline estimation was accomplished with 20 iterations of the referenced algorithm using second differences, a roughness penalty of λ = 1011 and p = 0.0005. Candidate features were identified from the average spectrum as suggested in Ref. [23]. The smoothed, baseline-corrected and normalized spectra were aligned to a common m/z scale and averaged. Peaks in the average spectrum were located and identified by the positions (on the m/z scale) of the two minima bounding the peak to give a m/z window for each peak. Peaks with signal to noise ratios below 4 were eliminated from further consideration leaving 164 candidate features. For each candidate feature, its measure in a given spectrum is taken as the log-transformed maximum intensity within the associated m/z window. To identify spectral features related to treatment (cocaine vs saline) and section (anterior to posterior gradient), we employed linear regression on the log-transformed intensities. The model used here included factors for sample pair, treatment group, section and interaction between treatment and section. For each of the 164 candidate features, data from the 105 spectra were fitted to the following model
| (1) |
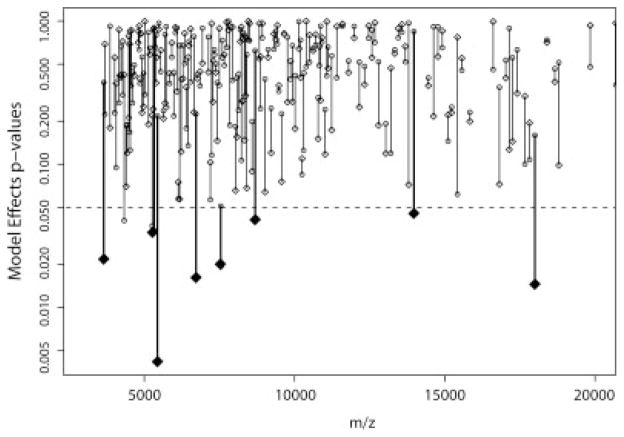
where, I is the observed feature intensity, E the sample pair (categorical), T the treatment group (categorical, saline or cocaine), S the section (treated as a continuous variable capturing the possible gradient in expression across sections), ST the interaction of section and treatment (capturing changes in the slope of the gradient due to treatment), and ε the sources of variation not explained elsewhere in the model. Features were selected for further consideration when the treatment effect (β2) in the model fitted to that feature’s data satisfied β2 ≠ 0 with p < 0.05 (Fig. 2). All computations were executed using the R language and statistical computing environment, version 2.3.0.[24] Spectrum preprocessing software was implemented in R using the Matlab code provided in Refs [21] and [22] as guidance.
Figure 2.
Spectral feature selection measures. Feature intensities (n = 164) were fitted to the algorithm and p-values for the treatment effect and the treatment-section interaction term were computed. For each feature the p-values for the treatment effect (diamond) and the section (circle) were plotted at the mean m/z value of the feature. p-values below the dashed line, shown as enlarged filled diamonds, indicate a significant difference between treatments (p < 0.05) and were considered further. In addition, treatment-section interactions, but not section-only effects, were included in the results.
Selected features were searched with TagIdent on www.expasy.ch over a molecular range of 0.1% and specifying ‘mammalian’ as classification species. TagIdent allows the generation of a list of proteins close to a given MW and/or pI[25] and searches the UniProtKB/Swiss-Prot databases for possible matches. Therefore, putative protein identifications can be made according to their mass, if this mass has been determined by MS.[25] For identification of m/z 3653, the nonredundant National Center for Biotechnology Information (NCBI) and Swiss-Prot databases were searched with tandem mass spectral data using the MS-Tag algorithm of Protein Prospector (University of California, San Francisco, CA).
Western blotting
In a separate group of rats (N = 8 animals per group), the NAc was dissected from the brain after the animals were killed by decapitation to measure secretogranin II-like immunoreactivity. Briefly, the tissue was homogenized in RIPA buffer with HALT protease and phosphatase inhibitors (Pierce, Rockford, IL) and centrifuged for 10 min at 12 000 × g. Protein concentration was determined by the bicinchoninic acid (BCA) assay. Samples were denatured, reduced in sample buffer, and loaded on a 10% Criterion XT Bis–Tris gel with MOPS running buffer (Bio-Rad, Hercules, CA). The proteins were transferred onto a polyvinylidene fluoride (PVDF) membrane with an iBlot dry blotting system (Invitrogen, Carlsbad, CA), blocked in 5% milk in TBS-Tween, and incubated overnight at 4 °C in mouse anti-secretogranin II (Abcam, 1 : 1000). After extensive washing in TBS-Tween (3 × 10 min), the membranes were probed with goat anti-mouse horseradish peroxidase (HRP) conjugated antibodies (Millipore, 1 : 10 000). The membranes were incubated in SuperSignal West Pico chemiluminescent substrate (Pierce, Rockford, IL) and exposed to ECL Hyperfilm (GE Healthcare, Pittsburgh, PA). Protein bands were quantified using Quantity One densitometry software (Bio-Rad, Hercules, CA) and normalized against levels of GAPDH (Cell Signaling, 1 : 1000).
Results and Discussion
Cocaine sensitization
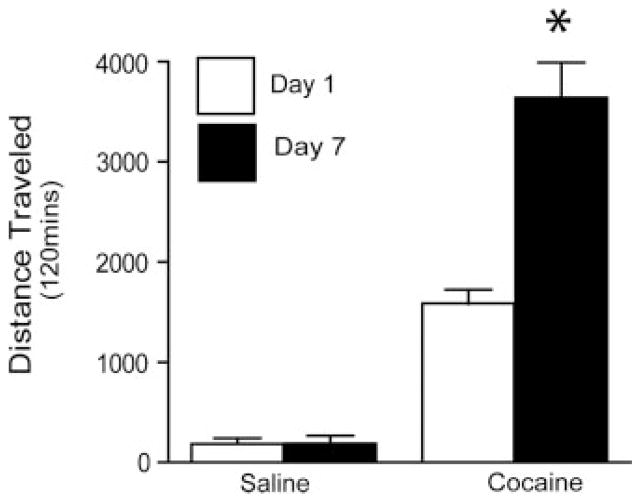
Cocaine sensitization in humans is suggestive of an increase in attention and motivational focus on cocaine and cocaine-related stimuli.[9] The development of this increase in attention and motivation may mediate the progressive increase in enduring neuroadaptations and cocaine craving during withdrawal that characterize cocaine addiction.[26] The sensitization treatment protocol resulted in greater locomotor activity on day 7 than on the first day of cocaine administration in the rats used for MALDI MS tissue profiling [F(3, 44) = 70.89; p < 0.001] (Fig. 3). On the contrary, repeated saline administration did not sensitize locomotor behavior.
Figure 3.
Locomotor behavior in sensitized rats. On day 1 and 7 rats were injected with 15 mg/kg cocaine and 30 mg/kg was administered on days 2–6. This treatment protocol produced a sensitized locomotor response to the 15-mg/kg dose of cocaine as measured on day 7 compared to day 1. N = 9/group. * p ≤ 0.001 comparing saline with cocaine day 1 and cocaine day 7 using a Tukey’s post hoc analysis.
MALDI profiling features and database searching
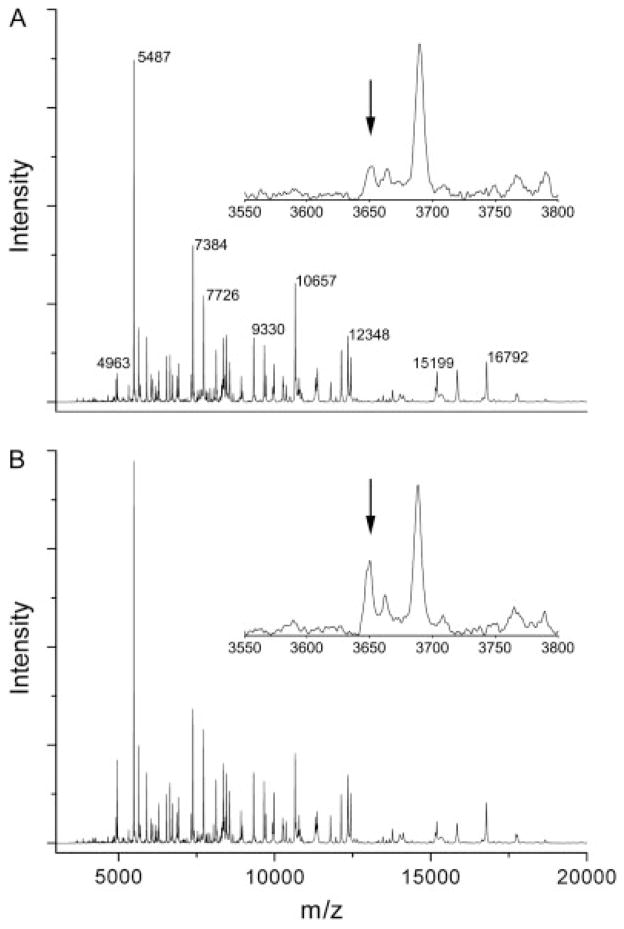
MALDI tissue profiling is a new potential diagnostic tool for disease; however, concerns exist regarding the reproducibility of MALDI protein profiling.[27] These concerns can be addressed by performing replicate biological measurements and by using algorithms for mass spectral normalization and peak detection. Here spectra were aligned and intensities normalized to allow determination of significant differences in signal intensities. Eight spectral features showed a significant treatment effect between saline and cocaine-sensitized rats (Fig. 2). These were m/z 3653 [F(1, 92) = 5.44, p = 0.02], m/z 5327 [F(1, 92) = 4.60, p = 0.03], m/z 5438 [F(1, 92) = 8.62, p = 0.004], m/z 6722 [F(1, 92) = 5.99, p = 0.01], m/z 7544 [F(1, 92) = 5.66, p = 0.01], m/z 8688 [F(1, 92) = 4.29, p = 0.04], m/z 13 973 [F(1, 92) = 4.11, p = 0.04] and m/z 17 999 [F(1, 92) = 6.20, p = 0.01]. Features at m/z 3653 (Fig. 4(A)) and m/z 17 999 were increased in cocaine-sensitized rats, while the other features were decreased. In addition, the two-way ANOVA also revealed one feature (m/z 7544) that showed not only a difference between cocaine and saline treatment, but also showed a significant treatment X section interaction [F(1, 92) = 3.90, p = 0.05]. Thus, the distribution of this feature changed between the treatment groups from the anterior (section 2) to the posterior (section 7) sections, with the expression of m/z 7544 being lower in the cocaine animals in the anterior, but not posterior regions of the NAc (Fig. 4(B)). Examples of the MALDI spectra processed for bioinformatic analysis are shown in Fig. 5, with the intensity difference in m/z 3653 highlighted (Fig. 5, inset).
Figure 4.
Data and section-dependent mean ± SEM for feature m/z 3653 (A) and m/z 7544 (B). Observed mean ± SEM, following adjustment for experiment variation, are plotted against the section for cocaine- (red) and saline-treated (black) animals.
Figure 5.
Representative MALDI-TOF protein profiles of NAc from control and cocaine-sensitized animals. Full mass spectra from (A) saline control and (B) cocaine-sensitized rats indicating similar protein profiles from the two treatment groups. Insets are zoomed regions of each spectrum between m/z 3550 and 3800, showing the increase in m/z 3653 in cocaine-sensitized animals (arrows).
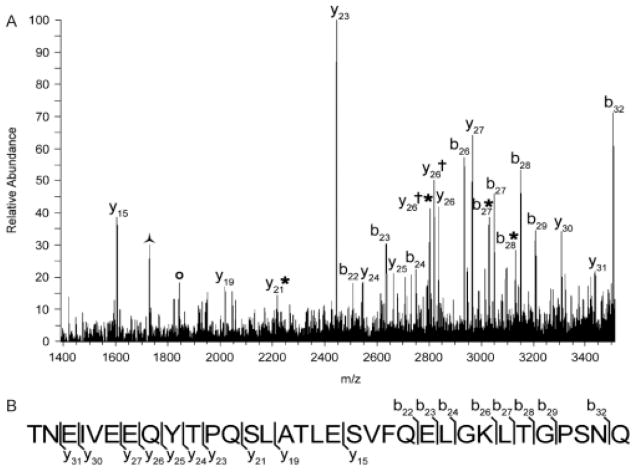
To generate a list of possible identities for the m/z signals which changed with cocaine sensitization, protein databases were interrogated using the TagIdent tool (www.expasy.ch). Of particular interest was the result for m/z 3653, which suggested that m/z 3653 is secretoneurin, as the calculated rat molecular weight (3652 Da) matched the observed m/z ratio (m/z 3653) (Table 1). Because of the known roles that secretoneurin plays in neurotransmission, m/z 3653 was focused upon for further identification. Tandem mass spectral analysis confirmed the identity of m/z 3653 as secretoneurin (Fig. 6). In addition, searching of protein databases [NCBI (nonredundant) and Swiss-Prot] using the MS-Tag algorithm of Protein Prospector (University of California, San Francisco, CA) with fragment ion information acquired from the tandem mass spectrum returned the protein secretogranin II, from which secretoneurin is cleaved, as the strongest match (discriminant score = 43.3). All other protein matches, which included hypothetical proteins (Swiss-Prot) and synaptonemal complex protein 1 [NCBI (nonredundant)], returned discriminant scores of ~28 and were not considered strong matches. Taken together, these data indicate that the signal at m/z 3653 is indeed secretoneurin.
Table 1.
Database searching of UniProtKB/Swiss-Prot with TagIdent
| Feature | Mw range | Proteins in Mw range | Mw | UniProtKB/Swiss-Prot |
|---|---|---|---|---|
| 3653 | 3649.347–3656.653 | Secretoneurin (rat) | 3652 | P10362 |
| Secretoneurin (mouse) | 3652 | Q03517 | ||
| Secretoneurin (Sumatran orangutan) | 3649 | Q5R4M6 | ||
| Early placenta insulin-like peptide B chain (chimpanzee) | 3652 | Q5CZK6 | ||
| Early placenta insulin-like peptide B chain (human) | 3652 | Q14641 | ||
| Isoform 4 of Kallikrein-8 (human) | 3653 | O60259-4 | ||
| Neuromedin-B-32 (pig) | 3654 | P01297 |
Figure 6.
Identification of m/z 3653. (A) Tandem mass spectrum obtained from a MALDI–LTQ ion trap instrument of m/z 3653. Fragment ions confirm the identity as secretoneurin. *, loss of water; †, loss of ammonia;
 , internal fragment representing secretoneurin residues 11–26;
 , internal fragment representing secretoneurin residues 11–27. (B) Annotated rat secretoneurin sequence showing extensive sequence coverage of the neuropeptide in the tandem mass spectrum.
Secretoneurin is cleaved from the full-length protein secretogranin II in the neurosecretory granules (large dense core vesicles) during fast axonal transport to form the active neuropeptide.[28] Prohormone convertases (PC)-1 and PC-2 can both cleave secretogranin II at sites of pairs of basic amino acids, but only PC-1 is capable of producing secretoneurin.[29] Secretoneurin was increased in cocaine-sensitized rats (Figs 4 and 5) and localized to the medial portions of the NAc, termed the ‘shell’ subcompartment, as well as the contiguous ventromedial region of the striatum (Fig. 7(A)). This spatial localization is consistent with previous immunolocalization studies of secretoneurin.[30] Fig. 7(B) shows the distribution of the 14.2 kDa isoform of myelin basic protein (predicted m/z 14 123) in the same section as Fig. 7(A), which served as an imaging method control. The 14.2 kDa form of myelin basic protein, which is the major rat brain isoform[31] and has previously been mapped and identified by MALDI imaging in the rat brain,[32] was observed in the imaging data set ±0.1% mass units from the predicted mass. Additional confirmation of the increase in secretoneurin was obtained by Western blotting for its full-length protein, secretogranin II, which was also increased in the NAc of cocaine-sensitized rats [t(14) = 2.23; p = 0.04 (Fig. 8)]. Thus, the increase in secretoneurin in cocaine-sensitized rats corresponded with an increase in secretogranin II as shown by Western blotting.
Figure 7.
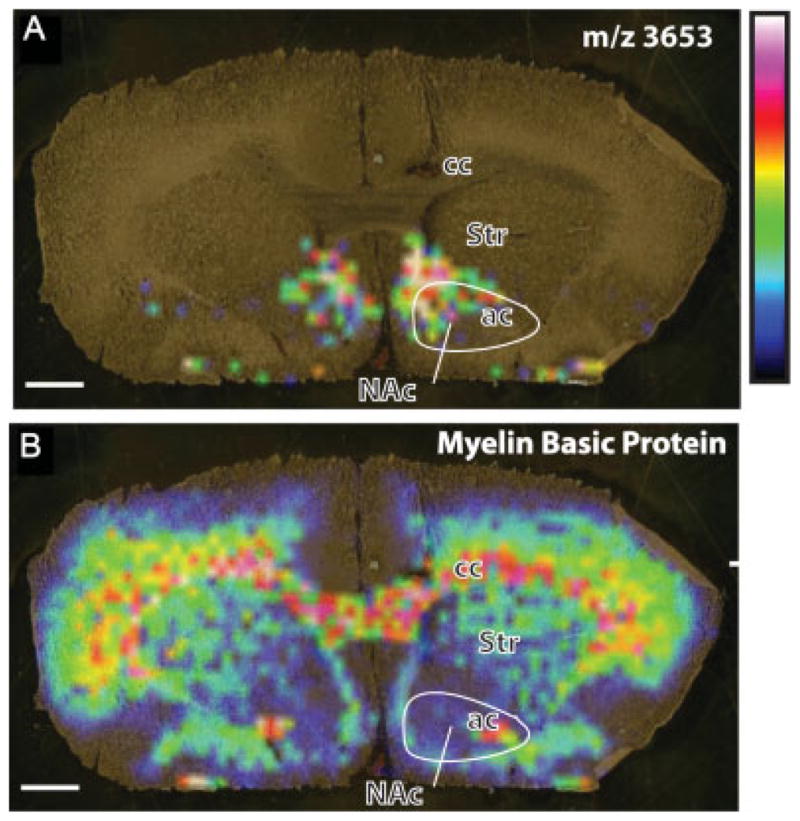
MALDI MS tissue images of cocaine-sensitized rat brain. (A) Distribution of m/z 3653 illustrating the location of this protein in predominantly the medial NAc and ventromedial striatum (Str). (B) Myelin basic protein isoform 4 (observed m/z 14138, predicted m/z 14123) illustrates landmark fiber tracts in the same section as in panel A. Color code illustrates relative signal intensity (blue lowest, white highest). ac, anterior commissure; cc, corpus callosum. Scale bar = 1 mm.
Figure 8.
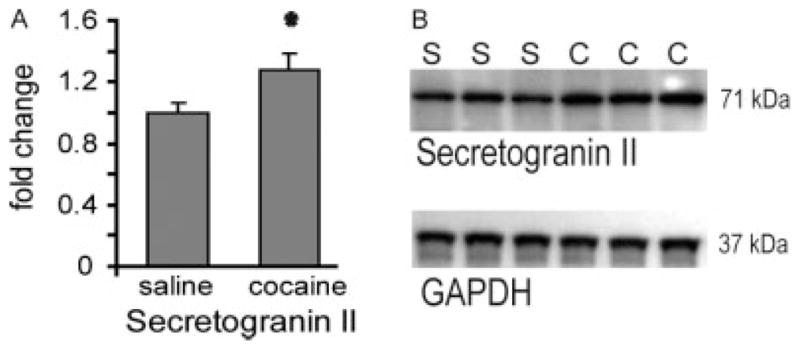
Western blot analysis of secretogranin II. (A) Secretogranin II was upregulated following 3 weeks of abstinence after cocaine sensitization. Data points are depicted as mean ± SEM fold change in optical density from saline (S) and cocaine (C) animals. N = 8/group. * p ≤ 0.05 comparing S with C using a Student’s t-test. Data were normalized using GAPDH as loading control. (B) Representative secretogranin II and GADPH immunoblot.
Secretoneurin increases dopamine release in vitro[33] and in vivo[34] in the striatum. This is particularly interesting as dopamine in the ‘shell’ subcompartment of the NAc contributes to cocaine-induced reinstatement of drug seeking in an animal model of cocaine self-administration.[35,36] In addition, other investigators have shown an increase in peptide 516–526 (PELLNTNQLKR) of secretogranin II in the hypothalamus of mice treated with chronic cocaine, using stable isotope labeling and ESI-Q-TOF MS.[37] However, contrary to our results, this change was not detected in the striatum of the cocaine-treated mice. As the NAc constitutes no more than 20% of the total striatal volume, it is possible that a change in secretoneurin restricted to the shell of the NAc would not be evident in an assay of the entire striatum. Also, the difference between the two studies may arise in part from the use of different species and cocaine treatment protocols. In addition to secretoneurin, other m/z signals were found to change in response to cocaine treatment. Additional tandem MS analyses were performed to identify these signals, but were unsuccessful. A possible explanation is the limitation of the MALDI–LTQ ion trap mass spectrometer to provide reliable fragmentation spectra of ions above m/z 4000.
Conclusion
The present study shows an increase in secretoneurin in cocaine-sensitized rats using MALDI tissue profiling. The potential relevance of this finding is that cocaine sensitization is associated with enhanced release of dopamine,[2] and secretoneurin is a positive regulator of dopamine release. If future behavioral experiments reveal that the cocaine-induced elevation in dopamine release is indeed mediated by the increased levels of secretoneurin, this peptide neuromodulator becomes a potential target for the development of novel pharmacotherapies for treating addiction. In addition, this study illustrates the utility of proteomics in understanding the biology of addiction.
Acknowledgments
The authors acknowledge use of MS instrumentation in the MUSC Proteomics Center and the Vanderbilt University Mass Spectrometry Research Center. This research was supported by USPHS grants DA015369 (PWK) and DA015851 (PWK).
References
- 1.Cheng RK, Ali YM, Meck WH. Neurobiology of Learning and Memory. 2007;88:149. doi: 10.1016/j.nlm.2007.04.005. [DOI] [PubMed] [Google Scholar]
- 2.Kalivas PW, O’Brien C. Neuropsychopharmacology. 2008;33:166. doi: 10.1038/sj.npp.1301564. [DOI] [PubMed] [Google Scholar]
- 3.Churchill L, Swanson CJ, Urbina M, Kalivas PW. Journal of Neurochemistry. 1999;72:2397. doi: 10.1046/j.1471-4159.1999.0722397.x. [DOI] [PubMed] [Google Scholar]
- 4.Toda S, Shen HW, Peters J, Cagle S, Kalivas PW. Journal of Neuroscience. 2006;26:1579. doi: 10.1523/JNEUROSCI.4132-05.2006. [DOI] [PMC free article] [PubMed] [Google Scholar]
- 5.Boudreau AC, Wolf ME. Journal of Neuroscience. 2005;25:9144. doi: 10.1523/JNEUROSCI.2252-05.2005. [DOI] [PMC free article] [PubMed] [Google Scholar]
- 6.Post RM, Rose H. Nature. 1976;260:731. doi: 10.1038/260731a0. [DOI] [PubMed] [Google Scholar]
- 7.Kalivas PW, Sorg BA, Hooks MS. Behavioural Pharmacology. 1993;4:315. [PubMed] [Google Scholar]
- 8.Kalivas PW, Stewart J. Brain Research Brain Research Reviews. 1991;16:223. doi: 10.1016/0165-0173(91)90007-u. [DOI] [PubMed] [Google Scholar]
- 9.Robinson TE, Berridge KC. Brain Research Brain Research Reviews. 1993;18:247. doi: 10.1016/0165-0173(93)90013-p. [DOI] [PubMed] [Google Scholar]
- 10.Caldwell RL, Caprioli RM. Molecular and Cellular Proteomics. 2005;4:394. doi: 10.1074/mcp.R500006-MCP200. [DOI] [PubMed] [Google Scholar]
- 11.Laurent C, Levinson DF, Schwartz SA, Harrington PB, Markey SP, Caprioli RM, Levitt P. Journal of Neuroscience Research. 2005;81:613. doi: 10.1002/jnr.20590. [DOI] [PubMed] [Google Scholar]
- 12.Chaurand P, Norris JL, Cornett DS, Mobley JA, Caprioli RM. Journal of Proteome Research. 2006;5:2889. doi: 10.1021/pr060346u. [DOI] [PubMed] [Google Scholar]
- 13.Jackson SN, Wang HY, Woods AS. Analytical Chemistry. 2005;77:4523. doi: 10.1021/ac050276v. [DOI] [PubMed] [Google Scholar]
- 14.Troendle FJ, Reddick CD, Yost RA. Journal of the American Society for Mass Spectrometry. 1999;10:1315. [Google Scholar]
- 15.Caprioli RM, Farmer TB, Gile J. Analytical Chemistry. 1997;69:4751. doi: 10.1021/ac970888i. [DOI] [PubMed] [Google Scholar]
- 16.Leinweber BD, Tsaprailis G, Monks TJ, Lau SS. Journal of the American Society of Mass Spectrometry. 2009;20:89. doi: 10.1016/j.jasms.2008.09.008. [DOI] [PMC free article] [PubMed] [Google Scholar]
- 17.Meistermann H, Norris JL, Aerni HR, Cornett DS, Friedlein A, Erskine AR, Augustin A, De Vera Mudry MC, Ruepp S, Suter L, Langen H, Caprioli RM, Ducret A. Molecular and Cellular Proteomics. 2006;5:1876. doi: 10.1074/mcp.M500399-MCP200. [DOI] [PubMed] [Google Scholar]
- 18.Yanagisawa K, Shyr Y, Xu BJ, Massion PP, Larsen PH, White BC, Roberts JR, Edgerton M, Gonzalez A, Nadaf S, Moore JH, Caprioli RM, Carbone DP. The Lancet. 2003;362:433. doi: 10.1016/S0140-6736(03)14068-8. [DOI] [PubMed] [Google Scholar]
- 19.Wang HY, Jackson SN, McEuen J, Woods AS. Analytical Chemistry. 2005;77:6682. doi: 10.1021/ac050868d. [DOI] [PubMed] [Google Scholar]
- 20.Watson PA. The Rat Brain in Stereotaxic Coordinates – The New Coronal Set. Vol. 1. Elsevier Academic Press; Amsterdam: 2004. [Google Scholar]
- 21.Eilers PH. Analytical Chemistry. 2003;75:3631. doi: 10.1021/ac034173t. [DOI] [PubMed] [Google Scholar]
- 22.Eilers PH. Analytical Chemistry. 2004;76:404. doi: 10.1021/ac034800e. [DOI] [PubMed] [Google Scholar]
- 23.Morris JS, Coombes KR, Koomen J, Baggerly KA, Kobayashi R. Bioinformatics. 2005;21:1764. doi: 10.1093/bioinformatics/bti254. [DOI] [PubMed] [Google Scholar]
- 24.R Development Core Team. R Foundation for Statistical Computing; Vienna, Austria: 2006. [Google Scholar]
- 25.Gasteiger E, Hoogland C, Gattiker A, Duvaud S, Wilkins MR, Appel RD, Bairoch A. Protein Identification and Analysis Tools on the ExPASy Server. Humana Press; Totowa, NJ: 2005. [Google Scholar]
- 26.Kalivas PW, Volkow ND. The American Journal of Psychiatry. 2005;162:1403. doi: 10.1176/appi.ajp.162.8.1403. [DOI] [PubMed] [Google Scholar]
- 27.Albrethsen J. Clinical Chemistry. 2007;53:852. doi: 10.1373/clinchem.2006.082644. [DOI] [PubMed] [Google Scholar]
- 28.Egger C, Kirchmair R, Kapelari S, Fischer-Colbrie R, Hogue-Angeletti R, Winkler H. Neuroendocrinology. 1994;59:169. doi: 10.1159/000126655. [DOI] [PubMed] [Google Scholar]
- 29.Hoflehner J, Eder U, Laslop A, Seidah NG, Fischer-Colbrie R, Winkler H. FEBS Letters. 1995;360:294. doi: 10.1016/0014-5793(95)00127-u. [DOI] [PubMed] [Google Scholar]
- 30.Marksteiner J, Kirchmair R, Mahata SK, Mahata M, Fischer-Colbrie R, Hogue-Angeletti R, Saria A, Winkler H. Neuroscience. 1993;54:923. doi: 10.1016/0306-4522(93)90585-4. [DOI] [PubMed] [Google Scholar]
- 31.Boggs JM. Cellular and Molecular Life Sciences. 2006;63:1945. doi: 10.1007/s00018-006-6094-7. [DOI] [PMC free article] [PubMed] [Google Scholar]
- 32.Groseclose MR, Andersson M, Hardesty WM, Caprioli RM. Journal of Mass Spectrometry. 2007;42:254. doi: 10.1002/jms.1177. [DOI] [PubMed] [Google Scholar]
- 33.Saria A, Troger J, Kirchmair R, Fischer-Colbrie R, Hogue-Angeletti R, Winkler H. Neuroscience. 1993;54:1. doi: 10.1016/0306-4522(93)90377-r. [DOI] [PubMed] [Google Scholar]
- 34.Agneter E, Sitte HH, Stockl-Hiesleitner S, Fischer-Colbrie R, Winkler H, Singer EA. Journal of Neurochemistry. 1995;65:622. doi: 10.1046/j.1471-4159.1995.65020622.x. [DOI] [PubMed] [Google Scholar]
- 35.Schmidt HD, Pierce RC. Neuroscience. 2006;142:451. doi: 10.1016/j.neuroscience.2006.06.004. [DOI] [PubMed] [Google Scholar]
- 36.Schmidt HD, Anderson SM, Pierce RC. The European Journal of Neuroscience. 2006;23:219. doi: 10.1111/j.1460-9568.2005.04524.x. [DOI] [PubMed] [Google Scholar]
- 37.Che FY, Vathy I, Fricker LD. Journal of Molecular Neuroscience. 2006;28:265. doi: 10.1385/JMN:28:3:265. [DOI] [PubMed] [Google Scholar]


