

Abstract
Parkinson's disease (PD) is a neurodegenerative disorder associated with debilitating motor, posture, and gait abnormalities. Human studies recording local field potentials within the subthalamic nucleus and scalp-based electroencephalography have shown pathological beta synchronization throughout the cortical–basal ganglia motor network in PD. Suppression of such pathological beta synchronization has been associated with improved motor function, which may explain the effectiveness of deep-brain stimulation. We used magnetoencephalography (MEG) to investigate neural population-level beta responses, and other oscillatory activity, during a motor task in unmedicated patients with PD and a matched group of healthy adults. MEG is a noninvasive neurophysiological technique that permits the recording of oscillatory activity during movement planning, execution, and termination phases. Each of these phases was independently examined using beamforming to distinguish the brain areas and movement phases, where pathological oscillations exist during motor control. Patients with PD exhibited significantly diminished beta desynchronization compared with controls prior to and during movement, which paralleled reduced alpha desynchronization. This study is the first to systematically investigate neural oscillatory responses in PD during distinct stages of motor control (e.g. planning, execution, and termination) and indicates that these patients have significant difficulty suppressing cortical beta synchronization during movement planning, which may contribute to their diminished movement capacities.
Keywords: cortex, magnetoencephalography, MEG, motor control, oscillations
Introduction
Parkinson's disease (PD) is a progressive neurodegenerative disorder whose symptoms include muscle rigidity, instability, hypokinesia or bradykinesia, and resting tremor (Jankovic 2008). Autonomic dysfunction, cognitive dysfunction, and sleeping and sensory abnormalities, such as hyposmia, paresthesia, and chronic pain (Jankovic 2008), characterize the constellation of nonmotor clinical symptoms. The prevalence of PD is between 1% and 2%, although the actual number of patients with the disease is likely higher as many go undiagnosed or misdiagnosed (Schrag et al. 2002; Wright-Willis et al. 2010). The cause of PD is unknown, though at least one subtype demonstrates a genetic linkage (for a review, see Corti et al. 2011). There is also evidence suggesting that occupational pesticide exposure is a risk factor for PD (Gorell et al. 1998; Betarbet et al. 2000; Firestone et al. 2005, 2010; Dick et al. 2007).
Although structural degeneration in the substantia nigra pars compacta (SNpc) has long been recognized as critical to the pathobiology of PD, a number of recent studies have focused on the neurophysiological sequelae of such neurodegeneration within the cortical–subcortical–basal ganglia motor network. In healthy humans, there is a well-established pattern of cortical oscillatory activity, including event-related synchronizations (ERS) and desynchronizations (ERD), during the preparation and execution of movements (Jurkiewicz et al. 2006; Cheyne et al. 2008; Gaetz et al. 2010, 2011; Muthukumaraswamy 2010; Wilson et al. 2010, 2011). Such neural responses are generally strong in the contralateral primary motor and somatosensory cortices (M1/S1), supplementary motor area (SMA), and the parietal lobe among others. Weaker responses are typically noted in the same neural regions ipsilateral to the movement. While there is some intersubject variability with regard to the specific time–frequency parameters, there is remarkable consistency in the individual patterns (within-subject) of activation and deactivation, regardless of the movement type (Cheyne et al. 2008).
Prior to movement onset, there is a strong desynchronization in the beta band (15–30 Hz) that starts approximately 600 ms before movement and continues for an additional 400 ms after the movement onset. After this initial beta ERD, there is a strong resynchronization in the beta band, known as a postmovement beta rebound (PMBR). Maximum synchronization of the PMBR occurs between 500 and 800 ms after the movement and lasts approximately 1000 ms (Gaetz et al. 2010). Interestingly, the power of the PMBR increases as a function of age, with little-to-no synchronization occurring in younger children (Gaetz et al. 2011). During movement, there is also increased gamma activity, especially from 66 to 85 Hz, that is time-locked to the movement onset (Cheyne et al. 2008; Wilson et al. 2010). Unlike the beta response, the gamma response reaches maximum amplitude about 100 ms after movement onset and is very brief, lasting only 100–200 ms, at which time it quickly dissipates and the PMBR response emerges. The peak frequency of the gamma response also appears to decrease as participants get older (Gaetz et al. 2010, 2011), and the overall response amplitude is weaker in young adults than in adolescents (Gaetz et al. 2010). The gamma response is also more powerful during the first movement of a repetitive sequence than in succeeding movements (Muthukumaraswamy 2010). Finally, about 1 s prior to the movement onset, there is a strong ERD in the alpha band (8–14 Hz) that appears bilaterally in the motor cortices (Jurkiewicz et al. 2006). This ERD response is stronger in the contralateral, compared with ipsilateral, cortices and continues during the movement and slightly after, until dissipating slowly back to baseline about 2 s after movement cessation.
While PD was traditionally viewed as a strictly subcortical disorder, functional neuroimaging of the cortical–subcortical–basal ganglia motor circuit has provided new insights on the cortical activation abnormalities associated with the disease (Rascol et al. 1994, 1997; Buhmann et al. 2003; Sabatini et al. 2000). Additionally, with the advent of deep-brain stimulation (DBS) therapy, opportunities to record local field potentials (LFPs) and simultaneous scalp electroencephalography (EEG) in patients who were undergoing neurosurgery have substantially increased, and such studies have broadly enhanced our understanding of pathological oscillatory activity in the basal ganglia–cortical motor circuit. A widely replicated finding in patients undergoing DBS surgery is that the subthalamic nucleus (STN) exhibits pathological beta synchronization, which eventually entrains the entire basal ganglia–cortical network and thereby serves to block volitional movement (Cassidy et al. 2002; Salenius et al. 2002; Brown 2007; Weinberger et al. 2006; Hammond et al. 2007; Kühn et al. 2004, 2008; many others). Weinberger and colleagues recorded LFPs in patients undergoing surgery before and after DBS initialization, and found aberrant beta synchronization in patients before DBS, and that beta synchrony was strongly reduced when DBS was initiated. The amplitude of oscillatory beta activity in the STN was also directly correlated with pharmacological treatment effectiveness and subsequent symptom improvement (Weinberger et al. 2006). In a related study, Kühn et al. (2008) found that DBS dramatically reduced cortical beta synchrony and simultaneously increased movement amplitude in PD patients. Importantly, these improvements quickly diminished after the stimulation was turned off (Kühn et al. 2008). They concluded that bradykinesia was associated with pathological beta oscillations, and that high-frequency DBS selectively normalized beta activity and thereby improved symptoms. These and other studies have also shown strong signal coherence between STN oscillations and oscillations in and around the motor cortex (Cassidy et al. 2002; Hammond et al. 2007; Kühn et al. 2008), which indicates that pathological beta activity has transcended basal ganglia structures to engulf the entire motor network. Numerous other studies have reached similar conclusions, which have positioned beta activity as central to the mechanism debate. In short, the disruption of pathological beta synchronization within the cortex is currently a leading candidate mechanism for the efficacious effects of DBS therapy (Li et al. 2007; Kühn et al. 2008; Dejean et al. 2009; Gradinaru et al. 2009).
While dopaminergic cell death in the SNpc is clearly important, the ultimate symptoms and their remediation appear largely dependent on the state of the motor cortex. A leading candidate mechanism for the efficacious effects of DBS in PD is antidromic action potentials within cortical neurons terminating in the STN, which would disrupt the pathological beta synchronization that may prevent the cortex from performing motor control operations (Dejean et al. 2009; Gradinaru et al. 2009; Walker et al. 2011, 2012). Thus, in this study, we examined oscillatory activity during a hand movement task using magnetoencephalography (MEG), in an effort to quantify these neural abnormalities that may ultimately function as a signature of PD. MEG is a completely noninvasive neurophysiological imaging technique with optimal temporal resolution and good spatial precision. Past studies of PD have only rarely evaluated oscillatory activity during basic movements, and those that have relied almost exclusively on invasive methods (see above). Furthermore, normative studies have associated specific neural oscillatory responses with different stages of a single motor event, and no study has examined these oscillatory shifts during overt movements in patients with PD. Importantly, many pertinent studies have examined continuous or quasicontinuous movement in patients with PD which, while valuable in their own right, do not allow the discrimination of each attribute in the well-characterized oscillatory behavior of the normal motor system. These time-locked synchronizations (e.g. PMBR) and desynchronizations (e.g. beta ERD) are necessary for proper and correct movements, and not taking these into account could lead to inaccurate or incomplete conclusions. For example, there is a strong beta ERD prior to the movement onset. If this were defined as the baseline for analysis, as is the case in many evoked-response studies, then the premovement beta desynchronization would not be noticeable, and the PMBR would be artificially large. Since PD is a movement disorder, it is possible that one or more parts of this pattern are aberrant. Without proper time–frequency analyses, such oscillatory abnormalities would be difficult or impossible to detect. Based on basic science evidence of normal oscillatory responses in healthy subjects, we hypothesized that the premovement alpha and beta desynchronizations, the movement-related gamma response, and the PMBR would each be of lower amplitude in PD patients relative to age- and sex-matched non-PD controls. These responses aid in movement preparation, initialization, and termination, which are deficient in patients with PD and thus, may serve as a biomarker for PD.
Materials and Methods
Subject Selection
We studied 19 adults (3 females) with PD and 16 adults (5 females) without PD. Mean ages were 64.6 years for patients (range: 52–77 years) and 65.6 years for controls (range: 50–85) at enrollment (Table 1). All participants except one control were right-handed. All participants with PD had been prescribed a regularly monitored dosage of an antiparkinsonian medication for at least 2 months prior to study enrollment (Table 1) and had showed a satisfactory clinical response to the particular antiparkinsonian medication(s). Parkinsonism was measured by a certified rater using the Unified Parkinson's Disease Rating Scale (UPDRS) in both the practically defined “off” state (i.e. following at least a 12-h holiday from antiparkinsonian medications) and the “on” state (i.e. after administration of typical medication regimen). Mean patient UPDRS scores were 31.58 in the “off” state and 25.60 in the “on” state, which was a significant improvement, t(14) = 4.26 (P < 0.001). Exclusionary criteria included any medical illness affecting CNS function, neurological disorder, history of head trauma, and current substance abuse. After complete description of the study to participants, written informed consent was obtained following the guidelines of the University of Nebraska Medical Center's Institutional Review Board, which approved the study protocol. Complete demographics and UPDRS scores for patients and controls are provided in Table 1.
Table 1.
Clinical and demographic characteristics
| Subject ID | Age (years) | Sex | Disease duration (years) | PD medications (type, dose) | UPDRS off | UPDRS on |
|---|---|---|---|---|---|---|
| p01a | 75 | M | 4 | Pram (0.5 mg), CD/LD (25/100 mg) | – | 17 |
| p02 | 57 | M | 2.5 | Pram (3 mg) | 47 | 36 |
| p03 | 62 | M | 4 | Pram (4.5 mg), Rasagiline (1 mg) | 32 | 31 |
| p04 | 70 | M | – | Pram (1.5 mg), CD/LD (25/100 mg) | 30 | – |
| p05 | 52 | M | 9 | CD/LD, Ropinirole | 80 | 60 |
| p06a | 70 | M | 5.5 | Rasagiline, Pram | 37 | 32 |
| p07a | 76 | M | 4 | Rasagiline (1 mg), CD/LD (50/200 mg) | 64 | 55 |
| p08 | 61 | M | – | Ropinirole (1 mg) | 23 | – |
| p09 | 60 | M | 1 | Ropinirole (1 mg) | 51 | 48 |
| p10 | 72 | F | 9 | Ropinirole | 17 | 17 |
| p11a | 77 | M | 6 | CD/LD | – | – |
| p12a | 54 | F | 6 | Pram (4.5 mg), CD/LD (25/100 mg) | 48 | 37 |
| p13 | 64 | F | 8 | Pram (2 mg), Rasagiline (1 mg) | 49 | 41 |
| p14 | 67 | M | 1 | CD/LD (25/100 mg) | 34 | 31 |
| p15 | 66 | M | 3 | Rasagiline (1 mg), CD/LD (25/100 mg) | 73 | 73 |
| p16 | 69 | M | – | CD/LD (50/200 mg) | 52 | 43 |
| p17 | 52 | M | 6 | Ropinirole (8mg) | 24 | 23 |
| p18a | 60 | M | 3 | CD/LD (25/100 mg), Aman (100 mg) | 49 | 40 |
| p19 | 64 | M | 7 | CD/LD (25/100 mg), Aman | 36 | 27 |
| c01 | 68 | F | ||||
| c02a | 60 | F | ||||
| c03 | 69 | F | ||||
| c04 | 56 | M | ||||
| c05 | 69 | M | ||||
| c06 | 56 | M | ||||
| c07a | 70 | M | ||||
| c08 | 64 | M | ||||
| c09 | 83 | F | ||||
| c10 | 85 | M | ||||
| c11 | 53 | F | ||||
| c12 | 75 | M | ||||
| c13 | 71 | M | ||||
| c14 | 68 | M | ||||
| c15 | 53 | M | ||||
| c16a | 50 | M |
Pram: pramipexole; CD/LD: carbidopa/levodopa; Aman: amantadine.
aDenotes participants who were excluded from analysis due to major dental artifacts, large or repetitive head movements, or tremor-related (or exasperated) artifacts.
Experimental Paradigm
All participants were scheduled for MEG early in the morning (i.e. 07:30–08:00) and for the group with PD, a minimum of 12 h since their last dosage of antiparkinsonian medication. After administration of the first UPDRS, participants were positioned in the MEG. Participants rested both arms on a table in front of them. Dual-plane accelerometer chips were attached to each index fingertip to precisely quantify movement onsets (see MEG Preprocessing) and to continuously monitor for intermittent tremor. Participants were instructed to fixate on a cross hair presented centrally and to perform a single tap of the right index finger each time a dot reached the 12 o'clock position. This dot completed one full revolution, around a clock-like circle without numbers or tick marks (Fig. 1) every 6 s, which constituted one trial. Each participant performed at least 105 trials, and the total recording time was ∼11 min.
Figure 1.
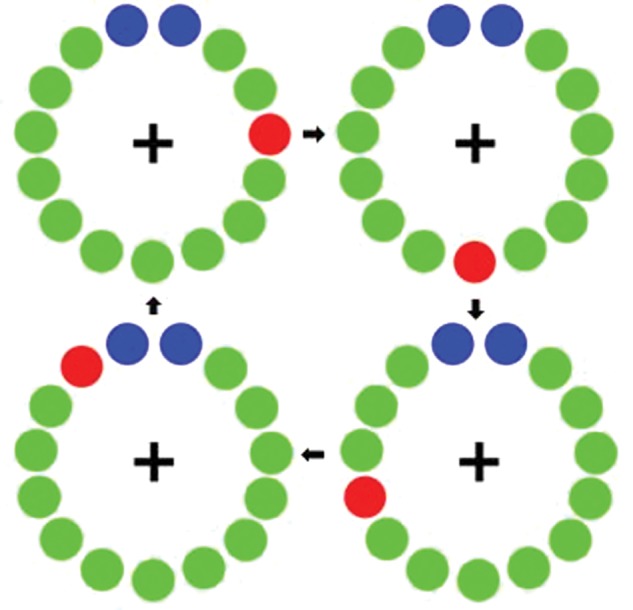
Motor paradigm. Participants fixated on the cross hair as the red dot moved clockwise toward the blue dots, displacing each green dot in turn. Participants were instructed to make one flexion-extension movement each time the red dot was within the blue area, but only one movement per revolution (figure and caption adapted from Wilson et al. 2010).
MEG Data Acquisition
All recordings were conducted in a one layer magnetically shielded room (MSR) with active shielding engaged. With an acquisition bandwidth of 0.1–330 Hz, neuromagnetic responses and the accelerometer signals were sampled continuously at 1 kHz using an Elekta Neuromag system with 306 magnetic sensors (Elekta, Helsinki, Finland). Using MaxFilter (v2.1.15; Elekta), MEG data from each subject were individually corrected for head motion and subjected to noise reduction using the signal-space separation method with a temporal extension (Taulu et al. 2005; Taulu and Simola 2006).
MEG Coregistration and Structural MRI Processing
Prior to MEG measurement, 4 coils were attached to the subject's head and the locations of these coils, together with the 3 fiducial points and scalp surface, were determined with a 3-D digitizer (Fastrak 3SF0002, Polhemus Navigator Sciences, Colchester, VT, USA). Once the subject was positioned for MEG recording, an electric current with a unique frequency label (e.g. 322 Hz) was fed to each of the coils. This induced a measurable magnetic field and allowed each coil to be localized in reference to the sensors throughout the recording session. Since coil locations were also known in head coordinates, all MEG measurements could be transformed into a common coordinate system. With this coordinate system (including the scalp surface points), each participant's MEG data were coregistered with structural T1-weighted magnetic resonance imaging (MRI) data prior to source space analyses. Structural MRI data were aligned parallel to the anterior and posterior commissures and transformed into the Talairach coordinate system (Talairach and Tournoux 1988) using BrainVoyager QX (Brain Innovations, The Netherlands). Following source analysis (i.e. beamforming), each subject's functional images were transformed into standardized space (Talairach and Tournoux 1988) using the transform that was previously applied to the structural MRI volume.
MEG Preprocessing
Cardioartifacts were removed from the data using signal-space projection (SSP), and the projection operator was accounted for during source reconstruction (Uusitalo and Ilmoniemi 1997). Artifact rejection was based on a fixed threshold method, supplemented with visual inspection. Epochs were of 4.5 s duration (−2.0 to 2.5 s), with 0.0 s defined as movement onset and the baseline being the −2.0- to −1.2-s window. This specific baseline period was used to prevent the premovement beta desynchronization from contaminating the baseline. Movement onset was defined using dual-plane accelerometers, which were attached to each finger and digitized along with the MEG data at 1 kHz. Essentially, the onset of movement was determined by a sharp increase in the amplitude of the accelerometer signal attached to the right index finger. Figure 2 provides a representative example of a single-trial accelerometer signal in a patient and control. The average number of trials included in the final analysis was 99.9 (SD 10.8) in the control group and 95.1 (SD 11.4) in the patient group. There were no significant differences between groups (t(24) = 1.11, P = 0.28).
Figure 2.

Single-trial accelerometer signals from a representative control and patient with PD. Time in ms is denoted on the x-axis, while acceleration in arbitrary units (a.u.) is noted on the y-axis. All patients and controls exhibited a sharp change in signal amplitude at movement onset; this change was marked as 0 ms in each trial. This sharp change in accelerometer signal amplitude allowed precise definitions of movement onset during individual trials, regardless of participant group.
MEG Time–Frequency Transformation and Statistics
Artifact-free epochs were transformed into the time–frequency domain using complex demodulation (resolution: 2.0 Hz, 25 ms; Papp and Ktonas 1977; Hoechstetter et al. 2004), and the resulting spectral power estimations per sensor were averaged over trials to generate time–frequency plots of mean spectral density. These data were normalized by dividing the power value of each predetermined time–frequency bin by the respective bin's baseline power, which was calculated as the mean power during the −2.0- to −1.2-s time period. This normalization allowed task-related power fluctuations to be readily visualized in sensor space. Once identified, the neural regions generating these event-related synchronizations and desynchronizations (ERS and ERD; power increases and decreases, respectively) were imaged by subjecting the data to a beamformer. It is worth noting that, across different studies, the exact definitions of these time–frequency windows are not identical, although they are generally similar. Small variations in the time–frequency windows of maximal change can be caused by age differences in the sample (Gaetz et al. 2010), different limbs being moved (Cheyne et al. 2008), and likely other factors that have yet to be fully characterized. In this study, the exact time–frequency windows subjected to beamforming were derived through a data-driven approach.
The specific time–frequency windows used for imaging were determined by statistical analysis of the spectrograms corresponding to each of the 204 gradiometer sensors across both groups. Each data point in the spectrogram was initially evaluated using a mass univariate approach based on the general linear model. To reduce the risk of false-positive results while maintaining reasonable sensitivity, a 2-stage procedure was followed to control for Type 1 error. In the first stage, one sample t-tests were conducted on each data point, and the output spectrogram of t-values was thresholded at P < 0.05 to define time–frequency bins containing potentially significant oscillatory deviations across all participants. In stage 2, time–frequency bins that survived the threshold were clustered with temporally and/or spectrally neighboring bins that were also above the (P < 0.05) threshold, and a cluster value was derived by summing all of the t-values of all data points in the cluster. Nonparametric permutation testing was then used to derive a distribution of cluster values, and the significance level of the observed clusters (from stage 1) was tested directly using this distribution (Ernst 2004; Maris and Oostenveld 2007). For each comparison, at least 10 000 permutations were computed to build a distribution of cluster values. Based on these analyses, the time–frequency windows that contained significant oscillatory events across all participants and corresponded to those of a priori interest (e.g. beta ERD and PMBR) were subjected to the beamforming analysis. These time–frequency bins of interest were significant in most (or all) gradiometers near the sensorimotor cortex. We defined the time–frequency parameters using the single sensor with the highest t-value, but the results would have been identical if we used any of the ∼40 gradiometers that surrounded the peak sensor. One exception, however, was made for the movement-related gamma response (see Results), which has been described in a handful of recent studies in adolescents and young adults (Cheyne et al. 2008; Gaetz et al. 2010, 2011; Muthukumaraswamy 2010; Wilson et al. 2010, 2011), but has not yet been reported in studies of older adults.
MEG Source Imaging and Statistics
Using the time–frequency windows determined by the analysis described above, cortical networks were imaged through an extension of the linearly constrained minimum variance vector beamformer (Van Veen et al. 1997; Hillebrand et al. 2005; Liljeström et al. 2005), which employs spatial filters in the frequency domain to calculate source power for the entire brain volume. The single images are derived from the cross spectral densities of all combinations of MEG sensors averaged over the time–frequency range of interest, and the solution of the forward problem for each location on a grid specified by input voxel space. Following convention, the source power in these images was normalized per participant using a separately averaged prestimulus noise period of equal duration and bandwidth (van Veen et al. 1997). MEG preprocessing and imaging used the Brain Electrical Source Analysis (BESA version 5.3.2) software, and MEG-MRI coregistration used the BrainVoyager QX (Version 2.2) software.
Normalized source power was computed for the selected frequency bands over the entire brain volume per participant at 4.0 × 4.0 × 4.0 mm resolution. The effect of group was examined using a random effects analysis for the time–frequency bins of interest. One-sample t-tests were conducted to probe activation patterns in each group. As with the spectrogram analysis, a two stage approach was used to control for Type 1 error while maintaining reasonable sensitivity. In the first stage, t-tests were conducted on each voxel, and the output was thresholded (P < 0.05) to create statistical parametric maps (SPMs), which showed clusters of potentially significant activation. A cluster value was derived in stage 2, for each cluster surviving stage 1, by summing all of the t-values of all data points (voxels) within the cluster. Subsequently, we used permutation testing to derive a distribution of cluster values and tested the observed clusters for significance using this distribution (Ernst 2004; Maris and Oostenveld 2007). For each comparison, at least 1000 permutations were computed to build a distribution of cluster values.
Results
All 19 patients were able to complete the task. There were no significant differences between groups regarding age (t(33) = 0.32; P = 0.75) or sex (χ2(1, N = 35) = 0.42; P = 0.51). Six PD patients and 3 controls were excluded at the data analysis stage due to major dental artifacts, large or repetitive head movements, or tremor-related (or exasperated) artifacts. There were no group differences in the age or sex of the 13 patients and 13 controls that were included in the analysis (sex: χ2(1, N = 26) = 0.35; P = 0.55; age: t(24) = 1.6, P = 0.12).
Sensor-Based Analyses
Sensor-level time–frequency spectrograms indicated the typical response pattern of premovement alpha and beta desynchronizations, followed by a PMBR, in all participants. However, these responses were clearly diminished in patients with PD (Fig. 3). These spectrograms were statistically examined (see MEG Time–Frequency Transformation and Statistics in Materials and Methods) using one sample t-tests of the sensor-level plots from both controls and patients (i.e. one group) to derive the precise time–frequency bins for subsequent beamforming analyses. The results indicated significant (P < 0.05, corrected) beta oscillatory responses from 14 to 24 Hz spectrally, and temporally from −0.3 to 0.2 s, and from 0.7 to 1.5 s (0.0 s = movement onset). These oscillatory responses are consistent with the previously described premovement beta ERD and PMBR, respectively. Significant oscillatory activity was also found in the 8- to 14-Hz band from −0.3 to 0.2 s, which is consistent with the motor-related alpha response. These specific time–frequency bands (beta ERD: −0.3–0.2 s, 14–24 Hz; PMBR: 0.7–1.5 s, 14–24 Hz; and alpha ERD: −0.3–0.2 s, 8–14 Hz), and a window of equal bandwidth and duration from the baseline period, were then independently imaged using beamforming to derive the spatial location of significant oscillatory responses associated with movement in each participant. Finally, no significant movement-related gamma responses (i.e. 70–80 Hz) were detected at the sensor level, but about 10 participants did exhibit a strong increase in activity a movement onset in the lower 40- to 55-Hz gamma range (Supplementary Data). Thus, we conducted an exploratory beamforming analysis on this time–frequency window, which contained the strongest candidate for a movement-related gamma response (0–200 ms, 40–55 Hz).
Figure 3.
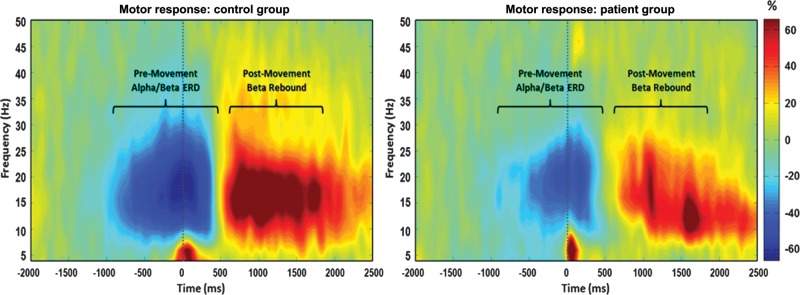
Average time–frequency spectra in controls and patients with PD during movement. Time (in ms) is denoted on the x-axis, with 0 ms defined as movement onset. Frequency (in Hz) is shown on the y-axis. The average patterns of alpha and beta premovement desynchronization and PMBR during the hand movement task, expressed as percent difference from baseline, are shown in the control group on the left. The reduced alpha and beta desynchronizations, as well as a diminished beta rebound in the same region, can be discerned in the PD group average on the right. In addition, the lower-frequency gamma response that occurred at movement onset can be seen in the average plot of the patients with PD. This gamma response was present in a subset of patients and controls (see Supplementary Data).
Beamforming Analyses
Premovement Beta ERD
Statistical analysis of the task effect in controls revealed significant desynchronization centered on the left motor hand knob region (Yousry et al. 1997) of the precentral gyrus, as well as a smaller cluster in the same region of the precentral gyrus ipsilaterally (P < 0.0001, corrected). Patients also exhibited significant desynchronization in the hand knob region of the left and right precentral gyri (P < 0.0001, corrected). With regard to the group effect, patients exhibited a significantly reduced beta ERD in the left motor hand knob region of the precentral gyrus, extending to the adjacent postcentral gyrus (P = 0.035, corrected; see Fig. 4).
Figure 4.

Activation differences during the premovement beta ERD and the alpha ERD. The peak difference in the beta ERD response (top panel) was within the left motor hand knob feature of the precentral gyrus and extended onto the adjacent postcentral gyrus (P = 0.035, corrected). Differences seen in the right precentral gyrus near the hand knob region were not significant after permutation testing (P < 0.005, uncorrected and P = 0.107, corrected). The peak difference in the alpha ERD response corresponded to the left postcentral gyrus near the hand knob region (P < 0.05, corrected). All images have been thresholded at P = 0.001, uncorrected, and reflect areas of greater activation in controls compared with patients with PD.
Postmovement Beta Rebound
Healthy controls exhibited significant beta synchronization in the premotor cortex bilaterally and in the SMA (P < 0.0001, corrected). Patients exhibited a much weaker response, peaking near the medial prefrontal cortex (P = 0.01, corrected). Following permutation testing, between-group comparisons showed no significant differences in the PMBR response. However, in the uncorrected SPMs, beta synchronization was significantly stronger in the left dorsolateral prefrontal cortex (P < 0.005, uncorrected and P = 0.056, corrected) and the SMA (P < 0.005, uncorrected and P = 0.058, corrected) of healthy controls compared with patients with PD.
Alpha and Gamma Responses
Healthy controls displayed significant alpha desynchronization bilaterally along the postcentral gyri, almost directly posterior to the hand knob region (P = 0.0001, corrected). Surprisingly, significant alpha desynchronization in patients was centered near the posterior cingulate cortex (P < 0.0001, corrected). Patients with PD also exhibited a significantly weaker alpha desynchronization compared with controls in the left postcentral gyrus (P < 0.05, corrected). There were no significant gamma responses found in patients or controls. The Talairach coordinates of each cluster maximum, for significant task and group effects, are summarized in Table 2.
Table 2.
Motor task and group effects: peak coordinates
| Effect | Frequency band | Anatomical label | Talaraich coordinates (x, y, z) |
t-value | ||
|---|---|---|---|---|---|---|
| Task effects: controls | Beta ERD | L precentral gyrus | −32 | −21 | 40 | 11.53 |
| R precentral gyrus | 48 | −24 | 40 | 13.93 | ||
| Alpha ERD | L postcentral gyrus | −40 | −32 | 52 | 9.533 | |
| R postcentral gyrus | 47 | −22 | 38 | 8.411 | ||
| PMBR | L premotor cortex | −40 | 10 | 41 | 7.436 | |
| R premotor cortex | 36 | 2 | 40 | 8.647 | ||
| SMA | 10 | −3 | 40 | 8.103 | ||
| Task effects: patients | Beta ERD | L precentral gyrus | −35 | −27 | 30 | 10.09 |
| R precentral gyrus | 41 | −28 | 34 | 6.154 | ||
| Alpha ERD | PCC | 8 | −49 | 21 | 11.53 | |
| PMBR | MPFC | −4 | 34 | 37 | 5.821a | |
| Group effects: controls > patients | Beta ERD | L precentral gyrus | −31 | −30 | 59 | 4.098 |
| L postcentral gyrus | −35 | −32 | 52 | 4.462 | ||
| R precentral gyrus | 45 | −18 | 52 | 4.057b | ||
| Alpha ERD | L postcentral gyrus | −38 | −35 | 61 | 5.229 | |
| R postcentral gyrus | 43 | −16 | 47 | 3.832b | ||
| PMBR | L DLPFC | −44 | 36 | 4 | 3.684b | |
| SMA | 18 | 11 | 40 | 2.861b | ||
Peaks for all task effects were significant at P < 0.0001, corrected, unless noted otherwise.
Peaks for all group effects were significant at P < 0.05, corrected, unless noted otherwise.
aDenotes peaks that were significant at P < 0.01, corrected.
bDenotes peaks that were significant at P < 0.005, uncorrected.
Discussion
In the current study, healthy controls exhibited a well-established pattern of oscillatory neural activity before, during, and after movement onsets in brain areas associated with motor processing. Alpha and beta desynchronizations were observed prior to movement onset and during movement execution in the contralateral sensorimotor cortices. A strong PMBR response emerged following movement termination, in the contralateral premotor cortex. Patients with PD exhibited each of these neural responses in the temporal sequence, although their response amplitudes were significantly diminished from that of controls. Furthermore, during the movement and following termination, PD patients exhibited a clear trend toward beta hyposynchronization in the dorsolateral prefrontal cortex and SMA, which are areas of executive function and motor control, respectively. Below, we discuss the implications of these findings for understanding pathological cortical activity in patients with PD. We posit that noninvasive monitoring of pathological beta synchronization with MEG may hold significant promise as a biomarker for PD.
Invasive studies, many of which investigated the effects of DBS on STN activity, have noted hypersynchronization in the beta band (Cassidy et al. 2002; Hammond et al. 2007; Li et al. 2007; Kühn et al. 2008; Dejean et al. 2009) throughout the basal ganglia and cortical motor system. This beta synchronization may partially account for the dysfunctional pattern of activation found in patients during the motor task. If patients with PD experience aberrant beta synchronization, it is possible that they are unable to “break through” this beta synchronization in order to initiate the premovement beta ERD necessary for proper movement. A recent optogenetics study of PD demonstrated that DBS causes antidromic action potentials in cortical neurons terminating in the STN (Gradinaru et al. 2009). Such antidromic activity could effectively interrupt the intense cortical beta synchrony and, in their study, this was accompanied by a strong suppression of classic PD symptomatology (Gradinaru et al. 2009). Additionally, alpha desynchronization prior to movement is linked to premovement beta desynchronization (Jurkiewicz et al. 2006), so it is probable that such beta dysfunction carries over to alpha activity. Potentially, a certain degree of beta desynchronization is necessary before neurons in this cortical area synchronize at the faster gamma firing rate that initiates movement execution, just as alpha desynchronization in visual cortices precedes active visual processing in the gamma range (Swettenham et al. 2009; Koelewijn et al. 2011). However, this could not be investigated as there was no significant gamma activation found in either healthy controls or patients, though there were a handful of participants who showed a strong increase in activation at movement onset in the lower 40- to 55-Hz gamma range (Supplementary Data), and this response can be discerned in the group-averaged data from patients with PD (Fig. 3). There are two lines of evidence that may help explain this reduction in the peak frequency and amplitude of the movement-related gamma response in our study population. First, there is evidence of a linear modulation of gamma response amplitude with age during motor processing, with young adults showing less gamma activity than adolescents (Gaetz et al. 2010). Secondly, Gaetz et al. (2010, 2011) have reported that the peak frequency of the movement-related gamma response decreases linearly with age. Together, these observations may partially explain the weak response amplitudes and the lower peak gamma-band frequencies observed in our sample of healthy older adults (mean age: 65.63 years). Interestingly, the frequency range where we observed the strongest “candidate” movement-related gamma response (40–55 Hz) falls near what would be expected, given the age of our participants and the slope of the age/gamma-frequency correlation reported in Gaetz et al. (2011). It is also worth noting that, in a separate study of HIV-infected patients and healthy older controls (mean age: 59.4 years), we have observed very similar findings of reduced gamma-band response amplitudes and lower peak gamma frequency, which again may be attributable to the age of the participants (Wilson et al. unpublished observations). Unfortunately, no studies have examined the impact of healthy aging on motor-related gamma activation, and thus, the absence of this response in the current data can only be speculated upon. Missonnier et al. (2010) did find that older participants who had begun to develop mild cognitive impairment, even if the cognitive impairment remained stable over time, showed reduced gamma activation during a memory task compared with healthy controls. Such a reduction in gamma activity could be a more widespread phenomenon in aging persons (e.g., Karrasch et al. 2004), and future studies should confirm whether such a reduction extends to the gamma motor response, as we found in controls (and patients) in the current study.
Premovement beta desynchronization is thought to aid in movement preparation and cognitive selection of a proper motor response (Kaiser et al. 2001; Doyle et al. 2005). In a MEG study of healthy persons, Kaiser et al. (2001) evaluated modulation of the premovement beta ERD when participants performed a motor task using either the left or right hand based on a spatial or verbal cue, with the spatial cue being the more direct cue. On trials where a spatial cue was presented, there was a significantly earlier beta ERD, reflective of the certainty in which a motor plan could be carried out. Likewise, Doyle et al. (2005) showed that participants responded faster (shorter reaction time) and that their ERD response was more strongly lateralized when movement was cued to one side with certainty, compared with trials where movements were cued but no laterality directions were given. Finally, a recent MEG study demonstrated that the amplitude of the beta ERD linearly scaled with the directional uncertainty of the movement (Tzagarakis et al. 2010). More specifically, when the number of possible movement directions was high, the amplitude of the beta ERD was relatively weak, compared with when the number of possible movement directions was small or the movement direction was already known (Tzagarakis et al. 2010). These studies indicate that the beta ERD is strongly associated with movement selection. Extending this to the current study, one of the hallmark symptoms of PD is the inability of patients to start movement, leading to rigidity, bradykinesia, and instability. One of our most important findings was a lower-amplitude beta ERD response in patients with PD compared with controls. Given the beta ERD's association with movement planning and selection, these results provide a possible physiological mechanism for the difficulty or inability of patients with PD to initiate movement.
Patients with PD also exhibited a significantly reduced alpha desynchronization in the current study. Alpha desynchronization has been extensively studied over the past 15–20 years and has been hypothesized to aid in the integration of sensory cues needed for accurate movements (Pfurtscheller et al. 1997; Pfurtscheller and Lopes da Silva 1999). As such, movement-related alpha desynchronization may act as a proprioceptive “check” before and during movement to ensure that the movement is being carried out appropriately. However, in patients with PD, this decrease in alpha desynchronization may underlie some of the behavioral sequelae such as rigidity problems, and especially bradykinesia. Slowness of movement in PD could also be a compensatory mechanism in response to having reduced sensory feedback during movement.
There are two competing hypotheses for the purpose of the PMBR response, both of which could partially explain the current findings. The first hypothesis, the idling hypothesis, posits that the PMBR functions to return the motor cortex to its baseline, as the motor cortices are highly synchronous when at rest (Pfurtscheller 1992; Pfurtscheller et al. 1996; Pfurtscheller and Lopez da Silva 1999). The second, newer hypothesis, speculates that the PMBR is an active cortical motor inhibitory mechanism (Salmelin et al. 1995; Pfurtscheller et al. 1997; Cassim et al. 2001) and/or a mechanism by which afferent motor neurons input to the motor cortices (Cassim et al. 2001; Houdayer et al. 2006; Parkes et al. 2006). In the current study, the idling hypothesis would predict a weaker beta rebound after movement in patients due to the reduced beta desynchronization preceding and during movement. While we observed a trend toward reduced PMBR in patients in some brain areas (e.g. SMA), overall the effect was smaller than would be predicted by the idling hypothesis given the beta ERD results. In contrast, if the PMBR is an active inhibitory mechanism, the results of the current study could partially explain why patients with PD have an inability to stop movement and have a loss of fine motor control. Since patients with PD had a strong trend toward a lower-amplitude PMBR in the SMA, this could be associated with a loss of motor inhibition after completing a movement, leading to hypermetria.
The results of this study provide additional physiological evidence that pathological beta synchronization is associated with the movement-related behavioral abnormalities that are characteristic of patients with PD when compared with older adults without PD. These results also provide one of the first noninvasive, stepwise analyses of the cortical motor pattern in patients with PD. Previous MEG and EEG studies have exclusively used the coarse analytical framework of scalp- and sensor-based analyses, which carry a number of limitations (Bosboom et al. 2006, Berendse and Stam 2007; Stoffers et al. 2007, 2008; Bosboom, Stoffers, Stam, et al. 2009; Bosboom, Stoffers, Wolters, et al. 2009; olde Dubbelink et al. 2013). Furthermore, these studies have generally relied on measures of peak frequency, which are known to be highly variable across healthy persons and are nonquantitative. Thus, it is not totally surprising that these studies are in disagreement with the most robust findings of invasive electrophysiology, or of the results presented here. In contrast, this study used beamforming analyses to pinpoint neuronal areas in which patients differed from controls, and was the first to consider the well-established pattern of desynchronization and synchronization that occurs throughout the motor system when analyzing movement-dependent neuronal oscillations.
While the results of this study are promising, they must be taken in an associative context, as there are a number of limitations with the study. Given the heterogeneity of symptoms found in patients with PD, future studies should consist of larger cohorts with the patient population subdivided into symptom-specific groups and explore direct behavioral measures, such as individual gait analysis scores, that may parallel physiological measures such as the amplitude and latency of neural responses. Another important limitation was that a few patients had to be excluded for movement-related artifacts (e.g. tremor), which are a critical feature of the disease. Additionally, the results reported here are only from the dominant (right) hand in patients and controls. One hand is commonly more affected in patients with PD, so future studies could compare differences between the less-affected and more-affected hand to illuminate physiological links to the severity of behavioral symptoms. Nevertheless, the current study provides important evidence of aberrant cortical oscillations in patients with PD during movement and suggests that advanced MEG techniques may be a promising method to explore biomarkers for the purpose of treatment response tracking and may eventually help distinguish PD from disorders with overlapping symptomatology.
Supplementary Material
Supplementary material can be found at: http://www.cercor.oxfordjournals.org/
Funding
This work was supported by an Innovation grant from the Michael J. Fox Foundation for Parkinson's Research, the Francine and Louis Blumkin Foundation, the Community Neuroscience Pride of Nebraska Research Initiative, the Carol Swarts, M.D., Laboratory of Emerging Neuroscience Research, the Alan Baer Charitable Trust, Schumacher Foundation and National Institutes of Health grants P20 DA026146, 5P01 DA028555-02, R01 NS36126, P01 NS31492, 2R01 NS034239, P20 RR15635, P01 MH64570, P01 NS43985, and R01 NS070190, and by the Hattie B. Munroe Foundation. The Center for Magnetoencephalography at the University of Nebraska Medical Center was founded through an endowment fund from an anonymous donor. Funding to pay the Open Access publication charges for this article was provided by the University of Nebraska Medical Center Research Development Funds.
Supplementary Material
Notes
Conflict of Interest: None declared.
References
- Berendse HW, Stam CJ. Stage-dependent patterns of disturbed neural synchrony in Parkinson's disease. Parkinsonism Relat Disord. 2007;13(Suppl 3):S440–S445. doi: 10.1016/S1353-8020(08)70046-4. [DOI] [PubMed] [Google Scholar]
- Betarbet R, Sherer TB, MacKenzie G, Garcia-Osuna M, Panov AV, Greenamyre JT. Chronic systemic pesticide exposure reproduces features of Parkinson's disease. Nat Neurosci. 2000;3:1301–1306. doi: 10.1038/81834. [DOI] [PubMed] [Google Scholar]
- Bosboom JL, Stoffers D, Stam CJ, Berendse HW, Wolters ECh. Cholinergic modulation of MEG resting-state oscillatory activity in Parkinson's disease related dementia. Clin Neurophysiol. 2009;120:910–915. doi: 10.1016/j.clinph.2009.03.004. [DOI] [PubMed] [Google Scholar]
- Bosboom JL, Stoffers D, Stam CJ, van Dijk BW, Verbunt J, Berendse HW, Wolters ECh. Resting state oscillatory brain dynamics in Parkinson's disease: an MEG study. Clin Neurophysiol. 2006;117:2521–2531. doi: 10.1016/j.clinph.2006.06.720. [DOI] [PubMed] [Google Scholar]
- Bosboom JL, Stoffers D, Wolters ECh, Stam CJ, Berendse HW. MEG resting state functional connectivity in Parkinson's disease related dementia. J Neural Transm. 2009;116:193–202. doi: 10.1007/s00702-008-0132-6. [DOI] [PubMed] [Google Scholar]
- Brown P. Abnormal oscillatory synchronisation in the motor system leads to impaired movement. Curr Opin Neurobiol. 2007;17:656–664. doi: 10.1016/j.conb.2007.12.001. [DOI] [PubMed] [Google Scholar]
- Buhmann C, Glauche V, Stürenburg HJ, Oechsner M, Weiller C, Büchel C. Pharmacologically modulated fMRI—cortical responsiveness to levodopa in drug-naive hemiparkinsonian patients. Brain. 2003;126:451–461. doi: 10.1093/brain/awg033. [DOI] [PubMed] [Google Scholar]
- Cassidy M, Mazzone P, Oliviero A, Insola A, Tonali P, Di Lazzaro V, Brown P. Movement-related changes in synchronization in the human basal ganglia. Brain. 2002;125:1235–1246. doi: 10.1093/brain/awf135. [DOI] [PubMed] [Google Scholar]
- Cassim F, Monaca C, Szurhaj W, Bourriez JL, Defebvre L, Derambure P, Guieu JD. Does post-movement beta synchronization reflect an idling motor cortex? Neuroreport. 2001;12:3859–3863. doi: 10.1097/00001756-200112040-00051. [DOI] [PubMed] [Google Scholar]
- Cheyne D, Bells S, Ferrari P, Gaetz W, Bostan AC. Self-paced movements induce high-frequency gamma oscillations in primary motor cortex. Neuroimage. 2008;42:332–342. doi: 10.1016/j.neuroimage.2008.04.178. [DOI] [PubMed] [Google Scholar]
- Corti O, Lesage S, Brice A. What genetics tells us about the causes and mechanisms of Parkinson's disease. Physiol Rev. 2011;91:1161–1218. doi: 10.1152/physrev.00022.2010. [DOI] [PubMed] [Google Scholar]
- Dejean C, Hyland B, Arbuthnott G. Cortical effects of subthalamic stimulation correlate with behavioral recovery from dopamine antagonist induced akinesia. Cereb Cortex. 2009;19:1055–1063. doi: 10.1093/cercor/bhn149. [DOI] [PubMed] [Google Scholar]
- Dick FD, De Palma G, Ahmadi A, Scott NW, Prescott GJ, Bennett J, Semple S, Dick S, Counsell C, Mozzoni P, et al. Environmental risk factors for Parkinson's disease and parkinsonism: the Geoparkinson study. Occup Environ Med. 2007;64:666–672. doi: 10.1136/oem.2006.027003. [DOI] [PMC free article] [PubMed] [Google Scholar]
- Doyle LM, Yarrow K, Brown P. Lateralization of event-related beta desynchronization in the EEG during pre-cued reaction time tasks. Clin Neurophysiol. 2005;116:1879–1888. doi: 10.1016/j.clinph.2005.03.017. [DOI] [PubMed] [Google Scholar]
- Ernst MD. Permutation methods: a basis for exact inference. Stat Sci. 2004;19:676–685. [Google Scholar]
- Firestone JA, Lundin JI, Powers KM, Smith-Weller T, Franklin GM, Swanson PD, Longstreth WT, Jr, Checkoway H. Occupational factors and risk of Parkinson's disease: a population-based case-control study. Am J Ind Med. 2010;53:217–223. doi: 10.1002/ajim.20788. [DOI] [PMC free article] [PubMed] [Google Scholar]
- Firestone JA, Smith-Weller T, Franklin G, Swanson P, Longstreth WT, Jr, Checkoway H. Pesticides and risk of Parkinson disease: a population-based case-control study. Arch Neurol. 2005;62:91–95. doi: 10.1001/archneur.62.1.91. [DOI] [PubMed] [Google Scholar]
- Gaetz W, Edgar JC, Wang DJ, Roberts TP. Relating MEG measured motor cortical oscillations to resting γ-aminobutyric acid (GABA) concentration. Neuroimage. 2011;55:616–621. doi: 10.1016/j.neuroimage.2010.12.077. [DOI] [PMC free article] [PubMed] [Google Scholar]
- Gaetz W, Macdonald M, Cheyne D, Snead OC. Neuromagnetic imaging of movement-related cortical oscillations in children and adults: age predicts post-movement beta rebound. Neuroimage. 2010;51:792–807. doi: 10.1016/j.neuroimage.2010.01.077. [DOI] [PubMed] [Google Scholar]
- Gorell JM, Johnson CC, Rybicki BA, Peterson EL, Richardson RJ. The risk of Parkinson's disease with exposure to pesticides, farming, well water, and rural living. Neurology. 1998;50:1346–1350. doi: 10.1212/wnl.50.5.1346. [DOI] [PubMed] [Google Scholar]
- Gradinaru V, Mogri M, Thompson KR, Henderson JM, Deisseroth K. Optical deconstruction of parkinsonian neural circuitry. Science. 2009;324:354–359. doi: 10.1126/science.1167093. [DOI] [PMC free article] [PubMed] [Google Scholar]
- Hammond C, Bergman H, Brown P. Pathological synchronization in Parkinson's disease: networks, models and treatments. Trends Neurosci. 2007;30:357–364. doi: 10.1016/j.tins.2007.05.004. [DOI] [PubMed] [Google Scholar]
- Hillebrand A, Singh KD, Holliday IE, Furlong PL, Barnes GR. A new approach to neuroimaging with magnetoencephalography. Hum Brain Mapp. 2005;25:199–211. doi: 10.1002/hbm.20102. [DOI] [PMC free article] [PubMed] [Google Scholar]
- Hoechstetter K, Bornfleth H, Weckesser D, Ille N, Berg P, Scherg M. BESA source coherence: a new method to study cortical oscillatory coupling. Brain Topogr. 2004;16:233–238. doi: 10.1023/b:brat.0000032857.55223.5d. [DOI] [PubMed] [Google Scholar]
- Houdayer E, Labyt E, Cassim F, Bourriez JL, Derambure P. Relationship between event-related beta synchronization and afferent inputs: analysis of finger movement and peripheral nerve stimulations. Clin Neurophysiol. 2006;117:628–636. doi: 10.1016/j.clinph.2005.12.001. [DOI] [PubMed] [Google Scholar]
- Jankovic J. Parkinson's disease: clinical features and diagnosis. J Neurol Neurosurg Psychiatry. 2008;79:368–376. doi: 10.1136/jnnp.2007.131045. [DOI] [PubMed] [Google Scholar]
- Jurkiewicz MT, Gaetz WC, Bostan AC, Cheyne D. Post-movement beta rebound is generated in motor cortex: evidence from neuromagnetic recordings. Neuroimage. 2006;32:1281–1289. doi: 10.1016/j.neuroimage.2006.06.005. [DOI] [PubMed] [Google Scholar]
- Kaiser J, Birbaumer N, Lutzenberger W. Event-related beta desynchronization indicates timing of response selection in a delayed-response paradigm in humans. Neurosci Lett. 2001;312:149–152. doi: 10.1016/s0304-3940(01)02217-0. [DOI] [PubMed] [Google Scholar]
- Karrasch M, Laine M, Rapinoja P, Krause CM. Effects of normal aging on event-related desynchronization/synchronization during a memory task in humans. Neurosci Lett. 2004;366:18–23. doi: 10.1016/j.neulet.2004.05.010. [DOI] [PubMed] [Google Scholar]
- Koelewijn L, Dumont JR, Muthukumaraswamy SD, Rich AN, Singh KD. Induced and evoked neural correlates of orientation selectivity in human visual cortex. Neuroimage. 2011;54:2983–2993. doi: 10.1016/j.neuroimage.2010.11.045. [DOI] [PubMed] [Google Scholar]
- Kühn AA, Kempf F, Brücke C, Gaynor Doyle L, Martinez-Torres I, Pogosyan A, Trottenberg T, Kupsch A, Schnelder G, Hariz M, et al. High-frequency stimulation of the subthalamic nucleus suppresses oscillatory beta activity in patients with Parkinson's disease in parallel with improvement in motor performance. J Neurosci. 2008;28:6165–6173. doi: 10.1523/JNEUROSCI.0282-08.2008. [DOI] [PMC free article] [PubMed] [Google Scholar]
- Kühn AA, Williams D, Kupsch A, Limousin P, Hariz M, Schneider GH, Yarrow K, Brown P. Event-related beta desynchronization in human subthalamic nucleus correlates with motor performance. Brain. 2004;127(Pt 4):735–746. doi: 10.1093/brain/awh106. [DOI] [PubMed] [Google Scholar]
- Li S, Arbuthnott GW, Jutras MJ, Goldberg JA, Jaeger D. Resonant antidromic cortical circuit activation as a consequence of high-frequency subthalamic deep-brain stimulation. J Neurophysiol. 2007;98:3525–3537. doi: 10.1152/jn.00808.2007. [DOI] [PubMed] [Google Scholar]
- Liljeström M, Kujala J, Jensen O, Salmelin R. Neuromagnetic localization of rhythmic activity in the human brain: a comparison of three methods. Neuroimage. 2005;25:734–745. doi: 10.1016/j.neuroimage.2004.11.034. [DOI] [PubMed] [Google Scholar]
- Maris E, Oostenveld R. Nonparametric statistical testing of EEG- and MEG-data. J Neurosci Methods. 2007;164:177–190. doi: 10.1016/j.jneumeth.2007.03.024. [DOI] [PubMed] [Google Scholar]
- Missonnier P, Herrmann FR, Michon A, Fazio-Costa L, Gold G, Giannakopoulos P. Early disturbances of gamma band dynamics in mild cognitive impairment. J Neural Transm. 2010;117:489–498. doi: 10.1007/s00702-010-0384-9. [DOI] [PubMed] [Google Scholar]
- Muthukumaraswamy SD. Functional properties of human primary motor cortex gamma oscillations. J Neurophysiol. 2010;104:2873–2885. doi: 10.1152/jn.00607.2010. [DOI] [PubMed] [Google Scholar]
- olde Dubbelink KT, Stoffers D, Deijen JB, Twisk JW, Stam CJ, Berendse HW. Cognitive decline in Parkinson's disease is associated with slowing of resting-state brain activity: a longitudinal study. Neurobiol Aging. 2013;34:408–418. doi: 10.1016/j.neurobiolaging.2012.02.029. [DOI] [PubMed] [Google Scholar]
- Papp N, Ktonas P. Critical evaluation of complex demodulation techniques for the quantification of bioelectrical activity. Biomed Sci Instrum. 1977;13:135–145. [PubMed] [Google Scholar]
- Parkes LM, Bastiaansen MC, Norris DG. Combining EEG and fMRI to investigate the post-movement beta rebound. Neuroimage. 2006;29:685–696. doi: 10.1016/j.neuroimage.2005.08.018. [DOI] [PubMed] [Google Scholar]
- Pfurtscheller G. Event-related synchronization (ERS): an electrophysiological correlate of cortical areas at rest. Electroencephalogr Clin Neurophysiol. 1992;83:62–69. doi: 10.1016/0013-4694(92)90133-3. [DOI] [PubMed] [Google Scholar]
- Pfurtscheller G, Lopes da Silva FH. Event-related EEG/MEG synchronization and desynchronization: basic principles. Clin Neurophysiol. 1999;110:1842–1857. doi: 10.1016/s1388-2457(99)00141-8. [DOI] [PubMed] [Google Scholar]
- Pfurtscheller G, Neuper C, Andrew C, Edlinger G. Foot and hand area mu rhythms. Int J Psychophysiol. 1997;26:121–135. doi: 10.1016/s0167-8760(97)00760-5. [DOI] [PubMed] [Google Scholar]
- Pfurtscheller G, Stancák A, Jr, Neuper C. Post-movement beta synchronization. A correlate of an idling motor area? Electroencephalogr Clin Neurophysiol. 1996;98:281–293. doi: 10.1016/0013-4694(95)00258-8. [DOI] [PubMed] [Google Scholar]
- Rascol O, Sabatini U, Chollet F, Fabre N, Senard JM, Montastruc JL, Celsis P, Marc-Vergnes JP, Rascol A. Normal activation of the supplementary motor area in patients with Parkinson's disease undergoing long-term treatment with levodopa. J Neurol Neurosurg Psychiatry. 1994;57:567–571. doi: 10.1136/jnnp.57.5.567. [DOI] [PMC free article] [PubMed] [Google Scholar]
- Rascol O, Sabatini U, Fabre N, Brefel C, Loubinoux I, Celsis P, Senard JM, Montastruc JL, Chollet F. The ipsilateral cerebellar hemisphere is overactive during hand movements in akinetic parkinsonian patients. Brain. 1997;120:103–110. doi: 10.1093/brain/120.1.103. [DOI] [PubMed] [Google Scholar]
- Sabatini U, Boulanouar K, Fabre N, Martin F, Carel C, Colonnese C, et al. Cortical motor reorganization in akinetic patients with Parkinson's disease: a functional MRI study. Brain. 2000;123:394–403. doi: 10.1093/brain/123.2.394. [DOI] [PubMed] [Google Scholar]
- Salenius S, Avikainen S, Kaakkola S, Hari R, Brown P. Defective cortical drive to muscle in Parkinson's disease and its improvement with levodopa. Brain. 2002;125:491–500. doi: 10.1093/brain/awf042. [DOI] [PubMed] [Google Scholar]
- Salmelin R, Hämäläinen M, Kajola M, Hari R. Functional segregation of movement-related rhythmic activity in the human brain. Neuroimage. 1995;2:237–243. doi: 10.1006/nimg.1995.1031. [DOI] [PubMed] [Google Scholar]
- Schrag A, Ben-Shlomo Y, Quinn N. How valid is the clinical diagnosis of Parkinson's disease in the community? J Neurol Neurosurg Psychiatry. 2002;73:529–534. doi: 10.1136/jnnp.73.5.529. [DOI] [PMC free article] [PubMed] [Google Scholar]
- Stoffers D, Bosboom JL, Deijen JB, Wolters EC, Berendse HW, Stam CJ. Slowing of oscillatory brain activity is a stable characteristic of Parkinson's disease without dementia. Brain. 2007;130:1847–1860. doi: 10.1093/brain/awm034. [DOI] [PubMed] [Google Scholar]
- Stoffers D, Bosboom JL, Deijen JB, Wolters ECh, Stam CJ, Berendse HW. Increased cortico-cortical functional connectivity in early-stage Parkinson's disease: an MEG study. Neuroimage. 2008;41:212–222. doi: 10.1016/j.neuroimage.2008.02.027. [DOI] [PubMed] [Google Scholar]
- Swettenham JB, Muthukumaraswamy SD, Singh KD. Spectral properties of induced and evoked gamma oscillations in human early visual cortex to moving and stationary stimuli. J Neurophysiol. 2009;102:1241–53. doi: 10.1152/jn.91044.2008. [DOI] [PubMed] [Google Scholar]
- Talairach G, Tournoux P. Co-planar stereotaxic atlas of the human brain. New York, NY: Thieme; 1988. [Google Scholar]
- Taulu S, Simola J. Spatiotemporal signal space separation method for rejecting nearby interference in MEG measurements. Phys Med Biol. 2006;51:1759–1768. doi: 10.1088/0031-9155/51/7/008. [DOI] [PubMed] [Google Scholar]
- Taulu S, Simola J, Kajola M. Applications of the signal space separation method (SSS) IEEE Trans Signal Process. 2005;53:3359–3372. [Google Scholar]
- Tzagarakis C, Ince NF, Leuthold AC, Pellizzer G. Beta-band activity during motor planning reflects response uncertainty. J Neurosci. 2010;30:11270–11277. doi: 10.1523/JNEUROSCI.6026-09.2010. [DOI] [PMC free article] [PubMed] [Google Scholar]
- Uusitalo M, Ilmoniemi R. Signal-space projection method for separating MEG or EEG into components. Med Biol Eng Comput. 1997;35:135–140. doi: 10.1007/BF02534144. [DOI] [PubMed] [Google Scholar]
- van Veen BD, van Drongelen W, Yuchtman M, Suzuki A. Localization of brain electrical activity via linearly constrained minimum variance spatial filtering. IEEE Trans Biomed Eng. 1997;44:867–880. doi: 10.1109/10.623056. [DOI] [PubMed] [Google Scholar]
- Walker HC, Huang H, Gonzalez CL, Bryant JE, Killen J, Cutter GR, Knowlton RC, Montgomery EB, Guthrie BL, Watts RL. Short latency activation of cortex during clinically effective subthalamic deep brain stimulation for Parkinson's disease. Mov Disord. 2012;27:864–873. doi: 10.1002/mds.25025. [DOI] [PMC free article] [PubMed] [Google Scholar]
- Walker HC, Watts RL, Schrandt CJ, Huang H, Guthrie SL, Guthrie BL, Montgomery EB. Activation of subthalamic neurons by contralateral subthalamic deep brain stimulation in Parkinson disease. J Neurophysiol. 2011;105:1112–1121. doi: 10.1152/jn.00266.2010. [DOI] [PMC free article] [PubMed] [Google Scholar]
- Weinberger M, Mahant N, Hutchison WD, Lozano AM, Moro E, Hodaie M, Lang AE, Dostrovsky JO. Beta oscillatory activity in the subthalamic nucleus and its relation to dopaminergic response in Parkinson's disease. J Neurophysiol. 2006;96:3248–3256. doi: 10.1152/jn.00697.2006. [DOI] [PubMed] [Google Scholar]
- Wilson TW, Slason E, Asherin R, Kronberg E, Reite ML, Teale PD, Rojas DC. An extended motor network generates beta and gamma oscillatory perturbations during development. Brain Cogn. 2010;73:75–84. doi: 10.1016/j.bandc.2010.03.001. [DOI] [PMC free article] [PubMed] [Google Scholar]
- Wilson TW, Slason E, Asherin R, Kronberg E, Teale PD, Reite ML, Rojas DC. Abnormal gamma and beta MEG activity during finger movements in early-onset psychosis. Dev Neuropsychol. 2011;36:596–613. doi: 10.1080/87565641.2011.555573. [DOI] [PMC free article] [PubMed] [Google Scholar]
- Wright-Willis A, Evanoff BA, Lian M, Criswell SR, Racette BA. Geographic and ethnic variation in Parkinson disease: a population-based study of US Medicare beneficiaries. Neuroepidemiology. 2010;34:143–151. doi: 10.1159/000275491. [DOI] [PMC free article] [PubMed] [Google Scholar]
- Yousry TA, Schmid UD, Alkadhi H, Schmidt D, Peraud A, Buettner A, Winkler P. Localization of the motor hand area to a knob on the precentral gyrus. A new landmark. Brain. 1997;120:141–157. doi: 10.1093/brain/120.1.141. [DOI] [PubMed] [Google Scholar]
Associated Data
This section collects any data citations, data availability statements, or supplementary materials included in this article.