

Abstract
Context:
Vitamin D promotes bone health and regulates the immune system, both important actions for pediatric patients with inflammatory bowel disease (IBD). The supplementation dose that would maintain optimal serum 25-hydroxyvitamin D concentration (25OHD ≥ 32 ng/mL) is unknown.
Objective:
The objective of the study was to compare two supplementation regimens' efficacy and safety in maintaining optimal 25OHD in children with IBD.
Design:
This was a randomized, not blinded, controlled trial.
Setting:
The trial was conducted in the Boston Children's Hospital Clinical and Translational Study Unit.
Participants:
Sixty-three patients, aged 8–18 years with IBD and baseline 25OHD greater than 20 ng/mL were enrolled; 48 completed the study, and one withdrew for adverse events.
Intervention:
Arm A received 400 IU of oral vitamin D2 daily (n = 32). Arm B received 1000 IU daily in the summer/fall and 2000 IU in the winter/spring (n = 31).
Main Outcome:
The main outcome was the probability of maintaining 25OHD of 32 ng/mL or greater in all trimonthly visits for 12 months.
Results:
Three participants in arm A (9.4%) and three in arm B (9.7%) achieved the primary outcome (P = .97). The incidence of adverse events, all minor, did not differ. More participants in arm A developed C-reactive protein level of 1 mg/dL or greater (31% vs 10%, P = .04) and IL-6 greater than 3 pg/mL (54% vs 27%, P = .05).
Conclusions:
Daily oral vitamin D2 doses up to 2000 IU were inadequate to maintain optimal 25OHD but were well tolerated. The finding of lower incidence of elevated inflammatory markers and cytokines among participants receiving higher vitamin D2 doses merits further study.
Childhood inflammatory bowel disease (IBD) is a chronic destructive disease of the intestinal tract which is treated with medications involving significant toxicity. It has also been associated with compromised bone health, even at the time of diagnosis (1). Vitamin D may play an important role in IBD. In addition to its importance for bone health, vitamin D contributes to immune system regulation and tolerance (2). Its immunomodulatory actions include reduction in T-cell proliferation and cytokine production, and induction of regulatory T cells (3). Studies in animal and in vitro models have shown that vitamin D may play a role in moderating the disease severity in IBD (4–6).
Serum 25-hydroxyvitamin D (25OHD) is the most abundant vitamin D metabolite and its concentration reflects vitamin D status in humans (7). Optimal vitamin D status has been defined based on this vitamin's effect on bone health. The Institute of Medicine and the American Academy of Pediatrics have endorsed serum 25OHD concentration greater than 20 ng/mL as indicating sufficiency, based on prevention of rickets (8, 9). However, studies in adults have shown that maximal suppression of PTH and optimal calcium absorption are possible only when serum 25OHD concentration exceeds 32 ng/mL (10). Organizations representing populations with either increased need for vitamin D or at risk for deficiency, such as patients with cystic fibrosis, chronic kidney disease, and IBD, have endorsed serum 25OHD concentration greater than 30 ng/mL as indicating optimal vitamin D status (11–13). The serum 25OHD concentration that would exert anti-inflammatory actions has not yet been defined.
In a previous study, our group identified the dose of vitamin D needed to treat hypovitaminosis D (serum 25OHD concentration <20 ng/mL) in children with IBD (14). No studies to date have identified the vitamin D supplementation dose that will maintain serum 25OHD concentration greater than 32 ng/mL year-round in children with IBD. Moreover, no prospective study of the effect of vitamin D on inflammatory outcomes has been reported to date.
We conducted a randomized, controlled clinical trial aiming to: 1) compare the efficacy and safety of two vitamin D supplementation regimens in maintaining optimal vitamin D level; and 2) examine the effect of this intervention on inflammatory outcomes in children with IBD.
Materials and Methods
Participants
All study subjects were recruited from Boston Children's Hospital (BCH). They were eligible for participation if they had a serum 25OHD concentration greater than 20 ng/mL within 8 weeks of enrollment, were aged 5–21 years at the time of enrollment, and had the diagnosis of IBD. Patients were excluded for inability to take oral medications, pregnancy, liver or kidney failure, or the use of antiepileptic medications metabolized through cytochrome P450. The study protocol was approved by the BCH Internal Review Board, and written informed consent and assent were obtained by guardians and participants respectively. The study was overseen by a data monitoring and safety board.
Interventions
Participants were randomized to receive 1 of 2 daily oral vitamin D2 regimens; 400 IU (Arm A), 1000 IU if between May 1 and October 31 or 2000 IU if between November 1 and April 30 (Arm B). Participants of arm B were notified via a phone call to change their vitamin D dose on the date such change was due. Vitamin D2 was available in tablets of 400 IU (Nature's Bounty) and in a liquid preparation of 8000 IU/mL (Schwarz Pharma, Inc). All participants received daily calcium supplementation: 800 mg elemental calcium if younger than 11 years and 1200 mg if 11 years old or older.
Randomization/visit schedule
Randomization was based on a permuted block design. The treatment arm was assigned upon enrollment by the research pharmacist, based on a concealed randomization list. After randomization, participants received study medications and were shown their correct administration by the investigators. Participants were asked to return for follow-up visits at 3-month intervals. Visits included anthropometric measurements, physical examination, questionnaire administration, and nutritional assessment at the BCH Clinical and Translational Study Unit.
Blinding
The study investigators were blinded to the next treatment assignment to avoid the potential for selection bias; thereafter, neither participants nor investigators were blinded to treatment assignment. The absence of blinding was deemed necessary for participant safety.
Outcomes
The primary outcome was defined a priori as the probability of maintaining serum 25OHD concentration of 32 ng/mL or greater at all four follow-up visits. Secondary outcomes included measures of potential harm from vitamin D, specifically hypercalciuria [urine calcium to creatinine ratio (UCa/cr) > 0.20], hyperphosphatemia (serum phosphorus concentration > 5.7 mg/mL), hypercalcemia (serum calcium concentration > 10.5 mg/dL), and serum 25OHD concentration greater than 88 ng/mL because this concentration has been accepted as the threshold below which vitamin D intoxication has not been reported (15). Additional secondary outcomes included markers of inflammation, specifically erythrocyte sedimentation rate (ESR), serum concentration of C-reactive protein (CRP), and serum concentration of the cytokine IL-6.
Sample size
The trial was designed to compare the ability of the two treatment arms to attain serum 25OHD concentration of 32 ng/mL or greater over a 2-year period. After accounting for attrition and noncompliance, it was hypothesized that 40% of the participants taking the standard dose of vitamin D2 and 80% of those taking the higher dose would maintain their serum 25OHD concentration at or above 32 ng/mL at every 3-month follow-up interval. Under these assumptions, 30 subjects per arm would provide 82% power to detect a difference in primary outcome of 40% or greater. Preliminary analysis of the data showed that this effect size was unattainable. The data monitoring and safety board voted to stop the trial after 63 participants completed their 12-month visit.
Anthropometry
Height (Ht) was measured via a Harpenden stadiometer (Holtain Ltd) and weight (Wt) via a Scaletronix Scale (Scaletronix). Body mass index (BMI) was calculated as weight (kilograms) divided by height (meters) squared. Z-scores for weight and BMI were calculated using Epi Info software, version 3.5.3, and the CDC 2000 reference. For participants older than 20 years, Z-scores were calculated using an age of 20 years.
Disease-related data
Diagnosis of Crohn's disease (CD) and ulcerative colitis (UC) were determined using established clinical criteria (16). We reported disease activity in CD subjects using either the Pediatric Crohn's Disease Activity Index (PCDAI) (17) or the Crohn's Disease Activity Index (CDAI) (18), with a pediatric/adult age cut-off at 20 years and UC disease activity using either the Pediatric Ulcerative Colitis Activity Index (PUCAI) (19) or the Kozarec score (20) with a cut-off at 19 years. Disease was classified as inactive (PCDAI < 10, CDAI < 150, Kozarec < 4, PUCAI < 10), mild (10 ≤ PCDAI < 30, 150 ≤ CDAI < 220, 4 ≤ Kozarec ≤ 6, 10 ≤ PUCAI ≤ 34) or moderate/severe (PCDAI ≥ 30, CDAI ≥ 220, Kozarec > 6, PUCAI ≥ 35) (18, 19, 21). Data regarding hospitalizations and surgery related to IBD, use of biologic agents immunomodulators, and glucocorticoid exposure (in prednisone equivalents), complications in CD (strictures, abscesses, and fistulae), extraintestinal manifestations, and enteral supplementation were obtained through chart review and questionnaires. The finding of granulomas in histological examination of the upper gastrointestinal tract (UGI) was defined as UGI involvement in CD.
Exposure to UV radiation and other sources of vitamin D
Travel, sunscreen use, tanning, and outdoors exposure were reported using a specifically developed questionnaire (Supplement Table 1). A prospective 3-day food diary developed by BCH research nutritionists was used to record vitamin D and calcium intake through foods and supplements at each visit. The Food Processor SQL software, version 10.6.0 (ESHA Research) was used to translate information from the food diary to daily intake of relevant nutrients.
Laboratory values
Serum concentrations of 25OHD (nanograms per milliliter), calcium (Ca; milligrams per deciliter), phosphorus (P; milligrams per deciliter), C-reactive protein (CRP, milligrams per deciliter), albumin (grams per deciliter), erythrocyte sedimentation rate (ESR, millimeters per hour) as well as spot measurements of urinary calcium (milligrams per deciliter) and creatinine (Ucr, milligrams per deciliter) were obtained at each visit. Participants were asked to abstain from ingestion of dairy products and calcium supplements the day of the study visit. Serum concentrations of IL-6 (picograms per milliliter) and intact PTH (picograms per milliliter) were measured at 6-month intervals. Serum 25OHD concentration was measured at ARUP Laboratories (Salt Lake city, Utah) using DiaSorin LIAISON, a two-site chemiluminescence immunoassay that accurately detects both 25OHD2 and 25OHD3. The intra- and interassay precision is 7.3%–9.0%, and 8.6%–10.0%, respectively. The sensitivity is less than 7.0 ng/mL.
Serum PTH and IL-6 concentrations were measured at the Harvard Catalyst Central Laboratory (Brigham and Women's Hospital, Boston, Massachusetts) using the Access chemiluminescent immunoassay (Beckman Coulter), a paramagnetic chemiluminescence immunoassay. The sensitivity of the assay is 1 and 0.5 pg/mL for PTH and IL-6, respectively. The intra- and interassay variation is 1.6%–2.6% and 2.8%–5.8%, respectively, for PTH and 1.7%–4.6% and 3.1%–12.0% for IL-6.
ESR was measured using the Excyte-10 automated ESR analyzer (Vital Diagnostics) and serum albumin, CRP, Ca, P, urinary calcium, and urinary creatinine using the Cobas 6000 chemical analyzer (Roche Diagnostics) at Laboratory Corporation of America (LabCorp).
Adverse events
Clinical adverse events were reported at each follow-up visit using a questionnaire. Event reporting was both volunteered and elicited, the latter achieved by asking the participants about the occurrence of any adverse event known to be the result of vitamin D intoxication (Calciferol drops package insert, 2007). All participants reporting adverse events were retained for analysis, regardless of withdrawal status.
Compliance
Compliance to the assigned vitamin D regimen over the course of the trial was assessed by questionnaire and was expressed as percent of expected number of doses taken. Compliance was assumed to be 0 for the interval prior to a missed visit.
Statistical methods
Analysis was based on the intention-to-treat principle. The primary outcome was defined as serum 25OHD of 32 ng/mL or greater at all four follow-up visits. This was analyzed first considering missed follow-up visits as “failures” (intention to treat model) and then excluding all subjects with fewer than four follow-up visits (complete case analysis). All tests were two-sided with a value of P < .05 considered as statistically significant. The data were analyzed using SAS (SAS/STAT software, version 9.2; SAS Institute).
Data were tabulated and compared between the two arms at enrollment and at the end of the trial for subject characteristics, laboratory values, adverse events, compliance to study issued vitamin D, and attrition. Categorical variables were compared using the χ2 statistic (or Fisher's exact test) and continuous variables using the Student's t-test or the Mann-Whitney test, depending on the data distribution.
A generalized estimating equation with a logit link function was used to conduct a repeated measures logistic regression to investigate the ability of candidate variables to predict the finding of serum 25OHD of 32 ng/mL or greater at any follow-up visit. The generalized estimating equation model included baseline weight and serum 25OHD concentration, variables significantly related with serum 25OHD of 32 ng/mL or greater. Mantel-Haenszel statistics were used to examine whether treatment arm effect depended on potential confounders, specifically diagnosis, UGI involvement and immunomodulator use.
We also compared between the two arms the occurrence of IL-6 > 3 pg/mL, ESR of 30 mm/h or greater, and CRP of 1 mg/dL or greater during the study using the χ2 test or the Fisher's exact test. We a priori selected the respective cut-off points for IL-6 and CRP based on data in healthy children and clinical practice (22, 23).
Results
Between November 2007 and June 2010, 498 patients with IBD had their serum 25OHD concentrations measured as part of their clinical care in the outpatient gastroenterology clinics or inpatient units of BCH. Of the 340 participants who qualified for the trial, 63 enrolled (Figure 1).
Figure 1.

Study overview.
Table 1 presents demographic, anthropometric, and clinical characteristics and vitamin D-related summary statistics for all study participants at and prior to enrollment.
Table 1.
Patient Characteristics at Baselinea
| All (n = 63) | Missing (Arms A, B) | Daily Vitamin D2 Regimen |
P Value | ||
|---|---|---|---|---|---|
| Arm A 400 IU (n = 32) | Arm B 1000 or 2000 IU (n = 31) | ||||
| Demographics | |||||
| Age | 14.8 ± 3.1 | 0, 0 | 15.1 ± 3.1 | 14.5 ± 3.1 | .46 |
| Female gender | 36 (57%) | 0, 0 | 19 (59%) | 17 (55%) | .72 |
| Caucasian (non-Hispanic) | 59 (94%) | 0, 0 | 30 (94%) | 29 (94%) | 1.00 |
| Anthropometrics | |||||
| Wt | 54.2 (45.5, 65.0) | 0, 1 | 54.2 (43.9, 65.6) | 54.2 (47.3, 64.3) | .82 |
| Z-score Wt | 0.22 ± 1.14 | 0, 1 | 0.10 ± 1.19 | 0.34 ± 1.10 | .42 |
| BMI | 21.2 (18.2, 24.6) | 0, 1 | 21.2 (18.3, 23.8) | 21.2 (18.2, 26.2) | .42 |
| Z-score BMI | 0.33 ± 1.09 | 0, 1 | 0.18 ± 1.08 | 0.48 ± 1.10 | .28 |
| Disease related | |||||
| Diagnosis (CD)b | 37 (59%) | 0, 0 | 23 (72%) | 14 (45%) | .03 |
| Extraintestinal manifestationsc | 35 (56%) | 0, 0 | 16 (50%) | 19 (61%) | .37 |
| Complications (in CD)c | 10 (27%) | 0, 0 | 6 (26%) | 4 (29%) | 1.00 |
| Disease duration, yc | 2.4 (1.3, 4.6) | 1, 2 | 2.5 (1.3, 4.8) | 2.3 (1.0, 3.8) | .68 |
| UGI involvementc,d | 14 (38%) | 0, 0 | 11 (48%) | 3 (21%) | .11 |
| Hospitalization (IBD related)c | 38 (60%) | 0, 0 | 21 (66%) | 17 (55%) | .38 |
| Surgery (IBD related)c | 5 (8%) | 0, 2 | 3 (9%) | 2 (7%) | 1.00 |
| Glucocorticoids, mgc | 2910 (1255, 4491) | 2, 5 | 3087 (1375, 5113) | 2699 (1135, 3210) | .35 |
| Use of biologic agentsc | 24 (38%) | 0, 0 | 15 (47%) | 9 (29%) | .14 |
| Use of immunomodulatorsc | 47 (75%) | 0, 0 | 27 (84%) | 20 (65%) | 0.07 |
| Disease activity | 1, 0 | 0.79 | |||
| Inactive | 49 (79%) | 25 (80%) | 24 (77%) | ||
| Mild | 10 (16%) | 4 (13%) | 6 (19%) | ||
| Moderate/severe | 3 (5%) | 2 (6%) | 1 (3%) | ||
| ESR | 10.0 (7.0, 15.0) | 1, 3 | 10.6 (6.0, 16.0) | 8.5 (7.0, 14.0) | .62 |
| CRP | 0.1 (0.1, 0.3) | 5, 3 | 0.1 (0.1, 0.4) | 0.1 (0.1, 0.2) | .41 |
| PLTs | 319 (269, 374) | 2, 0 | 324 (283, 416) | 306 (267, 343) | .49 |
| IL-6 | 1.49 (1.07, 2.75) | 1, 1 | 1.80 (1.02, 4.80) | 1.36 (1.08, 2.39) | .17 |
| Albumin | 4.3 (4.1, 4.5) | 5, 1 | 4.2 (3.9, 4.4) | 4.3 (4.3, 4.5) | .03 |
| Vitamin D related | |||||
| Screening 25OHD | 29.0 (24.0, 36.0) | 0, 0 | 28.0 (25.5, 34.5) | 33.0 (23.0, 39.0) | .74 |
| Serum PTH | 29.6 (22.8, 38.0) | 1, 1 | 29.1 (23.1, 40.8) | 31.8 (19.2, 36.8) | .87 |
| Serum Ca | 9.5 ± 0.4 | 2, 0 | 9.5 ± 0.5 | 9.5 ± 0.3 | .77 |
| UCa/cr > 0.20 | 11 (20%) | 3, 5 | 8 (27.6%) | 3 (11.5%) | .14 |
| Vitamin D intake, IU/d | 243 (145, 463) | 3, 2 | 220 (124, 534) | 246 (146, 463) | .98 |
| Ca intake, mg/d | 1009 (629, 1317) | 3, 2 | 1029 (584, 1355) | 972 (716, 1317) | .87 |
| Season at enrollment | |||||
| Winter/spring (vs summer/fall)e | 45 (71%) | 0, 0 | 24 (75%) | 21 (68%) | .52 |
| Outdoor exposure, h/wk | 6.0 (3.0, 14.0) | 1, 0 | 5.0 (3.0, 10.0) | 6.0 (2.0, 18.0) | .76 |
Abbreviation: PLT, platelet.
Continuous variables were expressed as mean ± SD or mean (interquartile range).
Participants who did not have CD had UC.
Lifetime to enrollment.
Granulomas (in CD participants only).
Winter was December 22 to March 21; spring was March 22 to June 21; summer was June 22 to September 21; and fall was September 22 to December 21.
Participants' clinical characteristics and related mean laboratory values during the trial, anthropometrics at the end of the trial, and vitamin D-related measurements did not differ significantly between the two arms. Assuming noncompliance for missed visit intervals, the two arms did not differ in terms of percentage of study vitamin D doses taken (arm A: 70%, arm B: 68%, P = .78), or UV radiation exposure, as measured via outdoors exposure, travel to sunny areas, and seasonal distribution of study visits (Supplemental Table 2).
There was no difference between treatment arms in the primary outcome. Assuming that participants with missed visits were “failures”, only 6 of the 63 participants (10%) maintained 25OHD of 32 ng/mL or greater at all four follow-up visits. This rate was only slightly higher (18%) when the analysis was restricted to the 34 subjects with 25OHD available at all four follow-up visits. Additionally, 26 of 34 subjects with 25OHD measured at all four follow-up visits (77%) maintained 25OHD greater than 20 ng/mL, leaving 23% of the subjects with serum 25OHD concentration less than 20 ng/mL in at least one follow-up period. We observed that mean 25OHD levels were slightly higher in arm B at the 3- and 9-month visits; however, both arms' 25OHD levels exhibited decrease from the baseline at every visit, and the deficits were comparable. With the exception of the 3-month visit, the proportion of participants who maintained 25OHD of 32 ng/mL or greater at each visit occurring in winter/spring was similar in the two arms, although arm B was assigned to 2000 IU of vitamin D daily during this time (Table 2). Mantel-Haenszel statistics showed that the effect of arm on the primary outcome remained nonsignificant independent of diagnosis, UGI involvement, and immunomodulator use.
Table 2.
Primary and Secondary Outcomesa
| All (n = 63) | Missing (Arms A, B) | Daily Vitamin D2 Regimen |
P Value | ||
|---|---|---|---|---|---|
| Arm A 400 IU (n = 32) | Arm B 1000/2000 IU (n = 31) | ||||
| Primary outcome | |||||
| 25OHD≥ 32 ng/mL at four follow-up visits | |||||
| All subjects includedb | 63 | ||||
| 25OHD ≥ 32 ng/mL at four of four follow-up visits | 6 (9.5%) | 3 (9.4%) | 3 (9.7%) | .97 | |
| Subjects with four follow-up outcomes | 34 | 13, 16 | 19 | 15 | |
| 25OHD ≥ 32 ng/mL at four of four follow-up visits | 6 (17.6%) | 3 (15.8%) | 3 (20%) | .75 | |
| Secondary outcomes | |||||
| 25OHD ≥ 20 ng/mL at four follow-up visits | |||||
| All subjects includeda | 63 | ||||
| 25OHD > 20 ng/mL at four of four follow-up visits | 26 (41.3%) | 15 (46.9%) | 11 (35.5%) | .36 | |
| Subjects with four follow-up outcomes | 34 | 13, 16 | 19 | 15 | |
| 25OHD > 20 ng/mL at four of four follow-up visits | 26 (76.5%) | 15 (78.9%) | 11 (73.3%) | .70 | |
| Mean 25OHD at each follow-up visit, ng/mL | |||||
| 3 months | 30.1 ± 9.2 | 2, 0 | 27.4 ± 8.3 | 32.8 ± 9.4 | .03 |
| 6 months | 30.0 ± 10.6 | 1, 2 | 29.7 ± 10.3 | 30.2 ± 11.2 | .88 |
| 9 months | 31.8 ± 9.7 | 1, 1 | 28.8 ± 8.1 | 34.8 ± 10.5 | .03 |
| 12 months | 28.9 ± 9.1 | 1, 0 | 28.1 ± 9.4 | 29.9 ± 8.8 | .50 |
| Change in 25OHD | |||||
| 25OHD at 3 months −25OHD at screening | −2.4 ± 13.2 | 5, 3 | −3.4 ± 9.7 | −1.5 ± 16 | .60 |
| 25OHD at 6 months −25OHD at screening | −2.9 ± 14.7 | 6, 7 | −1.2 ± 9.2 | −4.7 ± 19 | .40 |
| 25OHD at 9 months −25OHD at screening | −1.3 ± 14.1 | 8, 8 | −2.2 ± 9 | −0.4 ± 18.1 | .67 |
| 25OHD at 12 months −25OHD at screening | −4.6 ± 12.9 | 6, 10 | −3.7 ± 10.8 | −5.8 ± 15.2 | .57 |
| 25OHD ≥ 32 ng/mL at each visit occurring in winter/spring (only subjects with values included) | |||||
| 3 months (n = 30; A = 17, B = 13) | 14 (46.7%) | 5 (29.4%) | 9 (69.2%) | .03 | |
| 6 months (n = 16; A = 7, B = 9) | 6 (37.5%) | 4 (57.1%) | 2 (22.2%) | .30 | |
| 9 months (n = 22; A = 11, B = 11) | 7 (31.8%) | 3 (27.3%) | 4 (36.4%) | 1.00 | |
| 12 months (n = 32; A = 18, B = 14) | 10 (31.3%) | 4 (22.2%) | 6 (42.9%) | .27 | |
| Mean PTH at follow-up visits | |||||
| 6 months | 30.0 ± 13.8 | 2, 2 | 38.1 ± 14.6 | 32.0 ± 13.0 | .33 |
| 12 months | 30.6 ± 13.3 | 0, 0 | 29.4 ± 13.7 | 32.1 ± 13.0 | .49 |
Continuous variables were expressed as mean ± SD.
Any missing outcome was considered a failure (25OHD < 32 ng/mL).
Factors significantly affecting the probability of finding serum 25OHD concentration of 32 ng/mL or greater at any visit are shown in Table 3. After adjusting for baseline 25OHD and weight, only longer outdoor exposure and higher oral vitamin D intake through foods and supplements were independently associated with attainment of 25OHD of 32 ng/mL or greater at follow-up.
Table 3.
Predictors of 25OHD ≥ 32 at Follow-Up (Unadjusted and Adjusted for B/L 25OHD ≥ 32 and B/L Weight)
| n = 60 Predictora | Unadjusted |
Adjusted for B/L 25OHD ≥ 32 and B/L Weight |
||||
|---|---|---|---|---|---|---|
| Obs | OR (95% CI) | P Value | Obs | OR (95% CI) | P Valueb | |
| B/L 25OHD ≥ 32 ng/mL | 199 | 3.35 (1.45–7.74) | .006 | 191 | 3.27 (1.35–7.88) | .01 |
| B/L weight (per 10 kg) | 191 | 0.73 (0.57–0.94) | .009 | 191 | 0.79 (0.64–0.97) | .04 |
| Weekly outdoors exposure (per 10 h)c | 182 | 1.32 (1.10–1.58) | .005 | 175 | 1.38 (1.07–1.77) | .01 |
| Supplemental daily vitamin D intake (per 100 IU)c,d | 190 | 1.27 (1.09–1.51) | .01 | 182 | 1.39 (1.16–1.65) | .002 |
Abbreviations: B/L, baseline; CI, confidence interval; Obs, observations; OR, odds ratio.
Only statistically significant predictors are presented. Diagnosis, UGI involvement, immunomodulator use were not significant.
Derived using a model including both B/L 25OHD of 32 ng/mL or greater and B/L weight in addition to the variable of interest. B/L 25OHD and B/L weight were adjusted for each other.
Mean during the trial.
Other than provided by the study.
Comparisons of the probability of developing IL-6 greater than 3 pg/mL, CRP of 1 mg/dL or greater, and ESR of 30 mm/h or greater between the two arms are shown in Figure 2.
Figure 2.
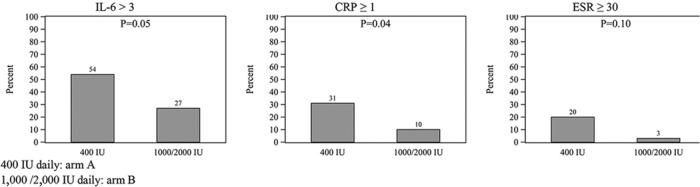
Probability of developing IL-6 greater than 3 pg/mL, CRP of 1 mg/dL or greater, and ESR of 30 mm/sec or greater during the trial in arms A and B (arm A: 400 IU daily; arm B: 1000/2000 IU daily).
Table 4 presents a summary of adverse events, attrition, and per-visit compliance during the trial, both overall and by treatment arm. These did not differ between the two arms. The 15 participants who did not complete the trial differed from the 48 who did only in disease severity (inactive/mild vs moderate/severe: 80%/20% in noncompleters, 100%/0% in completers, P = .003); they did not differ in arm assignment. Maximum 25OHD concentration was 53 ng/mL for arm A and 60 ng/mL for arm B.
Table 4.
Adverse Events and Attrition
| All (n = 63) | Treatment Arms |
P Value | ||
|---|---|---|---|---|
| A (n = 32) | B (n = 31) | |||
| Adverse events | ||||
| Subjects with any clinical adverse event | 34 (54%) | 19 (59%) | 15 (48%) | .38 |
| Clinical AEs per subject | ||||
| n | 34 | 19 | 15 | |
| Mean ± SD | 3.3 ± 2.7 | 3.2 ± 3.1 | 3.5 ± 2.1 | .69 |
| Range | 1–13 | 1–13 | 1–8 | |
| Specific adverse events | ||||
| Clinical (at any visit) | ||||
| Drowsiness | 9 (14%) | 4 (13%) | 5 (16%) | .73 |
| Increased thirst | 9 (14%) | 4 (13%) | 5 (16%) | .73 |
| Nausea | 9 (14%) | 5 (16%) | 4 (13%) | 1.00 |
| Dryness of mouth | 8 (13%) | 5 (16%) | 3 (10%) | .71 |
| Headache (persistent) | 7 (11%) | 5 (16%) | 2 (6%) | .43 |
| Unusual tiredness or weakness | 7 (11%) | 4 (13%) | 3 (10%) | 1.00 |
| Constipation | 6 (10%) | 2 (6%) | 4 (13%) | .43 |
| Loss of appetite | 6 (10%) | 4 (13%) | 2 (6%) | .67 |
| Bone pain | 5 (8%) | 3 (9%) | 2 (6%) | 1.00 |
| Vomiting | 4 (6%) | 3 (9%) | 1 (3%) | .61 |
| Muscle pain | 3 (5%) | 3 (9%) | 0 (0%) | .24 |
| Increased frequency of urination | 3 (5%) | 2 (6%) | 1 (3%) | 1.00 |
| Itching skin | 3 (5%) | 2 (6%) | 1 (3%) | 1.00 |
| Metallic taste | 3 (5%) | 2 (6%) | 1 (3%) | 1.00 |
| Increased sensitivity of eyes to light or irritation of eyes | 2 (3%) | 1 (3%) | 1 (3%) | 1.00 |
| Calcium deposits in tissues outside the bone | 1 (2%) | 0 (0%) | 1 (3%) | .49 |
| Laboratory | ||||
| Serum Ca > 10.5 mg/dL at any visit | 0 (0%) | 0 (0%) | 0 (0%) | – |
| Serum P > 5.7 mg/dL at any visit | 2 (3%) | 1 (3%) | 1 (3%) | 1.00 |
| UCa/cr > 0.20 at any visit | 20 (32%) | 11 (34%) | 9 (29%) | .65 |
| Attrition (n = 63) | .87 | |||
| Completed all study visits | 48 (76%) | 26 (81%) | 22 (71%) | .34 |
| Lost to follow-up | 11 (17%) | 4 (13%) | 7 (23%) | .29 |
| Withdrew consent | 2 (3%) | 1 (3%) | 1 (3%) | .98 |
| Withdrawn by investigator | 2 (3%) | 1 (3%)a | 1 (3%)b | .98 |
| Had all 25OHD values | 34 (54%) | 19 (59%) | 15 (48%) | .38 |
| Compliance per study visitc | ||||
| 3 months (n = 56) | 68 (50, 95) | 70 (52, 94) | 68 (48, 96) | .79 |
| 6 months (n = 53) | 70 (55, 96) | 75 (55, 96) | 69 (49, 100) | .80 |
| 9 months (n = 49) | 71 (56, 100) | 75 (59, 96) | 69 (53, 100) | .70 |
| 12 months (n = 48) | 71 (58, 100) | 75 (55, 96) | 71 (61, 100) | .66 |
One participant in arm A was withdrawn by the investigator due to taking large vitamin D supplementation doses, outside the study, and unwilling to discontinue.
One participant in arm B was withdrawn by the investigator after reporting nausea, abdominal pain, and anorexia directly after ingesting the study drug. It remains unclear whether these symptoms were IBD related.
Missing compliance data assigned to be noncompliant. Values expressed in mean (interquartile range).
Discussion
This study is the first randomized controlled trial attempting to compare efficacy and safety of two regimens of oral daily vitamin D2, specifically 400 IU vs 1000 IU in the summer and fall and 2000 IU in the winter and spring, in attaining serum 25OHD concentration of 32 ng/mL or greater in children and adolescents with IBD year-round. Additionally, the effect of vitamin D on inflammatory outcomes was examined. Oral vitamin D supplementation of up to 2000 IU daily was not successful in attaining serum 25OHD concentration of 32 ng/mL or greater throughout the year. At best, only 20% of subjects maintained this value. Both regimens were well tolerated and safe. In a secondary analysis, higher vitamin D doses were associated with lower levels of IL-6, a cytokine known for its role in the mediation of inflammation in IBD.
Studies in adults have shown that vitamin D doses similar to the doses tested in this trial would raise and maintain serum 25OHD concentration to levels of 32 ng/mL or greater throughout the year starting with a baseline 25OHD between 20 and 32 ng/mL (24, 25). Others found that vitamin D intake between 3000 and 5000 IU daily maintained serum 25OHD greater than 30 ng/mL in healthy adults (26, 27). There is no analogous study in healthy children. Sixty percent of children with chronic kidney disease maintained 25OHD greater than 30 ng/mL while receiving 2000 IU of daily vitamin D2 (28). Our finding of a significantly lower rate of maintenance of serum 25OHD greater than 30 ng/mL could be explained by the lower bioavailability of vitamin D2 in subjects with IBD, even inactive (29).
A concerning finding in our trial was that 26% of the participants randomized to the high-dose arm were unable to maintain serum 25OH concentration greater than 20 ng/mL (sufficiency cut-off) throughout the year despite receiving on average 1645 IU of vitamin D2 daily from all oral sources, an amount 2.7 times higher than the recommended by the Institute of Medicine for this age range (9).
Both regimens used were well tolerated and safe. We did not encounter hypercalcemia, although we did not measure 1,25 dihydroxyvitamin D3 [1,25(OH)2D3], the active form of the vitamin, which is responsible for many of its actions including its calcemic effect, and may be inappropriately activated in some patients with CD (30). The rare hyperphosphatemia was probably dietary in nature and balanced between the two arms. We observed a higher rate of nonfasting hypercalciuria (Uca/cr > 0.20) than that observed in healthy adolescents (31), which did not differ between arms. Higher bone turnover and use of glucocorticoids could account for this finding, since average daily calcium intake was not above the recommended daily intake. PTH levels were not elevated, but our study did not include other measures of bone turnover. There was no evidence of nephrolithiasis. Clinical adverse events may have been overestimated due to overlap with IBD-related symptoms.
In a secondary analysis, we found that a greater proportion of participants taking the higher vitamin D dose maintained IL-6 and inflammatory markers at lower levels throughout the trial. This finding should be interpreted with caution because this study was not powered to detect differences in inflammatory outcomes. IL-6 plays a pivotal role in the pathogenesis and perpetuation of inflammation in IBD by enhancing T-cell survival and inhibiting their apoptosis in the lamina propria (32). Serum IL-6 level was found to be increased in children with active IBD, and this level correlated well with acute-phase proteins (33). Among the immune regulating actions of 1,25(OH)2D3 most important for the IBD model of inflammation are the down-regulation of Th-1 T cells and the suppression of the production of proinflammatory cytokines such as IL-2, interferon-γ, IL-6, and TNF-α by these cells (34). Several studies using mice and in vitro human monocytes confirmed this potential role of vitamin D (5, 35). Two clinical trials in humans have examined the effect of vitamin D as an adjunct in the treatment of IBD. The outcomes examined were clinical relapse and CRP (36, 37). Ours is the first prospective study to report a negative association between vitamin D intake and circulating IL-6 level in patients with IBD. The finding of an association between intake of higher doses of vitamin D and reduced inflammatory markers despite similar serum 25OHD concentration is perplexing. Recent literature supports the role of free vitamin D, the parent compound, as well as free 25OHD in extrarenal tissue function (38, 39). Differential levels of vitamin D binding protein or affinity of vitamin D metabolites toward this protein could lead to differences in free metabolite levels, which are not measured with conventional assays such as the one used in this trial. It is possible that subjects receiving higher vitamin D doses achieved higher concentration of free, unbound to protein vitamin D or 25OHD levels, which could have accounted for the differential effect on inflammatory markers.
Baseline serum 25OHD concentration of 32 ng/mL or greater, lengthier outdoor exposure, higher vitamin D intake through diet and supplements outside of the trial, and lower body weight were independently associated with serum 25OHD of 32 ng/mL or greater. The positive influence of the first three factors could be explained as the effect of a higher total body vitamin D content and higher input of vitamin D. Studies, including our own, showed that vitamin D repletion and supplementation regimens should be based on body weight (14, 40).
Our study has several limitations. First, it was subject to premature closure due to lack of power to detect smaller differences in outcome. However, we consider that the finding that the vitamin D doses used were inadequate to even remotely reach our goal is in itself significant. Vitamin D2 was selected due to the wide commercial availability of this form at the time the study was conducted, although it is established that vitamin D3 is more potent than vitamin D2. Additionally, we did not measure 1,25(OH)2D, or free vitamin D and 25OHD levels, which could interpret our results in part. Finally, lack of a control group did not allow us to compare the outcome with healthy children and adolescents. Nonetheless, our study is the first randomized, controlled trial of vitamin D supplementation in this population and provides initial evidence, needing to be confirmed with larger scale trials, that vitamin D doses as high as 2000 IU daily are safe and well tolerated. A further strength is that we included detailed dietary intake data and compliance data.
In conclusion, we found that daily oral doses of vitamin D supplementation of up to 2000 IU are inadequate to maintain serum 25OHD concentration of 32 ng/mL or greater in children and adolescents with IBD. We also found such doses to be safe and well tolerated. Our findings advocate for taking into account body weight when dosing vitamin D supplementation. The finding that intake of higher vitamin D doses are associated with lower levels of IL-6 and inflammatory markers is intriguing and merits further study. We propose the conduct of larger scale, dose-finding trials with the specific aim to maintain a predefined vitamin D level throughout the year in healthy children as well as children with various chronic diseases. In addition, functional outcomes of target vitamin D levels, such as bone health, muscle strength, and inflammatory outcomes, should be examined prospectively.
Acknowledgments
We thank Drs Richard Grand and Bess Dawson-Hughes for their intellectual contribution and guidance, Boston Children's Hospital Clinical and Translational Study Unit nursing staff and ancillary staff for their dedication to our research patients, and our patients and their families for their participation in this study.
This study was registered at clinicaltrials.gov with the number NCT00621257.
This work was supported in part by National Institutes of Health Grants K23 DK076979, CCFA-1716, and CDHNF-06-004 (to H.M.P.), National Institutes of Health Award MO1-RR02172 (to the General Clinical Research Council) from the National Center for Research Resources, National Institutes of Health (to the Children's Hospital Boston General Clinical Research Center, which is now named Clinical and Translational Study Unit and is supported by Harvard Catalyst Grant UL1RR025758).
Disclosure Summary: The authors have nothing to disclose.
Footnotes
- BCH
- Boston Children's Hospital
- BMI
- body mass index
- Ca
- calcium
- CD
- Crohn's disease
- CDAI
- Crohn's Disease Activity Index
- CRP
- C-reactive protein
- ESR
- erythrocyte sedimentation rate
- Ht
- height
- IBD
- inflammatory bowel disease
- 25OHD
- 25-hydroxyvitamin D concentration
- 1,25(OH)2D3
- 1,25 dihydroxyvitamin D3
- P
- phosphorus
- PCDAI
- Pediatric Crohn's Disease Activity Index
- PUCAI
- Pediatric Ulcerative Colitis Activity Index
- UC
- ulcerative colitis
- UCa/cr
- urine calcium to creatinine ratio
- UGI
- upper gastrointestinal tract
- Wt
- weight.
References
- 1. Harpavat M, Greenspan SL, O'Brien C, Chang CC, Bowen A, Keljo DJ. Altered bone mass in children at diagnosis of Crohn disease: a pilot study. J Pediatr Gastroenterol Nutr. 2005;40:295–300 [DOI] [PubMed] [Google Scholar]
- 2. Hewison M. An update on vitamin D and human immunity. Clin Endocrinol (Oxf). 2012;76:315–325 [DOI] [PubMed] [Google Scholar]
- 3. Cantorna MT. Vitamin D, multiple sclerosis and inflammatory bowel disease. Arch Biochem Biophys. 2012;523:103–106 [DOI] [PMC free article] [PubMed] [Google Scholar]
- 4. Zhu Y, Mahon BD, Froicu M, Cantorna MT. Calcium and 1α,25-dihydroxyvitamin D3 target the TNF-α pathway to suppress experimental inflammatory bowel disease. Eur J Immunol. 2005;35:217–224 [DOI] [PubMed] [Google Scholar]
- 5. Verlinden L, Leyssens C, Beullens I, et al. The vitamin D analog TX527 ameliorates disease symptoms in a chemically induced model of inflammatory bowel disease. J Steroid Biochem Mol Biol. 2013;136:107–111 [DOI] [PubMed] [Google Scholar]
- 6. Goff JP, Koszewski NJ, Haynes JS, Horst RL. Targeted delivery of vitamin D to the colon using β-glucuronides of vitamin D: therapeutic effects in a murine model of inflammatory bowel disease. Am J Physiol Gastrointest Liver Physiol. 2012;302:G460–G469 [DOI] [PMC free article] [PubMed] [Google Scholar]
- 7. Norman AW. From vitamin D to hormone D: fundamentals of the vitamin D endocrine system essential for good health. Am J Clin Nutr. 2008;88:491S–499S [DOI] [PubMed] [Google Scholar]
- 8. Misra M, Pacaud D, Petryk A, Collett-Solberg PF, Kappy M. Vitamin D deficiency in children and its management: review of current knowledge and recommendations. Pediatrics. 2008;122:398–417 [DOI] [PubMed] [Google Scholar]
- 9. Dietary Reference Intakes for Calcium and Vitamin D. Washington, DC: The National Academies Press; 2011 [PubMed] [Google Scholar]
- 10. Lips P, Hosking D, Lippuner K, et al. The prevalence of vitamin D inadequacy amongst women with osteoporosis: an international epidemiological investigation. J Intern Med. 2006;260:245–254 [DOI] [PubMed] [Google Scholar]
- 11. KDOQI Work Group. Clinical practice guideline for nutrition in children with CKD: 2008 update. Executive summary. Am J Kidney Dis. 2009;53:S11–S104 [DOI] [PubMed] [Google Scholar]
- 12. Pappa H, Thayu M, Sylvester F, Leonard M, Zemel B, Gordon C. Skeletal health of children and adolescents with inflammatory bowel disease. J Pediatr Gastroenterol Nutr. 2011;53:11–25 [DOI] [PMC free article] [PubMed] [Google Scholar]
- 13. Tangpricha V, Kelly A, Stephenson A, et al. An update on the screening, diagnosis, management, and treatment of vitamin D deficiency in individuals with cystic fibrosis: evidence-based recommendations from the Cystic Fibrosis Foundation. J Clin Endocrinol Metab. 2012;97:1082–1093 [DOI] [PubMed] [Google Scholar]
- 14. Pappa HM, Mitchell PD, Jiang H, et al. Treatment of vitamin D insufficiency in children and adolescents with inflammatory bowel disease: a randomized clinical trial comparing three regimens. J Clin Endocrinol Metab. 2012;97:2134–2142 [DOI] [PMC free article] [PubMed] [Google Scholar]
- 15. Hathcock JN, Shao A, Vieth R, Heaney R. Risk assessment for vitamin D. Am J Clin Nutr. 2007;85:6–18 [DOI] [PubMed] [Google Scholar]
- 16. Bousvaros A, Antonioli DA, Colletti RB, et al. Differentiating ulcerative colitis from Crohn disease in children and young adults: report of a working group of the North American Society for Pediatric Gastroenterology, Hepatology, and Nutrition and the Crohn's and Colitis Foundation of America. J Pediatr Gastroenterol Nutr. 2007;44:653–674 [DOI] [PubMed] [Google Scholar]
- 17. Hyams JS, Ferry GD, Mandel FS, et al. Development and validation of a pediatric Crohn's disease activity index. J Pediatr Gastroenterol Nutr. 1991;12:439–447 [PubMed] [Google Scholar]
- 18. Best WR, Becktel JM, Singleton JW, Kern F., Jr Development of a Crohn's disease activity index. National Cooperative Crohn's Disease Study. Gastroenterology. 1976;70:439–444 [PubMed] [Google Scholar]
- 19. Turner D, Otley AR, Mack D, et al. Development, validation, and evaluation of a pediatric ulcerative colitis activity index: a prospective multicenter study. Gastroenterology. 2007;133:423–432 [DOI] [PubMed] [Google Scholar]
- 20. Kozarek RA, Patterson DJ, Gelfand MD, Botoman VA, Ball TJ, Wilske KR. Methotrexate induces clinical and histologic remission in patients with refractory inflammatory bowel disease. Ann Intern Med. 1989;110:353–356 [DOI] [PubMed] [Google Scholar]
- 21. Srivastava M, Zurakowski D, Cheifetz P, Leichtner A, Bousvaros A. Elevated serum hepatocyte growth factor in children and young adults with inflammatory bowel disease. J Pediatr Gastroenterol Nutr. 2001;33:548–553 [DOI] [PubMed] [Google Scholar]
- 22. Sack U, Burkhardt U, Borte M, Schadlich H, Berg K, Emmrich F. Age-dependent levels of select immunological mediators in sera of healthy children. Clin Diagn Lab Immunol. 1998;5:28–32 [DOI] [PMC free article] [PubMed] [Google Scholar]
- 23. Clyne B, Olshaker JS. The C-reactive protein. J Emerg Med. 1999;17:1019–1025 [DOI] [PubMed] [Google Scholar]
- 24. Barger-Lux MJ, Heaney RP, Dowell S, Chen TC, Holick MF. Vitamin D and its major metabolites: serum levels after graded oral dosing in healthy men. Osteoporos Int. 1998;8:222–230 [DOI] [PubMed] [Google Scholar]
- 25. Vieth R, Chan PC, MacFarlane GD. Efficacy and safety of vitamin D3 intake exceeding the lowest observed adverse effect level. Am J Clin Nutr. 2001;73:288–294 [DOI] [PubMed] [Google Scholar]
- 26. Aloia JF, Patel M, Dimaano R, et al. Vitamin D intake to attain a desired serum 25-hydroxyvitamin D concentration. Am J Clin Nutr. 2008;87:1952–1958 [DOI] [PubMed] [Google Scholar]
- 27. Heaney RP, Davies KM, Chen TC, Holick MF, Barger-Lux MJ. Human serum 25-hydroxycholecalciferol response to extended oral dosing with cholecalciferol. Am J Clin Nutr. 2003;77:204–210 [DOI] [PubMed] [Google Scholar]
- 28. Shroff R, Wan M, Gullett A, et al. Ergocalciferol supplementation in children with CKD delays the onset of secondary hyperparathyroidism: a randomized trial. Clin J Am Soc Nephrol. 2012;7:216–223 [DOI] [PubMed] [Google Scholar]
- 29. Farraye FA, Nimitphong H, Stucchi A, et al. Use of a novel vitamin D bioavailability test demonstrates that vitamin D absorption is decreased in patients with quiescent Crohn's disease. Inflamm Bowel Dis. 2011;17:2116–2121 [DOI] [PubMed] [Google Scholar]
- 30. Abreu MT, Kantorovich V, Vasiliauskas EA, et al. Measurement of vitamin D levels in inflammatory bowel disease patients reveals a subset of Crohn's disease patients with elevated 1,25-dihydroxyvitamin D and low bone mineral density. Gut. 2004;53:1129–1136 [DOI] [PMC free article] [PubMed] [Google Scholar]
- 31. So NP, Osorio AV, Simon SD, Alon US. Normal urinary calcium/creatinine ratios in African-American and Caucasian children. Pediatr Nephrol. 2001;16:133–139 [DOI] [PubMed] [Google Scholar]
- 32. Atreya R, Mudter J, Finotto S, et al. Blockade of interleukin 6 trans signaling suppresses T-cell resistance against apoptosis in chronic intestinal inflammation: evidence in Crohn disease and experimental colitis in vivo. Nat Med. 2000;6:583–588 [DOI] [PubMed] [Google Scholar]
- 33. Hyams JS, Fitzgerald JE, Treem WR, Wyzga N, Kreutzer DL. Relationship of functional and antigenic interleukin 6 to disease activity in inflammatory bowel disease. Gastroenterology. 1993;104:1285–1292 [DOI] [PubMed] [Google Scholar]
- 34. Griffin MD, Xing N, Kumar R. Vitamin D and its analogs as regulators of immune activation and antigen presentation. Annu Rev Nutr. 2003;23:117–145 [DOI] [PubMed] [Google Scholar]
- 35. Dickie LJ, Church LD, Coulthard LR, Mathews RJ, Emery P, McDermott MF. Vitamin D3 down-regulates intracellular Toll-like receptor 9 expression and Toll-like receptor 9-induced IL-6 production in human monocytes. Rheumatology (Oxford). 2010;49:1466–1471 [DOI] [PubMed] [Google Scholar]
- 36. Jorgensen SP, Agnholt J, Glerup H, et al. Clinical trial: vitamin D3 treatment in Crohn's disease—a randomized double-blind placebo-controlled study. Aliment Pharmacol Ther. 2010;32:377–383 [DOI] [PubMed] [Google Scholar]
- 37. Miheller P, Muzes G, Hritz I, et al. Comparison of the effects of 1,25 dihydroxyvitamin D and 25 hydroxyvitamin D on bone pathology and disease activity in Crohn's disease patients. Inflamm Bowel Dis. 2009;15:1656–1662 [DOI] [PubMed] [Google Scholar]
- 38. Hollis BW, Wagner CL. The role of the parent compound vitamin D with respect to metabolism and function: why clinical dose intervals can affect clinical outcomes. J Clin Endocrinol Metab. 2013;98:4619–4628 [DOI] [PMC free article] [PubMed] [Google Scholar]
- 39. Chun RF, Peercy BE, Orwoll ES, Nielson CM, Adams JS, Hewison M. Vitamin D and DBP: the free hormone hypothesis revisited [published online October 3, 2013]. J Steroid Biochem Mol Biol. doi:10.1016/j.jsbmb.2013.09.012 [DOI] [PMC free article] [PubMed] [Google Scholar]
- 40. van Groningen L, Opdenoordt S, van Sorge A, Telting D, Giesen A, de Boer H. Cholecalciferol loading dose guideline for vitamin D-deficient adults. Eur J Endocrinol. 2010;162:805–811 [DOI] [PubMed] [Google Scholar]