

Abstract
Context:
The mechanism(s) responsible for diurnal variations in insulin sensitivity of glucose metabolism in healthy people are unclear.
Objective:
The objective of the study was to evaluate whether diurnal variations in whole-body and cellular fatty acid metabolism could contribute to evening insulin resistance in metabolically normal people.
Subjects and Design:
We measured plasma the free fatty acid (FFA) concentration, palmitate kinetics, and skeletal muscle expression of genes involved in fatty acid metabolism at breakfast (7:00 am) and dinner (7:00 pm) in 13 overweight (body mass index 27.8 ± 1.2 kg/m2) but metabolically normal, women.
Results:
Plasma FFA concentration was approximately 30% greater just before consuming dinner than breakfast (P < .05) and remained greater after dinner than breakfast (FFA areas under the curve: 0.88 ± 0.33 and 0.51 ± 0.09 μmol/mL × 4 h, P = .001). However, adipose tissue lipolytic activity was not different in the evening and in the morning. Skeletal muscle expression of genes that regulate fatty acid oxidation were 38–82% lower, whereas genes involved in de novo lipogenesis were 51%-87 % higher before dinner than before breakfast (all P < .05), and these changes were associated with diurnal variation in the muscle expression of core clock genes that regulate fatty acid metabolism.
Conclusion:
Metabolically normal women demonstrate diurnal variations in fatty acid metabolism, manifested by an increase in circulating FFAs, presumably derived from previous meal consumption rather than lipolysis of adipose tissue triglycerides, and a shift in muscle fatty acid metabolism from oxidation to lipogenesis. These metabolic alterations could be responsible for the known evening decline in insulin sensitivity.
Many metabolic pathways and functions vary according to the time of day (1). In healthy people, insulin sensitivity with respect to glucose metabolism is lower in the evening than in the morning (2–4). Consequently, glucose or meal ingestion results in a greater increase in plasma glucose concentration in the evening than in the morning (3–5). The mechanism(s) responsible for diurnal variation in insulin action is not known but could be related to alterations in systemic free fatty acid (FFA) availability and muscle fatty acid metabolism. Increased FFA availability from plasma can cause insulin resistance in skeletal muscle (6). Furthermore, clock genes, which regulate circadian rhythm, could contribute to diurnal variation in muscle insulin action because they have been shown to regulate insulin sensitivity and fatty acid metabolic pathways in rodent models (1).
The purpose of the present study was to test the hypothesis that diurnal variations in clock gene expression, plasma FFA availability, and muscle fatty acid metabolism are associated with diurnal variation in insulin-mediated glucose metabolism. Accordingly, we evaluated the effect of consuming identical breakfast and dinner meals on plasma glucose, insulin, and FFA concentrations, adipose tissue lipolytic rate, and diurnal variation in expression of genes associated with adipose tissue lipolytic activity and skeletal muscle fatty acid metabolism in metabolically normal women.
Methods and Materials
Study subjects
Thirteen women participated in this study (Supplemental Table 1). All subjects were considered to be metabolically normal, based on a history and physical examination, an oral glucose tolerance test, and one or fewer metabolic syndrome criteria (7). Written informed consent was obtained before the subjects participated in the study, which was approved by the Institutional Review Board of Washington University School of Medicine.
Experimental procedures
Total body fat mass and fat-free mass (FFM) were determined by using dual-energy X-ray absorptiometry. Intraabdominal adipose tissue volume and intrahepatic triglyceride content were quantified by using magnetic resonance imaging and magnetic resonance spectroscopy (8). Resting energy expenditure was determined by measuring the expiratory gas exchange (TrueOne 2400; ParvoMedics), and the total daily energy requirement was calculated as 1.2 × resting energy expenditure (9).
Subjects were admitted to the Clinical Research Unit in the evening before the study and consumed a standard dinner (12 kcal/kg FFM) at 6:00 pm. At 9:00 pm, catheters were inserted into an antecubital vein for palmitate tracer infusion and a contralateral radial artery for blood sampling. Subjects consumed three identical liquid mixed meals at 7:00 am (breakfast), 12:30 pm (lunch), and 7:00 pm (dinner). Each meal contained one third of each subject's estimated total daily energy requirement (55% of total energy as carbohydrates, 15% as protein, and 30% as fat) and was consumed in five equal aliquots every 5 minutes for 20 minutes. The meal was designed to be very low in palmitate (7% of total fatty acids) (Supplemental Table 2) to reduce the impact of ingested palmitate on the evaluation of adipose tissue lipolytic activity assessed by palmitate tracer infusion (10). Subjects rested in bed to avoid the influence of physical activity on our outcome measures. A constant infusion of [U-13C16]palmitate (6 nmol/kg FFM per minute) was started 90 minutes before and continued for 4 hours after starting breakfast and dinner. Blood samples were obtained 10 minutes and immediately before and at 20, 40, 60, 90, 120, 150, 180, and 240 minutes after starting breakfast and dinner. Subcutaneous abdominal adipose tissue and skeletal muscle (vastus lateralis) biopsies were obtained at 6:00 am and 6:00 pm, as described previously (11). The second fat biopsy was obtained from the opposite side of the abdomen of the first biopsy in all 13 subjects. The second muscle biopsy was obtained from the opposite leg of the first biopsy (data were available for six subjects).
Sample analyses
Plasma glucose, insulin, and FFA concentrations and palmitate tracer to tracee ratio were determined as previously described (12). Plasma cortisol was measured by using an immunoassay (Elecsys; Roche Diagnostics GmbH). Gene expression was determined by using real-time PCR (primer sequences in Supplemental Table 3) based on their cycle threshold (CT) values relative to glyceraldehyde-3-phosphate dehydrogenase (GAPDH), as previously described (11).
Plasma substrate and hormone concentration total areas under the curve (AUCs) and incremental AUC (iAUC) from baseline values before and for 4 hours after breakfast and dinner were calculated by using the trapezoid method. The palmitate rate of appearance (Ra) of total FFA Ra in plasma was calculated as previously described (10).
Statistical analysis
The differences between single values obtained at breakfast and dinner were evaluated by using the paired Student's t test. Repeated-measures ANOVA was used to compare changes in substrate kinetics and concentrations induced by breakfast and dinner. Based on the within subject day-to-day variability of palmitate and FFA Ra measurements (our primary outcome) in our previous studies (13, 14), we estimated that 13 subjects would be sufficient to detect a 15% or greater difference between the morning and evening palmitate/FFA Ra, with a power of 0.80 or greater and a type I error less than 0.05. A value of P < .05 was considered statistically significant. Results are presented as means ± SD, unless otherwise stated.
Results
Plasma glucose, insulin, and cortisol
Plasma glucose iAUC (Figure 1A) and total AUC (33.5 ± 5.1 and 30.0 ± 3.4 mmol/L × 4 h, P = .016) for the 4-hour postprandial period were greater after dinner than breakfast. Plasma insulin iAUC (1438 ± 483 and 1360 ± 567 pmol/L × 4 h, P = .66) and total AUC (1626 ± 542 and 1521 ± 575 pmol/L × 4 h, P = .54) were not different after dinner and breakfast. These findings suggest that insulin sensitivity with respect to glucose metabolism was lower in the evening than in the morning, which is consistent with results from previous studies conducted in healthy people (2–4). Plasma cortisol concentration was lower at 6:00 pm than at 6:00 am (140 ± 87 and 468 ± 207 nmol/L, P < .001).
Figure 1.

Plasma glucose iAUC after breakfast (7:00 am) and dinner (7:00 pm) (A). Plasma FFA concentration after breakfast and dinner (B), the percentage of total plasma FFA as C16:0 (palmitate) and C18:1 (oleate) right before breakfast and dinner (C), the FFA Ra (D), and palmitate Ra (E) after breakfast and dinner, and adipose tissue gene expression of ATGL and HSL at 6:00 am (before breakfast) and 6:00 pm (before dinner) (F) are shown. Expression of ATGL and HSL was normalized to GAPDH expression. There was a significant meal × time interaction for plasma FFA concentration and FFA Ra (P < .05, repeated-measures ANOVA) but not palmitate Ra. *, Value before dinner is significantly different from the value before breakfast, P < .05. Data are means ± SEM.
Fatty acid metabolism
Plasma FFA concentration was approximately 30% greater before dinner than before breakfast (0.68 ± 0.24 and 0.52 ± 0.12 μmol/mL, P = .011) (Figure 1B). The contribution of C16:0 (palmitate) to total FFA concentration decreased from 24.9% ± 2.0% before breakfast to 20.8% ± 2.6% before dinner (P < .001), whereas the contribution of C18:1 (oleate) increased from 39.5% ± 3.0% before breakfast to 45.1% ± 3.4% before dinner (P < .001) (Figure 1C). Meal ingestion rapidly reduced plasma FFA concentration by approximately 10-fold after both breakfast and dinner, but plasma FFA concentrations (Figure 1B) and the FFA AUC (0.88 ± 0.33 and 0.51 ± 0.09 μmol/mL × 4 h, P = .001) remained greater after dinner than breakfast. Although plasma FFA Ra (Figure 1D) and FFA Ra AUC (534 ± 204 and 360 ± 111 μmol/kg, P = .003) were greater at dinner than at breakfast, palmitate Ra at dinner was not different from that at breakfast (Figure 1E). Adipose tissue triglyceride lipase (ATGL) was the same, and hormone sensitive lipase (HSL) was slightly lower at 6:00 pm (before dinner) than at 6:00 am (before breakfast) (Figure 1F).
Expression of genes involved in muscle fatty acid oxidation [pyruvate dehydrogenase kinase 4 (PDK4), uncoupling protein-3 (UCP3), and carnitine palmitoyltransferase 1A (CPT1A)] were lower at 6:00 pm than at 6:00 am (Figure 2A). In contrast, the expressions of genes involved in de novo lipogenesis [sterol regulatory element binding protein-1c (SREBP-1c) and fatty acid synthase (FAS)] were greater at 6:00 pm than at 6:00 am (Figure 2B). We also found diurnal variations in the core clock genes circadian locomotor output cycles kaput (CLOCK), brain, and muscle Arnt-like protein 1 (BMAL1), period 1 and 2 (PER1 and PER2), cryptochrome 1 (CRY1), and D site of albumin promoter (albumin D-box) binding protein (DBP) in skeletal muscle (Figure 2C). CRY2 expression in the morning was not different from that in the evening (data not shown).
Figure 2.
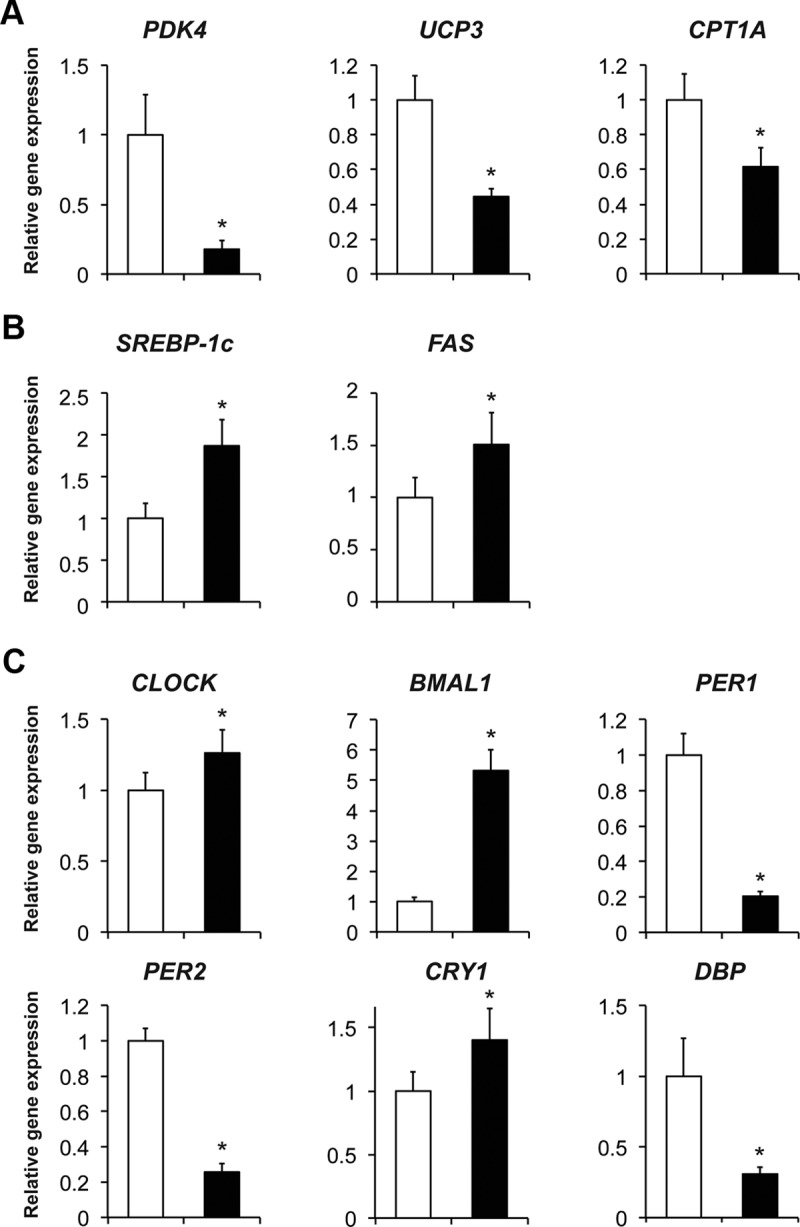
Skeletal muscle expression of genes involved in fatty acid oxidation (A) and de novo lipogenesis (B) and core clock genes (C) at 6:00 am (before breakfast, white bar) and at 6:00 pm (before dinner, black bar) (n = 5–6) is shown. The expression of genes of interest was normalized to GAPDH expression. *, Value before dinner is significantly different from the value before breakfast, P < .05. Data are means ± SEM.
Discussion
Although insulin sensitivity and glucose tolerance are often worse in the evening than in the morning in healthy people (2–5), the mechanism(s) responsible for diurnal variation in glucose homeostasis are not clear. We investigated whether there are diurnal variations in fatty acid metabolism that could contribute to this phenomenon in metabolically normal women and found that insulin resistance with respect to glucose metabolism in the evening was accompanied by increased plasma FFA availability. The increased FFA availability was likely derived from the hydrolysis of chylomicron triglycerides from previous meals, not from an increase in adipose tissue lipolytic activity, because palmitate Ra and adipose tissue gene expression of lipolytic enzymes were the same or lower in the evening than in the morning. In addition, the percentage of total plasma FFAs as palmitate was lower at dinner than breakfast, and the percentage of total plasma FFAs as oleate was higher at dinner than breakfast, suggesting an increased contribution of FFAs from ingested meals, which contained predominantly oleate and little palmitate. These data demonstrate a plausible mechanism for a decrease in insulin sensitivity in the evening in healthy people because an increase in circulating FFAs can cause insulin resistance (6).
We also found a diurnal variation in skeletal muscle expression of genes involved in regulating fatty acid metabolism; the expression of genes that regulate fatty acid oxidation was lower, whereas the expression of genes involved in de novo lipogenesis was higher, at 6:00 pm (before dinner) than at 6:00 am (before breakfast). These data suggest a shift from muscle fatty acid oxidation toward lipogenesis in the evening, which could lead to insulin resistance by producing specific fatty acid metabolites that impair insulin action (15). The mechanism(s) responsible for this diurnal variability is not clear but could be related to the expression of core clock genes, which oscillate in adipose tissue and muscle in people (16–18) and regulate fatty acid metabolic pathways (1, 19). It is also possible that the differences in the duration of fasting before breakfast (12 h fast) and dinner (6.5 h since the last meal) influenced the expression of core clock genes. Nonetheless, our data represent the normal diurnal variations in metabolic pathways in people consuming a typical daily meal pattern.
The antiphase nature of muscle CLOCK/BMAL1 and PER1/PER2/DBP expression in our study subjects is consistent with the results from previous studies that evaluated their expression in human muscle and adipose tissue (17, 18). However, the morning-to-evening direction of the variation in muscle clock gene expression in people is opposite from the direction observed in nocturnal mice (17, 19, 20). Taken together, the data from our study and previous studies conducted in people and rodents support the notion that the core molecular clock machinery is involved in regulating both diurnal variations in fatty acid metabolism and insulin action.
In conclusion, the present study demonstrates that insulin resistance in the evening is associated with both an increase in circulating FFAs and alterations in cellular metabolic pathways associated with skeletal muscle fatty acid metabolism and core clock genes in metabolically normal women. However, our study is not able to prove a direct cause-and-effect relationship between diurnal variations in fatty acid metabolism and insulin resistance. Further studies are needed to evaluate the complex mechanistic relationships among clock genes and metabolic pathways in people.
Acknowledgments
We thank Martha Hessler for help with subject recruitment; Janine Kampelman, Jennifer Shew, Freida Custodio, Anna C. Moseley, Kelly L. Stromsdorfer, and Ioana Gruchevska for technical assistance; the staff of the Clinical Research Unit for their help in performing the studies; and the study subjects for their participation.
This study was registered at clinicaltrials.gov as trial number NCT02011581.
This study was supported by National Institutes of Health Grants DK37948 and DK56341 (to the Washington University School of Medicine Nutrition Obesity Research Center), Grant DK020579 (to the Washington University School of Medicine Diabetes Research Center), Grant RR00954 (to the Washington University Biomedical Mass Spectrometry Resource), Grant UL1 TR000448 (to the Washington University School of Medicine Clinical Translational Science Award) including KL2 Subaward TR000450, and the Central Society for Clinical and Translational Research Early Career Development Award.
Disclosure Summary: S.K. is a shareholder and consultant for Aspire Bariatrics and serves on the Scientific Advisory Boards for NovoNordisk, Takeda Pharmaceuticals, the Egg Nutrition Council, and NuSi. The other authors have nothing to declare.
Footnotes
- ATGL
- adipose tissue triglyceride lipase
- AUC
- area under the curve
- iAUC
- incremental AUC
- FFA
- free fatty acid
- FFM
- fat-free mass
- GAPDH
- glyceraldehyde-3-phosphate dehydrogenase
- HSL
- hormone sensitive lipase
- Ra
- rate of appearance.
References
- 1. Maury E, Ramsey KM, Bass J. Circadian rhythms and metabolic syndrome: from experimental genetics to human disease. Circ Res. 2010;106:447–462 [DOI] [PMC free article] [PubMed] [Google Scholar]
- 2. Morgan LM, Aspostolakou F, Wright J, Gama R. Diurnal variations in peripheral insulin resistance and plasma non-esterified fatty acid concentrations: a possible link? Ann Clin Biochem. 1999;36(Pt 4):447–450 [DOI] [PubMed] [Google Scholar]
- 3. Saad A, Dalla Man C, et al. Diurnal pattern to insulin secretion and insulin action in healthy individuals. Diabetes. 2012;61:2691–2700 [DOI] [PMC free article] [PubMed] [Google Scholar]
- 4. Lee A, Ader M, Bray GA, Bergman RN. Diurnal variation in glucose tolerance. Cyclic suppression of insulin action and insulin secretion in normal-weight, but not obese, subjects. Diabetes. 1992;41:750–759 [DOI] [PubMed] [Google Scholar]
- 5. Van Cauter E, Shapiro ET, Tillil H, Polonsky KS. Circadian modulation of glucose and insulin responses to meals: relationship to cortisol rhythm. Am J Physiol. 1992;262:E467–E475 [DOI] [PubMed] [Google Scholar]
- 6. Roden M, Price TB, Perseghin G, et al. Mechanism of free fatty acid-induced insulin resistance in humans. J Clin Invest. 1996;97:2859–2865 [DOI] [PMC free article] [PubMed] [Google Scholar]
- 7. Third Report of the National Cholesterol Education Program (NCEP) Expert Panel on Detection, Evaluation, and Treatment of High Blood Cholesterol in Adults (Adult Treatment Panel III) final report. Circulation. 2002;106:3143–3421 [PubMed] [Google Scholar]
- 8. Frimel TN, Deivanayagam S, Bashir A, O'Connor R, Klein S. Assessment of intrahepatic triglyceride content using magnetic resonance spectroscopy. J Cardiometab Syndr. 2007;2:136–138 [DOI] [PubMed] [Google Scholar]
- 9. James WP, McNeill G, Ralph A. Metabolism and nutritional adaptation to altered intakes of energy substrates. Am J Clin Nutr. 1990;51:264–269 [DOI] [PubMed] [Google Scholar]
- 10. Mittendorfer B, Liem O, Patterson BW, Miles JM, Klein S. What does the measurement of whole-body fatty acid rate of appearance in plasma by using a fatty acid tracer really mean? Diabetes. 2003;52:1641–1648 [DOI] [PubMed] [Google Scholar]
- 11. Yoshino J, Conte C, Fontana L, et al. Resveratrol supplementation does not improve metabolic function in nonobese women with normal glucose tolerance. Cell Metab. 2012;16:658–664 [DOI] [PMC free article] [PubMed] [Google Scholar]
- 12. Patterson BW, Zhao G, Elias N, Hachey DL, Klein S. Validation of a new procedure to determine plasma fatty acid concentration and isotopic enrichment. J Lipid Res. 1999;40:2118–2124 [PubMed] [Google Scholar]
- 13. Magkos F, Patterson BW, Mittendorfer B. Reproducibility of stable isotope-labeled tracer measures of VLDL-triglyceride and VLDL-apolipoprotein B-100 kinetics. J Lipid Res. 2007;48:1204–1211 [DOI] [PubMed] [Google Scholar]
- 14. Magkos F, Fabbrini E, Korenblat K, Okunade AL, Patterson BW, Klein S. Reproducibility of glucose, fatty acid and VLDL kinetics and multi-organ insulin sensitivity in obese subjects with non-alcoholic fatty liver disease. Int J Obes (Lond). 2011;35:1233–1240 [DOI] [PMC free article] [PubMed] [Google Scholar]
- 15. Schenk S, Saberi M, Olefsky JM. Insulin sensitivity: modulation by nutrients and inflammation. J Clin Invest. 2008;118:2992–3002 [DOI] [PMC free article] [PubMed] [Google Scholar]
- 16. Gomez-Abellan P, Diez-Noguera A, Madrid JA, Lujan JA, Ordovas JM, Garaulet M. Glucocorticoids affect 24 h clock genes expression in human adipose tissue explant cultures. PLoS One. 2012;7:e50435. [DOI] [PMC free article] [PubMed] [Google Scholar]
- 17. Zambon AC, McDearmon EL, Salomonis N, et al. Time- and exercise-dependent gene regulation in human skeletal muscle. Genome Biol. 2003;4:R61. [DOI] [PMC free article] [PubMed] [Google Scholar]
- 18. Otway DT, Mantele S, Bretschneider S, et al. Rhythmic diurnal gene expression in human adipose tissue from individuals who are lean, overweight, and type 2 diabetic. Diabetes. 2011;60:1577–1581 [DOI] [PMC free article] [PubMed] [Google Scholar]
- 19. McCarthy JJ, Andrews JL, McDearmon EL, et al. Identification of the circadian transcriptome in adult mouse skeletal muscle. Physiol Genomics. 2007;31:86–95 [DOI] [PMC free article] [PubMed] [Google Scholar]
- 20. Dyar KA, Ciciliot S, Wright LE, et al. Muscle insulin sensitivity and glucose metabolism are controlled by the intrinsic muscle clock. Mol Metab. 2014;3:29–41 [DOI] [PMC free article] [PubMed] [Google Scholar]