

Abstract
Polycystic kidney disease (PKD) is a common genetic disorder leading to cyst formation in the kidneys and other organs that ultimately results in kidney failure and death. Currently, there is no therapy for slowing down or stopping the progression of PKD. In this study, we identified the disintegrin metalloenzyme 17 (ADAM17) as a key regulator of cell proliferation in kidney tissues of conditional knockout Ift88−/− mice and collecting duct epithelial cells from Ift88°rpk mice, animal models of autosomal recessive polycystic kidney disease (ARPKD). Using Western blotting, an enzyme activity assay, and a growth factor-shedding assay in the presence or absence of the specific ADAM17 inhibitor TMI-005, we show that increased expression and activation of ADAM17 in the cystic kidney and in collecting duct epithelial cells originating from the Ift88°rpk mice (designated as PKD cells) lead to constitutive shedding of several growth factors, including heparin-binding EGF-like growth factor (HB-EGF), amphiregulin, and transforming growth factor-α (TGF-α). Increased growth factor shedding induces activation of the EGFR/MAPK/ERK pathway and maintains higher cell proliferation rate in PKD cells compared with control cells. PKD cells also displayed increased lactate formation and extracellular acidification indicative of aerobic glycolysis (Warburg effect), which was blocked by ADAM17 inhibition. We propose that ADAM17 is a key promoter of cellular proliferation in PKD cells by activating the EGFR/ERK axis and a proproliferative glycolytic phenotype.
Keywords: ADAM17, glycolysis, ERK, cell proliferation, polycystic kidney disease (PKD)
polycystic kidney disease (PKD) is a common genetic disorder leading to kidney failure and death. Even though cysts develop in only ∼5% of the nephrons, the progressive cyst growth compresses surrounding normal kidney tissue, gradually causing chronic kidney disease and renal failure (11). Mutations in autosomal dominant cystoproteins PKD1 and PKD2 and in autosomal recessive fibrocystin are responsible for most human PKD. Autosomal dominant PKD (ADPKD) alone affects more than 12 million people worldwide (11). To date, several signaling pathways have been shown to be disregulated in PKD, including the mammalian target of rapamycin (mTOR) pathway, the vasopressin 2 receptor (V2R)/cAMP pathway, and the erythroblastic leukemia viral oncogene homolog (ErbB) family of transmembrane receptor tyrosine kinases (RTKs). Clinical trials that targeted some of these pathways showed little if any benefit (21, 23). Effective therapy for treating PKD has not yet been identified.
Recently, a potential new therapeutic “metabolic” target for PKD has been described. Similar to cancer cells, fibroblasts from Pkd1-deficient mice (ADPKD) generate ATP mainly through aerobic glycolysis in the cytosol rather than ATP production through oxidative phosphorylation in mitochondria (18). Although the glycolytic ATP yield per mole of glucose is lower compared with mitochondrial oxidation, the advantage of this “metabolic switch” in proliferating cells is that incomplete processing of glucose provides carbon backbones for the synthesis of lipids, proteins, and nucleic acids. Cells with this glycolytic phenotype are highly dependent on glucose, and cell proliferation decreases after treatment with glycolytic inhibitors, including 2-deoxyglucose (2DG). 2DG decrease glycolysis in kidneys of ADPKD mice and slows cyst growth, suggesting that aerobic glycolysis could be an important therapeutic target in PKD (18).
Disintegrin metalloenzyme 17 (ADAM17), initially identified as “the” tumor necrosis factor-α (TNF-α) converting enzyme (TACE), is the major sheddase of EGF-like growth factors, including transforming growth factor-α (TGF-α) and heparin-binding EGF-like growth factor (HB-EGF) that activates EGF receptor (EGFR)-dependent proliferative signaling pathways like the mitogen-activated protein kinase (MAPK) pathway. ADAM17 also processes several cell surface receptors, including some of the ErbB receptors (EGFR/ErbB1 and ErBB4) and the TNF-α receptor (TNFR) that regulate cell proliferation, inflammatory signaling, and the MAPK/ERK pathway. A dual ADAM17/ADAM10 inhibitor slows cyst growth in the BALB/c polycystic kidney (bpk) mice model of ARPKD (4). In a heterozygous Pkd2+/− model, the TNF-α inhibitor etanercept attenuates the growth of cysts. Importantly, treatment with etanercept inhibited localization of Pkd2 to the primary cilium and other regions of the plasma membrane of Madin-Darby canine kidney (MDCK) collecting duct cells (14). Furthermore, ERK, an important effector of the ADAM17/EGFR/MAPK cascade (1, 2), was implicated as a causative factor in the enhanced glycolytic phenotype observed in the Pkd1−/− mouse, another model of ADPKD (18). These interesting and important findings confirm the pathological role of ADAM17 in PKD. However, the exact mechanism of ADAM17 actions in PKD remains to be fully elucidated.
Previously, we found that ADAM17 activates signaling mechanisms that promote proliferation of mesangial and endothelial cells (7, 9). Here, we have extend these findings to a model of autosomal recessive polycystic kidney disease (ARPKD) and demonstrate that PKD cells have higher ADAM17 expression and activity compared with control cells, which leads to sustained ERK activation, enhanced aerobic glycolysis, and increased cell proliferation. Furthermore, our data suggest that increased ADAM17 activity in PKD promotes a glycolytic, proproliferative phenotype through the ADAM17/EGFR/MAPK pathway.
MATERIALS AND METHODS
Animals
Tamoxifen-inducible Cre+ and Cre− Ift88 floxed allele mice have been previously characterized (3). Mice were maintained in accordance with approved protocols of the Institutional Animal Care and Use Committees of the Medical University of South Carolina in compliance with National Institutes of Health guidelines. Tamoxifen (Sigma, St. Louis, MO) dissolved in corn oil (Sigma) was administered intraperitoneally (0.5 ml of 10 mg/ml) three times per week in both male and female Cre+ and Cre− mice at ∼8 wk of age. Animals were genotyped, and their kidney tissues were harvested 3 mo after tamoxifen treatment.
Cell Culture
We used SV40 immortalized temperature-sensitive collecting duct epithelial cells originating from the Oak Ridge Polycystic Kidney (orpk) mouse model that is a hypomorph for the Ift88/Tg737 gene. These cells have nonfunctional cilia and are referred to as “PKD cells.” The Ift88 gene was reintroduced into the cell line, and these cells were used as our control cells, referred to as “control.” We obtained these cells from Dr. Bradley Yoder (University of Alabama). Both cell lines are characterized previously (25). Cell culture reagents were obtained from Sigma-Aldrich, (St. Louis, MO) unless stated otherwise. Cells were cultured in DMEM/F12 (Life Technologies, Grand Island, NY) containing 5% FBS (Atlanta Biologicals, Atlanta, GA), 100 U/ml penicillin, 100 mg/ml streptomycin, 10 nM triiodothyronine, 50 nM dexamethasone, 1 mg/ml insulin, 0.55 mg/ml human transferrin, 0.5 μg/ml sodium selenite, 12 U/ml interferon-γ, and 500 μl/l geneticin (G418). Cells were maintained at 33°C in humidified air-5% CO2 to allow them to proliferate. Subsequently, the cells were replated and cultured in the same medium without interferon-γ at 38°C until confluent (4–5 days). Confluent cell cultures were used in experiments.
Immunofluorescence Staining
Paraffin-embedded kidney sections (5 μm) of Ift88 Cre+ (PKD) and Cre− (control) animals were processed using standard immunofluorescence protocols. PKD and control cells were seeded into 35-mm lysine-coated glass bottom culture dishes (MatTek, Ashland, MA) and fixed with freshly prepared 2% paraformaldehyde in PBS containing 0.2% Triton X-100 for 15 min at room temperature. Nonspecific binding sites were blocked with 1% bovine serum albumin in PBS for 1 h. Cells were incubated with 1:100 dilution (2 μg/ml) of ADAM17-specific antibody (sc-6416, Santa Cruz Biotechnology, Santa Cruz, CA). Negative controls were incubated with buffer. Subsequent incubations with 1:500 dilutions of Alexa Fluor-conjugated appropriate secondary antibodies (Invitrogen, Carlsbad, CA) were performed in blocking solution. Nuclei were counterstained with I μg/ml Hoechst 33342 dye. Confocal microscopy was performed using a Leica SP5 laser-scanning microscope (Wetzlar, Germany), and images were analyzed in Adobe Photoshop (San Jose, CA).
Western Blot Analysis
Protein samples were boiled for 3 min in reducing SDS-sample buffer and separated by 4–12% acrylamide gels. Resolved proteins were transferred to 0.45-μm polyvinylidene difluoride membranes (EMD Millipore, Billerica, MA), blocked with 4% nonfat dry milk or 3% bovine serum albumin for 1 h, and incubated overnight at 4°C with the following antibodies: 1:1,000 ERK and phospho-ERK (Cell Signaling Technology, Danvers, MA), 1:3,000 β-actin (Santa Cruz Biotechnology), or 1:2,000 ADAM17 (R&D Systems, Minneapolis, MN) antibodies. Membranes were washed three times in PBS containing 0.1% Tween 20 and incubated for 1 h at room temperature in appropriate dilutions of secondary antibodies. Immunoreactive protein bands were visualized using enhanced chemiluminescence and recorded by Kodak BioMax XR film or an Odyssey CLx Imager (LI-COR, Lincoln, NE). Images were analyzed using Image J Software (National Institute of Health, Bethesda, MD).
Fluorescence Enzyme Activity Assay
Growth medium was removed from cells grown in 96-well plates and replaced with HBSS without or with 1 μm PMA (Sigma) and 6 μM fluorogenic ADAM17 substrate MCA-PLAQAV (Dpa; R&D Systems). Change in fluorescence intensity of the dye over 1 h (time-resolved fluorescence) was measured using a Molecular Devices SpectraMax M5 instrument and SoftMaxPro software (Sunnyvale, CA). Data are expresses as change in relative fluorescence units/s.
Growth Factor-Shedding Assay
Cells were seeded into 12-well tissue culture plates and cotransfected with alkaline phosphatase-tagged HB-EGF, TGF-α, or an amphiregulin-expressing construct and scrambled siRNA or ADAM17 small interfering (si) RNA using Dharmafect Duo reagent (Dharmacon, Lafayette, CO), according to the manufacturer's instructions. As negative controls, we used a green fluorescent protein (GFP)-expressing vector. Two days after transfection, the medium was changed and cells were cultured for 2 h in fresh medium. Growth factor release was quantified by measuring the alkaline phosphatase activity of the medium using a sensitive alkaline phosphatase substrate (Attophos, Roche, Indianapolis, IN) and the SpectraMax M5 fluorescence plate reader (Molecular Devices).
Cell Proliferation Assay
Control and PKD cells were seeded in 96-well plates and cultured for 3 days in the presence or absence of an ADAM17 inhibitor (TMI-005, 1 μM, Pfizer, New York, NY). DNA content of the wells was measured using a FluoReporter blue cell proliferation kit according to the manufacturer's instructions (Molecular Probes, Life Technologies).
Extracellular Acidification Rate
Confluent control and PKD cells were seeded in 24-well Seahorse assay plates, and extracellular acidification rate (ECAR) was determined using a Seahorse XF24 Flux Analyzer (Seahorse Biosciences, North Billerica, MA) before and after addition of 2DG (50 mM). Data were normalized to cell number and analyzed using Microsoft Excel and GraphPad Prism software (La Jolla, CA).
Lactate Assay
Confluent control and PKD cells were cultured in the presence or absence of the specific ADAM17 inhibitor (TMI-005, 1 μM, Pfizer) overnight. Lactate concentration in the culture medium was measured using a lactate assay kit (ETON Biosciences, San Diego, CA) per the manufacturer's instructions using a SpectraMax M5 fluorescence plate reader (Molecular Devices). Data were normalized to cell number.
Statistical Analysis
Student's t-test and analysis of variance using GraphPad statistics software were performed to determine statistical significance. P values <0.05 were regarded as statistically significant.
RESULTS
ADAM17 Expression and Activity Are Increased in a Model of ARPKD
To determine whether ADAM17 is upregulated in kidney tissue of PKD mice and PKD cells, we used immunofluorescence staining of kidney sections of tamoxifen-inducible Cre+ (PKD) and Cre− (control) Ift88 floxed allele mice. ADAM17 staining was intense at the apical surface of the proliferating epithelium that lined cystic structures in PKD kidneys (Fig. 1A). In control kidneys, ADAM17 staining was distributed evenly inside the cells.
Fig. 1.

Disintegrin metalloenzyme 17 (ADAM17) is overexpressed in the polycystic disease (PKD) kidney. A: immunofluorescence images compare ADAM17 expression and localization (green) in control Ift88 and diseased PKD kidneys. Arrows point to apical surface of epithelial cells. There is overall increased ADAM17 expression in cystic epithelium (lower magnification, top) that is localized to the apical surface of the cells (higher magnification, bottom). Nuclei are counterstained with Hoechst staining (blue). T, tubuli; G, glomeruli. B: Western blot analysis of ADAM17 expression level shows 2-fold increase in PKD kidney lysate compared with control kidney lysates. One representative experiment is shown. Values of densitometry analysis are means ± SE of fold-increase compared with control; n = 3 experiments. **P < 0.01 compared with control cells.
Western blot analysis of kidney lysates from the same mice revealed twofold increases in ADAM17 expression in the PKD mouse model compared with controls (Fig. 1B). Immunofluorescence staining was also performed in immortalized collecting duct epithelial cells originating from the hypomorph Ift88°rpk mice (PKD cells) and in control cells where the Ift88 gene was reintroduced (control) (20). In PKD cells, immunofluorescence staining for ADAM17 was nearly twice that for control cells (Fig. 2A). Western blot analysis of the two cell lysates also demonstrated that PKD cells expressed substantially more ADAM17 protein than control cells (Fig. 2B).
Fig. 2.

ADAM17 is overexpressed in PKD cells. A: immunofluorescence images compare ADAM17 expression in control and PKD cells. Analysis of fluorescence intensity per cell (n = 30, *P < 0.05) shows that there is 2.1-fold higher ADAM17 expression in PKD cells compared with control. B: Western blot analysis of ADAM17 expression shows a 2-fold increase in PKD cell lysate compared with control cell lysates. One representative experiment is shown. Values of densitometry analysis are means ± SE of 3 experiments. **P < 0.01 compared with control.
To assess ADAM17 activity, we used two methods. First, we measured ADAM17 activity using a fluorogenic TNF-α analog substrate, as described previously (7). By this method, PKD cells had twofold greater ADAM17 activity than control cells (Fig. 3A). Second, we assessed shedding of growth factors after transfecting alkaline phosphatase-tagged growth factor constructs (8). The advantage of this method is detection of low concentrations of growth factors in small volumes of culture media. Compared with control cells, PKD cells shed 2.5-fold more HB-EGF, 1.5-fold more TGF-α, and 2.8-fold more amphiregulin (Fig. 3C). To prove that the elevated growth factor shedding in PKD is due to ADAM17, we knocked down ADAM17 expression by silencing RNA (Fig. 3B). ADAM17 silencing significantly inhibited shedding of all growth factors both in control and PKD cells: HB-EGF shedding decreased by 68 and 84%, TGF-α shedding decreased by 79 and 77%, and amphiregulin shedding decreased by 80 and 83%, respectively. The remaining shedding activity may be due to the incomplete (<100%) silencing or to the activity of other sheddases, including ADAM10 (Fig. 3C).
Fig. 3.
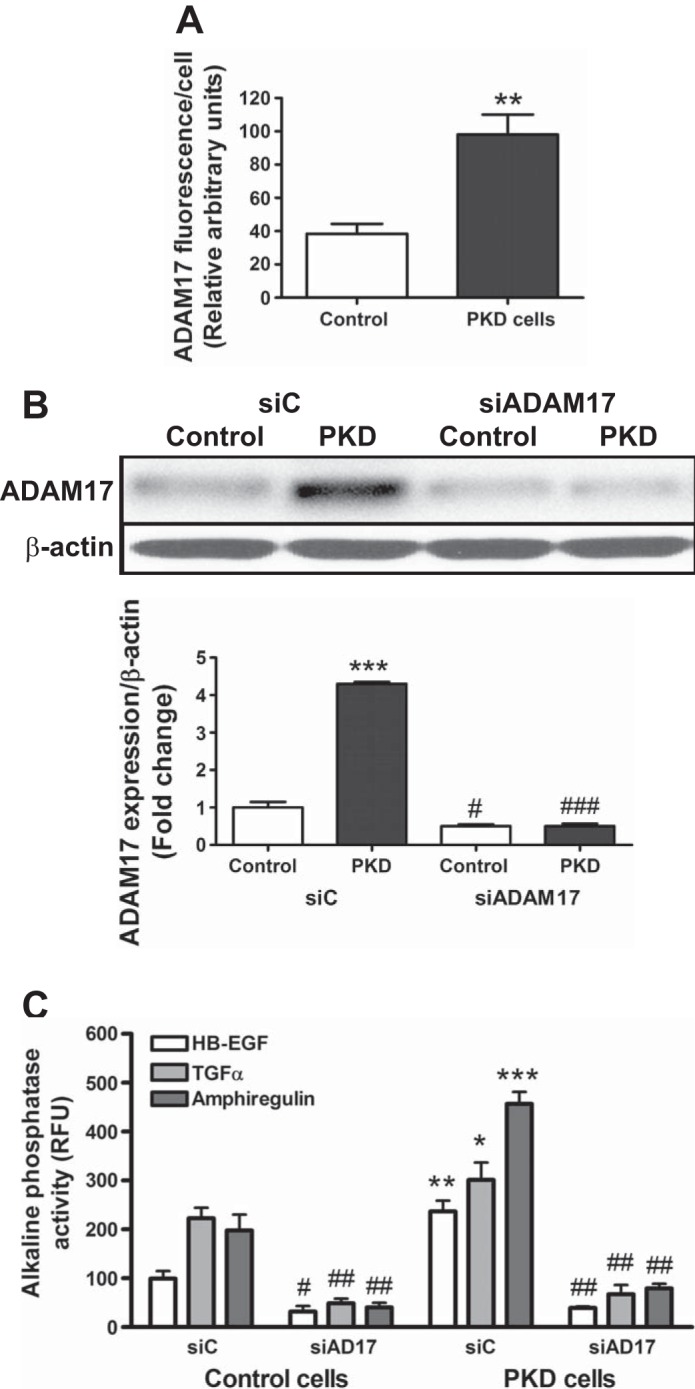
ADAM17 activity and growth factor shedding are upregulated in PKD cells. A: ADAM17 activity of control and PKD cells is estimated by measuring time-resolve fluorescence cleavage of the fluorogenic ADAM17 substrate MCA-PLAQAV(Dpa). PKD cells show 1.5-fold higher ADAM17 activity than control cells. Values are means ± SE of 4 experiments, 8 samples/condition in each. *P < 0.05. B: Western blot shows efficiency of ADAM17 gene silencing. One representative experiment is shown. Values are means ± SE in the densitometry analysis of 3 experiments shown beneath blot. ***P < 0.01 compared with control-silencing RNA (siC). #P < 0.05 compared with siC. ###P < 0.001 compared with PKD siC. C: alkaline phosphatase-tagged growth factor constructs (HB-EGF, TGF-α, and amphiregulin, respectively) were cotransfected with scrambled/siC or ADAM17-silencing RNA (siADAM17) into control and PKD cells. Growth factor shedding of the cells was measured by means of alkaline phosphatase substrate cleavage of the cell medium. Values are means ± SE of 3 experiments. Statistical analysis compared shedding of a particular growth factor by PKD cells to shedding of the same growth factor by control cells. *P < 0.05, **P < 0.01, ***P < 0.001 compared with corresponding growth factors in siC. #P < 0.05, ##P < 0.01, ###P < 0.001 compared with siC in the same cell line.
Increased ADAM17 Activity Promotes Constitutive Activation of the Proliferative ERK Pathway in ARPKD
The MAPK/ERK pathway is an important effector of ADAM17 that promotes cell proliferation (7). Therefore, we studied activation of ERK both in PKD animals and in cultured collecting duct cells. Compared with kidneys of Cre− control mice, ERK phosphorylation was increased sixfold in Ift88-deficient kidneys of PKD mice, confirming upregulation of the ERK proliferative pathway (Fig. 4A). Furthermore, constitutive ERK phosphorylation was higher in PKD cells than control cells (Fig. 4B). Moreover, EGF did not further stimulate ERK phosphorylation in in PKD cells, whereas in control cells, EGF increased ERK phosphorylation threefold (Fig. 4C). These data show that the MAPK/ERK pathway is constitutively active in PKD.
Fig. 4.
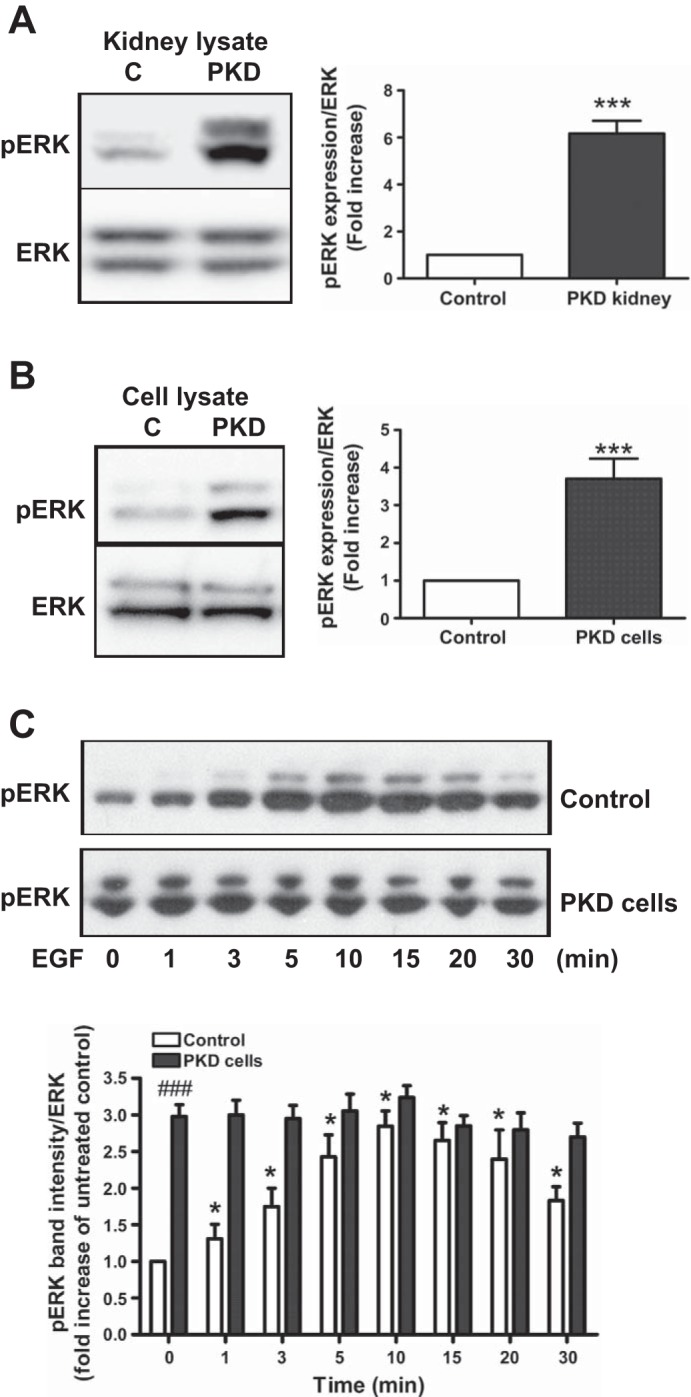
The proproliferative ERK pathway is activated in PKD. A: Western blot analysis of control and PKD kidneys lysate shows activation (phosphorylation) of ERK. Densitometric analysis of the phosphorylated 44/42-kDa bands of ERK (pERK) shows a 6-fold higher ERK activity in PKD kidneys compared with control kidneys. Values are means ± SE fold increase compared with control; n = 3 experiments. Total ERK expression was used as a loading control. ***P < 0.001 compared with control kidneys. B: Western blot analysis of pERK level in control and PKD cells shows a 4-fold higher 42/44-kDa ERK activation in PKD cells. Values are means ± SE fold increase compared with control; n = 3 experiments. Total ERK expression was used as a loading control. ***P < 0.001 compared with control kidneys. C: epidermal growth factor (1 ng/ml EGF) treatment induces time-dependent, maximum 3-fold activation of ERK in control cells but not further activation in PKD cells. Densitometric analysis shows time-dependent cumulative changes in the intensity of phosphorylated 44/42-kDa bands of ERK (pERK) corrected to total ERK expression. Values are means ± SE fold increase compared with untreated control cells; n = 3 experiments. *P < 0.05, ###P < 0.001 compared with untreated control cells.
To determine whether ERK activation in PKD cells is due to ADAM17 activity, cells were treated with TMI-005, an inhibitor of ADAM17. ADAM17 inhibition significantly inhibited ERK phosphorylation in PKD cells. Similar data were obtained by silencing ADAM17 expression with siRNA (Fig. 5A).
Fig. 5.

ADAM17 increases ERK activation in PKD. A: Western blot and densitometric analysis of p44/42 bands of ERK (pERK) show that ADAM17 inhibitor treatment and ADAM17 silencing decreased ERK activation by 75% in PKD cells. Values are means ± SE fold increase compared with control; n = 3 experiments. **P < 0.01 compared with vehicle control or control silenced PKD cells. C, vehicle control; A17i, ADAM17 inhibitor. B: phorbol ester (PMA; 1 μM) upregulates ADAM17 activity in control cells. ADAM17 activity in control and PKD cells is estimated as described in Fig. 1. PKD cells shows 2-fold higher ADAM17 activity after PMA treatment. Values are means ± SE ADAM17 activity expressed as change in relative fluorescence units (ΔRFU)/s control cells; n = 3 experiments; 8 samples/condition in each. ##P < 0.01 vs. vehicle control-treated control. *P < 0.05 vs. vehicle control-treated cells. C: PMA upregulates pERK in control cells. Control and PKD cells were treated with PMA (1 uM) for 30 min, and pERK activation was measured by Western blotting. Densitometric analysis shows time-dependent cumulative changes in the intensity of phosphorylated 44/42-kDa bands of ERK (pERK) corrected to β-actin expression. Values are means ± SE fold increase compared with control; n = 3 experiments. *P < 0.05, **P < 0.01, ***P < 0.001 compared with vehicle control cells.
To test the effects of stimulating ADAM17 activity on ERK activation, cells were treated with the phorbol ester PMA, a widely used positive control for ADAM17 activation. Using a fluorogenic ADAM17 substrate, we assessed how effectively PMA stimulates ADAM17 activity in our cells. PMA significantly increased ADAM17 activity in control cells but had no significant effect on the already high ADAM17 activity in PKD cells (Fig. 5B). PMA also increased ERK phosphorylation in control cells but did not further stimulate ERK phosphorylation in PKD cells (Fig. 5C). These data suggest that PMA activates ERK phosphorylation by stimulating ADAM17 activity and that constitutive ERK activation in PKD is due to increased ADAM17 activity.
Increased ADAM17 Activity Promotes Cell Proliferation in PKD Cells
Proliferation assays showed that PKD collecting duct cells grew 1.5-fold faster than control cells (Fig. 6A). ADAM17 inhibition attenuated proliferation of PKD cells but had no effect on the proliferation rate of control cells. These data suggest that higher proliferation in PKD cells is due to increased ADAM17 activity.
Fig. 6.

ADAM17 activity regulates cell proliferation through increased glycolysis. A: ADAM17 inhibitor (TMI-005, 1 μM) decreases cell proliferation in PKD cells to the level of control cells. B: the higher glycolytic flux measured by changes in the extracellular acidification rate (ECAR) in PKD cells, which decreases after 2-deoxyglucose (2DG; 50 mM). C: lactate concentration of control and PKD cells media was measured using a commercially available lactate kit. ADAM17 inhibitor t (TMI-005, 1 μM, 24 h) significantly attenuates lactate production of PKD cells but not in control cells. Values are means ± SE; n = 3 experiments. #P < 0.05, ##P < 0.01 vs. vehicle-treated control. **P < 0.01, ***P < 0.001 vs. control. ADAM17i, ADAM17 inhibitor.
Enhanced Glycolysis in PKD Cells is ADAM17 Activity Dependent
Glycolytic flux is increased in PKD cells.
Enhanced glycolysis is a common feature of the Warburg phenotype in highly proliferative cells. Accordingly, we measured rates of glycolysis in PKD cells compared with less proliferative control cells. As assessed by ECAR in a Seahorse XF24 Analyzer, PKD cells had a twofold higher rate of glycolysis than control cells. Data were normalized to cell number. Addition of 50 mM 2DG to inhibit glycolysis attenuated ECAR in PKD cells but had little effect on control cells (Fig. 6B), indicating that increased ECAR in PKD cells was due to increased glycolysis. Furthermore, glycolysis was not a significant energy source for control cells since 2DG did not decrease ECAR in these cells.
Higher lactate production in PKD cells is attenuated by ADAM17 inhibition.
To confirm increased glycolysis in PKD cells, we measured lactate production by PKD and control cells. Data are normalized to cell number. PKD cells released threefold more lactate than control cells. Treatment with TMI-005 to inhibit ADAM17 decreased lactate production of PKD cells but not in control cells (Fig. 6C), indicating that ADAM17 not only is involved in cell proliferation but also regulates glycolysis.
DISCUSSION
In PKD, important channels, carriers, and receptors are mislocalized in the cystic epithelia, including aquaporin-2 (19) and the EGFR (6, 17). Regulation and activity of these mislocalized proteins is altered in PKD and can contribute to dysregulation of several signaling pathways like the cAMP, mTOR, and EGFR/MAPK pathways. EGFR, normally localized to the basolateral surface of the tubular epithelium, is found in abundance on the apical surface in cystic epithelia. Our recent work shows that the activity of these mislocalized receptors is regulated differently from those present on the basolateral surface of control and PKD cells. Apical addition of EGF in PKD cells but not in control cells activated a 23-pS calcium channel, a multimere of polycystin 2, and TRPV4, which lead to increased cell proliferation (26).
EGFR is activated by a group of EGF-like growth factors, including HB-EGF, TGF-α, amphiregulin, epiregulin, and neuregulins, as well as EGF. The relative contribution of these growth factors to activation of EGFR may be tissue, species, and disease specific. Accordingly, we previously demonstrated that epiregulin activates EGFR in mouse podocytes while in rat and human mesangial cells HB-EGF serves a similar function (5, 7). In PKD, TGF-α knockout did not change the rate of cystic growth (16). In bpk mice, increased expression and apical mislocalization of HB-EGF and amphiregulin occur, although the participation of these growth factors in cystic growth is unclear (15). Although EGF was shown to be one of the most mitogenic growth factors to the cystic epithelium (15), there is no consensus regarding which growth factors are the most important in EGFR activation in PKD.
Our data indicate that in cystic epithelia of PKD mice, ADAM17 becomes relocalized to the cell surface compared with cytosolic expression in non-PKD mice (Fig. 1A). Since activated ADAM17 localizes to the cell surface (8), this finding suggests that in PKD, ADAM17 becomes activated to induce growth factor shedding that can result in sustained upregulation of apical EGFR activity and maintenance of the proliferative phenotype of cystic epithelium. This hypothesis was supported by our in vitro data showing that PKD collecting duct cells had higher ADAM17 expression and activity with a resultant increase in growth factor shedding compared with control cells (Figs. 2 and 3). This was an important observation since increased ADAM17 expression does not necessarily correlate with increased ADAM17 activity or increased substrate shedding (24).
Our data also indicate that ADAM17 maintains EGFR activation through increased shedding of several different growth factors in the same cell type, including HB-EGF, amphiregulin, and to lesser extent TGF-α in our ARPKD model (Fig. 3). This redundancy in shedded growth factor availability for EGFR activation may explain why knocking down an individual growth factor may not result in decreased cyst growth in PKD (16).
Activation of the EGFR/ErbB receptors can turn on several downstream signaling cascades, including the MAPK/ERK, p38, and JNK pathways, which can contribute to cell proliferation and to apoptosis (10). In PKD cells, we observed sustained activation of the proproliferative ERK pathway compared with control cells (Figs. 4 and 5). Since several extracellular stimuli acting through many receptors can activate the MAPK/ERK pathway, it was important to establish that increased ADAM17 activity underlies increased ERK activation/phosphorylation. A role for ADAM17 in ERK activation was supported by the observation that ADAM17 inhibition decreased ERK activation in PKD cells. In addition, ADAM17 inhibition decreased proliferation of PKD cells to the control level. Therefore, our data indicate that ADAM17 is a key enzyme for the sustained activation of proproliferative ERK in PKD through constitutive shedding of multiple growth factors in collecting duct epithelial cells.
Cell proliferation is sustained not only by upregulation of proproliferative signaling pathways but also by important changes in cellular bioenergetics. In nonproliferating cells, glucose catabolism generates pyruvate that becomes oxidized in mitochondria to CO2 and H2O through oxidative phosphorylation. By contrast, highly proliferative cells, including cancer cells, show enhanced glycolysis and generate net lactate even in the presence of physiological levels of oxygen. Although the ATP yield is much lower for glycolysis (2 mol ATP/mol glucose) compared with the oxidation of glucose in mitochondria (∼36 mol ATP/mol glucose), it is widely accepted that enhanced glycolysis in the Warburg phenotype confers an advantage for cell proliferation.
Enhanced aerobic glycolysis in proliferating cells is a characteristic of the Warburg effect. The Warburg phenotype is considered beneficial for cell proliferation because the incomplete breakdown of glucose to lactate produces carbon backbones required for protein, nucleotides and lipid synthesis for new cells. Inhibition of glycolysis in proliferating cells leads to apoptosis and cell death. Although the nonmetabolizable glucose analog 2DG has been used to slow down cell proliferation in aggressive forms of glioma (13), 2DG alone is not an effective overall therapy for cancer. In Pkd1−/− ADPKD animals, 2DG can attenuate cyst growth, suggesting a potential beneficial effect of targeting glycolysis in PKD (18). In our experiments, ARPKD collecting duct cells had higher glycolytic metabolism then control cells as determined by higher ECAR, higher lactate production, and greater sensitivity to glycolysis inhibition by 2DG (Fig. 6).
Our findings of increased aerobic glycolysis in this model of the recessive form of PKD are in accordance with findings described for the autosomal dominant form of PKD, suggesting that increased aerobic glycolysis is an essential bioenergetic feature for both recessive and dominant forms of PKD. Furthermore, we observed that ADAM17 inhibition decreased lactate production in PKD cells, which indicates that ADAM17 enhances glycolysis in PKD cells, at least in part. Similarly, ADAM17 appeared to play an important role in upregulating proproliferative ERK pathways through increased growth factor shedding in PKD cells. These findings suggest a dual role of ADAM17 in cell proliferation by promotion of both proproliferative signaling pathways and the proproliferative glycolytic phenotype (summarized in Fig. 7).
Fig. 7.
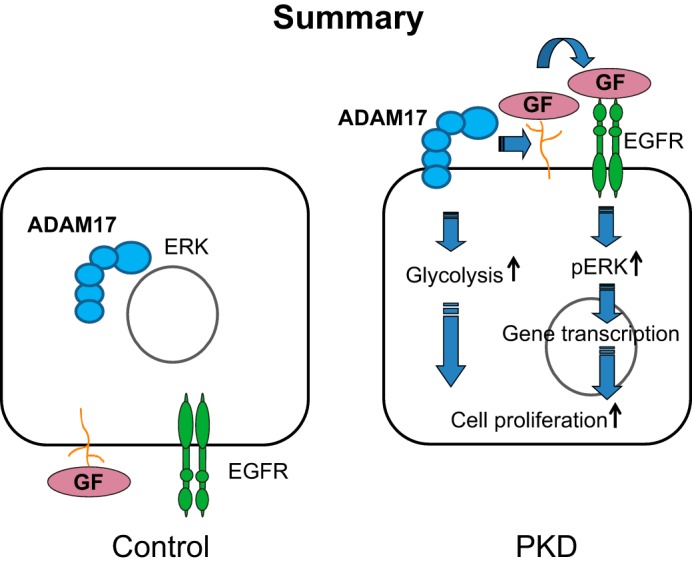
ADAM17 induces cell proliferation through growth factor shedding, which promotes epidermal growth factor receptor (EGFR)-induced ERK activation, and via promoting increased cellular glycolysis in PKD. GF, growth factors.
Targeting glycolysis alone in cancer is not sufficient to attenuate cell growth, since several cellular processes become dysregulated in cancerous cells. Because PKD cells express a similar metabolic phenotype to cancer cells, we cannot expect total success using 2DG as a monotherapy in this disease. However, there is some indication that glycolysis may promote EGFR activation (22) and that inhibition of glycolysis sensitizes cancer cells to EGFR inhibitor therapy (12). Since we found upregulation of the ADAM17/EGFR/ERK axis and also ADAM17-dependent increased glycolysis in PKD, we propose that targeting ADAM17 in combination with glycolysis inhibition may represent a novel approach to inhibit cell proliferation and cyst growth for both autosomal and recessive forms of the disease.
In conclusion, ADAM17 is an important regulator of cell proliferation in PKD through two major ADAM17-dependent effects: MAPK/ERK activation and enhanced cellular glycolysis, which may perpetuate cell proliferation in PKD. Further investigation will be needed to analyze ADAM17-related metabolic changes regarding mitochondrial bioenergetics and to identify metabolic enzymes upregulated by increased ADAM17 activity.
GRANTS
This work was supported by grants from the National Institutes of Health (NIH NIDDK P30 DK074038 and R01 DK32032), a Merit Grant from the Veterans Administration (Ralph H. Johnson VA Medical Center), and grants from the Dialysis Clinic, Inc.
DISCLOSURES
No conflicts of interest, financial or otherwise, are declared by the authors.
AUTHOR CONTRIBUTIONS
Author contributions: M.B.G., E.N.M., J.J.L., and P.D.B. provided conception and design of research; M.B.G., E.N.M., Y.D., and M.Y.A. performed experiments; M.B.G. and E.N.M. analyzed data; M.B.G., E.N.M., J.J.L., and P.D.B. interpreted results of experiments; M.B.G. prepared figures; M.B.G. drafted manuscript; M.B.G., E.N.M., S.H., H.E.A., J.J.L., and P.D.B. edited and revised manuscript; M.B.G., E.N.M., Y.D., M.Y.A., S.H., H.E.A., J.J.L., and P.D.B. approved final version of manuscript.
REFERENCES
- 1.Britschgi A, Bill A, Brinkhaus H, Rothwell C, Clay I, Duss S, Rebhan M, Raman P, Guy CT, Wetzel K, George E, Popa MO, Lilley S, Choudhury H, Gosling M, Wang L, Fitzgerald S, Borawski J, Baffoe J, Labow M, Gaither LA, Bentires-Alj M. Calcium-activated chloride channel ANO1 promotes breast cancer progression by activating EGFR and CAMK signaling. Proc Natl Acad Sci USA 110: E1026–E1034, 2013 [DOI] [PMC free article] [PubMed] [Google Scholar]
- 2.Chiluiza D, Krishna S, Schumacher VA, Schlondorff J. Gain-of-function mutations in transient receptor potential C6 (TRPC6) activate extracellular signal-regulated kinases 1/2 (ERK1/2). J Biol Chem 288: 18407–18420, 2013 [DOI] [PMC free article] [PubMed] [Google Scholar]
- 3.Davenport JR, Watts AJ, Roper VC, Croyle MJ, van Groen T, Wyss JM, Nagy TR, Kesterson RA, Yoder BK. Disruption of intraflagellar transport in adult mice leads to obesity and slow-onset cystic kidney disease. Curr Biol 17: 1586–1594, 2007 [DOI] [PMC free article] [PubMed] [Google Scholar]
- 4.Dell KM, Nemo R, Sweeney WE, Jr, Levin JI, Frost P, Avner ED. A novel inhibitor of tumor necrosis factor-alpha converting enzyme ameliorates polycystic kidney disease. Kidney Int 60: 1240–1248, 2001 [DOI] [PubMed] [Google Scholar]
- 5.Dey M, Baldys A, Sumter DB, Gooz P, Luttrell LM, Raymond JR, Gooz M. Bradykinin decreases podocyte permeability through ADAM17-dependent epidermal growth factor receptor activation and zonula occludens-1 rearrangement. J Pharmacol Exp Ther 334: 775–783, 2010 [DOI] [PMC free article] [PubMed] [Google Scholar]
- 6.Du J, Wilson PD. Abnormal polarization of EGF receptors and autocrine stimulation of cyst epithelial growth in human ADPKD. Am J Physiol Cell Physiol 269: C487–C495, 1995 [DOI] [PubMed] [Google Scholar]
- 7.Gooz M, Gooz P, Luttrell LM, Raymond JR. 5-HT2A receptor induces ERK phosphorylation and proliferation through ADAM-17 tumor necrosis factor-alpha-converting enzyme (TACE) activation and heparin-bound epidermal growth factor-like growth factor (HB-EGF) shedding in mesangial cells. J Biol Chem 281: 21004–21012, 2006 [DOI] [PubMed] [Google Scholar]
- 8.Gooz P, Dang Y, Higashiyama S, Twal WO, Haycraft CJ, Gooz M. A disintegrin and metalloenzyme (ADAM) 17 activation is regulated by alpha5beta1 integrin in kidney mesangial cells. PLoS One 7: e33350, 2012 [DOI] [PMC free article] [PubMed] [Google Scholar]
- 9.Gooz P, Gooz M, Baldys A, Hoffman S. ADAM-17 regulates endothelial cell morphology, proliferation, and in vitro angiogenesis. Biochem Biophys Res Commun 380: 33–38, 2009 [DOI] [PMC free article] [PubMed] [Google Scholar]
- 10.Han W, Lo HW. Landscape of EGFR signaling network in human cancers: biology and therapeutic response in relation to receptor subcellular locations. Cancer Lett 318: 124–134, 2012 [DOI] [PMC free article] [PubMed] [Google Scholar]
- 11.Harris PC, Torres VE. Polycystic kidney disease. Annu Rev Med 60: 321–337, 2009 [DOI] [PMC free article] [PubMed] [Google Scholar]
- 12.Kim SM, Yun MR, Hong YK, Solca F, Kim JH, Kim HJ, Cho BC. Glycolysis inhibition sensitizes non-small cell lung cancer with T790M mutation to irreversible EGFR inhibitors via translational suppression of Mcl-1 by AMPK activation. Mol Cancer Ther 12: 2145–2156, 2013 [DOI] [PubMed] [Google Scholar]
- 13.Levesley J, Steele L, Taylor C, Sinha P, Lawler SE. ABT-263 enhances sensitivity to metformin and 2-deoxyglucose in pediatric glioma by promoting apoptotic cell death. PLoS One 8: e64051, 2013 [DOI] [PMC free article] [PubMed] [Google Scholar]
- 14.Li X, Magenheimer BS, Xia S, Johnson T, Wallace DP, Calvet JP, Li R. A tumor necrosis factor-alpha-mediated pathway promoting autosomal dominant polycystic kidney disease. Nat Med 14: 863–868, 2008 [DOI] [PMC free article] [PubMed] [Google Scholar]
- 15.MacRae Dell K, Nemo R, Sweeney WE, Jr, Avner ED. EGF-related growth factors in the pathogenesis of murine ARPKD. Kidney Int 65: 2018–2029, 2004 [DOI] [PubMed] [Google Scholar]
- 16.Nemo R, Murcia N, Dell KM. Transforming growth factor alpha (TGF-alpha) and other targets of tumor necrosis factor-alpha converting enzyme (TACE) in murine polycystic kidney disease. Pediatr Res 57: 732–737, 2005 [DOI] [PMC free article] [PubMed] [Google Scholar]
- 17.Orellana SA, Sweeney WE, Neff CD, Avner ED. Epidermal growth factor receptor expression is abnormal in murine polycystic kidney. Kidney Int 47: 490–499, 1995 [DOI] [PubMed] [Google Scholar]
- 18.Rowe I, Chiaravalli M, Mannella V, Ulisse V, Quilici G, Pema M, Song XW, Xu H, Mari S, Qian F, Pei Y, Musco G, Boletta A. Defective glucose metabolism in polycystic kidney disease identifies a new therapeutic strategy. Nat Med 19: 488–493, 2013 [DOI] [PMC free article] [PubMed] [Google Scholar]
- 19.Saigusa T, Reichert R, Guare J, Siroky BJ, Gooz M, Steele S, Fenton RA, Bell PD, Kolb RJ. Collecting duct cells that lack normal cilia have mislocalized vasopressin-2 receptors. Am J Physiol Renal Physiol 302: F801–F808, 2012 [DOI] [PMC free article] [PubMed] [Google Scholar]
- 20.Taulman PD, Haycraft CJ, Balkovetz DF, Yoder BK. Polaris, a protein involved in left-right axis patterning, localizes to basal bodies and cilia. Mol Biol Cell 12: 589–599, 2001 [DOI] [PMC free article] [PubMed] [Google Scholar]
- 21.Torres VE, Chapman AB, Devuyst O, Gansevoort RT, Grantham JJ, Higashihara E, Perrone RD, Krasa HB, Ouyang J, Czerwiec FS. Tolvaptan in patients with autosomal dominant polycystic kidney disease. N Engl J Med 367: 2407–2418, 2012 [DOI] [PMC free article] [PubMed] [Google Scholar]
- 22.Velpula KK, Bhasin A, Asuthkar S, Tsung AJ. Combined targeting of PDK1 and EGFR triggers regression of glioblastoma by reversing the Warburg effect. Cancer Res 73: 7277–7289, 2013 [DOI] [PubMed] [Google Scholar]
- 23.Walz G, Budde K, Mannaa M, Nurnberger J, Wanner C, Sommerer C, Kunzendorf U, Banas B, Horl WH, Obermuller N, Arns W, Pavenstadt H, Gaedeke J, Buchert M, May C, Gschaidmeier H, Kramer S, Eckardt KU. Everolimus in patients with autosomal dominant polycystic kidney disease. N Engl J Med 363: 830–840, 2010 [DOI] [PubMed] [Google Scholar]
- 24.Yoda M, Kimura T, Tohmonda T, Morioka H, Matsumoto M, Okada Y, Toyama Y, Horiuchi K. Systemic overexpression of TNFalpha-converting enzyme does not lead to enhanced shedding activity in vivo. PLoS One 8: e54412, 2013 [DOI] [PMC free article] [PubMed] [Google Scholar]
- 25.Yoder BK, Tousson A, Millican L, Wu JH, Bugg CE, Jr, Schafer JA, Balkovetz DF. Polaris, a protein disrupted in orpk mutant mice, is required for assembly of renal cilium. Am J Physiol Renal Physiol 282: F541–F552, 2002 [DOI] [PubMed] [Google Scholar]
- 26.Zhang ZR, Chu WF, Song B, Gooz M, Zhang JN, Yu CJ, Jiang S, Baldys A, Gooz P, Steele S, Owsianik G, Nilius B, Komlosi P, Bell PD. TRPP2 and TRPV4 form an EGF-activated calcium permeable channel at the apical membrane of renal collecting duct cells. PLoS One 8: e73424, 2013 [DOI] [PMC free article] [PubMed] [Google Scholar]