

Abstract
The pathobiology of irritable bowel syndrome (IBS) is multifaceted. We aimed to identify candidate genes predisposing to quantitative traits in IBS. In 30 healthy volunteers, 30 IBS-constipation, and 64 IBS-diarrhea patients, we measured bowel symptoms, bile acid (BA) synthesis (serum 7α-hydroxy-4-cholesten-3-one and FGF19), fecal BA and fat, colonic transit (CT by scintigraphy), and intestinal permeability (IP by 2-sugar excretion). We assessed associations of candidate genes controlling BA metabolism (KLB rs17618244 and FGFR4 rs351855), BA receptor (GPBAR1 rs11554825), serotonin (5-HT) reuptake (SLC6A4 through rs4795541 which encodes for the 44-bp insert in 5HTTLPR), or immune activation (TNFSF15 rs4263839) with three primary quantitative traits of interest: colonic transit, BA synthesis, and fecal BA excretion. There were significant associations between fecal BA and CT at 48 h (r = 0.43; P < 0.001) and IP (r = 0.23; P = 0.015). GPBAR1 genotype was associated with CT48 (P = 0.003) and total fecal BA [P = 0.030, false detection rate (FDR) P = 0.033]. Faster CT48 observed with both CC and TT GPBAR1 genotypes was due to significant interaction with G allele of KLB, which increases BA synthesis and excretion. Other univariate associations (P < 0.05, without FDR correction) observed between GPBAR1 and symptom phenotype and gas sensation ratings support the role of GPBAR1 receptor. Associations between SLC6A4 and stool consistency, ease of passage, postprandial colonic tone, and total fecal BA excretion provide data in support of future hypothesis-testing studies. Genetic control of GPBAR1 receptor predisposing to pathobiological mechanisms in IBS provides evidence from humans in support of the importance of GPBAR1 to colonic motor and secretory functions demonstrated in animal studies.
Keywords: bile acid, immune, serotonin, transit
the pathobiology of irritable bowel syndrome (IBS) includes abnormal motility and sensation, psychosocial factors, and alterations in mucosal defense, manifested as altered mucosal structure and function (including serotonergic mechanisms), low-grade inflammation, and barrier functions which may result from intraluminal irritants (7). Appraising the predisposition of candidate genes to IBS pathobiology requires valid biomarkers (5).
In one series of 119 patients with IBS, 48% with diarrhea-predominant IBS (IBS-D) had accelerated transit and 21% with constipation-predominant IBS (IBS-C) had delayed transit (12). In an expanded cohort of 286 patients with lower functional gastrointestinal disorders, we detected delayed colonic transit at 48 h in 22.9% patients with IBS-C/functional constipation and accelerated colonic transit at 24 h in 33.3% of IBS-D/functional diarrhea (32).
A meta-analysis showed bile acid (BA) malabsorption (BAM) in up to 50% of patients with chronic functional diarrhea or IBS-D (48). About one-third of patients with IBS-D have increased and 10% of IBS-C patients have decreased fecal BA excretion and hepatic BA synthesis rates, compared with healthy controls (39, 49). We have reported that colonic transit at 24 h and 48 h and 48-h fecal BA excretion are significant biomarkers for differentiating health from IBS, and IBS-C from IBS-D (15).
Genetic predisposition to altered BA enterohepatic circulation [specifically in KLB gene alone (Fig. 1)] and genetic variations in FGFR4 in combination with KLB have been associated with accelerated colonic transit (50). However, those studies did not assess the associations of those gene variants on levels of BA synthesis or excretion, which may also contribute to the acceleration of colonic transit observed in patients with IBS-D.
Fig. 1.

Fibroblast growth factor receptor 4 and klotho β control the feedback inhibition of bile acid synthesis; after bile acids are secreted into the biliary canaliculi, they activate GPBAR1 receptors located on the cell membranes of a variety of effector cells including enteroendocrine cells, enteric neurons, and visceral afferents to transduce the motor, sensory, and secretory effects of bile acids. IBAT, ileal bile acid transporter. Reproduced from Ref. 8 with permission. © 2014 The Authors. The Journal of Physiology © 2014 The Physiological Society.
Effects of intraluminal BAs in animal studies are reported to be mediated, at least in part, by the novel BA receptor, GPBAR1 (or TGR5) (27). This is expressed in the enteric nervous system and enteroendocrine cells (35). GPBAR1 mediates the prokinetic actions of intestinal BAs, is required for normal defecation in mice (1), and causes relaxation of gastric smooth muscle (36). In addition, it is expressed on primary spinal afferent and spinal neurons involved in sensory transduction, potentially affecting visceral sensation (30), which is relevant in IBS. We have previously reported borderline associations (16) of the single nucleotide polymorphism (SNP) rs11554825 in GPBAR1 gene with overall orocecal transit (colonic filling at 6 h, P = 0.061), and colonic transit [geometric center (GC) at 24 h, P = 0.083]. rs11554825 is located in exon 1 in an untranslated region, close to the gene GPBAR1 on chromosome 2; this SNP has been associated with ulcerative colitis and primary sclerosing cholangitis. It is also in linkage disequilibrium with several mutations in exon 2 that result in reduced expression of the gene, resulting in reduced GPBAR1 synthesized as well as reduced responsiveness of transfected HEK293 cells to the conjugated bile salt (taurolithocholate) (25).
There are no other human data to support a biological role of this novel BA receptor in colonic functions or in the pathobiology of IBS.
In addition to these genetic variants related to BA synthesis and receptor, gene variations in two other genes modify the functions of pivotal mechanisms in IBS. SLC6A4 is the gene for the serotonin (5-HT) transporter protein [in which the most biologically relevant variant reported to date is the 44-bp insert in the 5-HT transporter (SERT)-linked polymorphic region (5-HTTLPR)]. Recent evidence has emphasized the potential role of SLC6A4 as a predisposing gene variant in the development of IBS in different populations, including Caucasian and Asian people, and was confirmed in a meta-analysis of 25 studies (29, 51, 52). SLC6A4 genotype was also significantly associated with symptom severity in IBS (18). The 5-HTTLPR genotype (S allele) was associated with higher pain sensory ratings during rectal distension studies in health and IBS (9), and with greater regional cerebral blood flow in response to colorectal distension in patients with IBS (20).
TNFSF15 is involved in immune modulation and has been associated with the IBS symptom phenotype in three separate cohorts of patients from Sweden, United States, and United Kingdom (41, 54). However, TNFSF15 variation has not been associated with colonic transit or sensation in patients with lower functional gastrointestinal disorders (10).
Our primary study hypothesis was that candidate genetic variations that influence BA receptor (GPBAR1) or synthesis (KLB) are associated with symptoms and pathobiology in IBS-D and IBS-C, with particular interest in colonic transit and fecal BA excretion. The second hypothesis of our study was that candidate genes controlling BA synthesis (FGFR4), 5-HT reuptake (SLC6A4), and immune mechanisms (TNFSF15) that have been associated with symptoms but not with colonic transit in IBS (as summarized in Ref. 11) predispose to pathobiology in IBS. The specific aim was to assess the genetic predispositions altering biomarkers of IBS, through analysis of associations of variants in candidate genes controlling BA metabolism (KLB and FGFR4), BA receptor (GPBAR1), 5-HT reuptake transporter (SLC6A4), or immune activation (TNFSF15) with bowel function, total fecal BA, colonic transit, intestinal permeability, and BA synthesis and excretion in healthy controls and patients with IBS-D and IBS-C.
METHODS
Participants: Eligibility of Patients with IBS and Healthy Volunteers
The research study was approved by Mayo Clinic Institutional Review Board on October 28, 2011.
We invited participation from a database of ∼1,000 patients with functional gastrointestinal diseases who reside within ∼150 miles of Mayo Clinic in Rochester, Minnesota. Healthy volunteers were recruited from the same region. All participants completed validated bowel disease questionnaires including bowel disease questionnaire corresponding to Rome III criteria for IBS [including Somatic Symptom Checklist (43)] and the Hospital Anxiety and Depression Scale [HAD (53)]. Other inclusion criteria were age 18–65 yr, no restrictions based on HAD scores, no prior abdominal surgery other than appendectomy and cholecystectomy, on no medications for gastrointestinal symptoms for at least 48 h prior to the measurement of all gastrointestinal quantitative traits, and circulating levels of aspartate or alanine aminotransferase within two times the upper normal limit (to exclude possible hepatobiliary disease that might interfere with the data interpretation). In addition, we excluded patients with known bleeding diathesis given the need for sigmoid mucosal biopsies, and smokers or use of other tobacco products within at least 3 mo of testing given possible effects of such products on intestinal permeability (40).
A total of 30 healthy controls, 30 patients with IBS-C, and 64 patients with IBS-D [by Rome III criteria (31)] were prospectively studied over ∼24 mo.
Measurements of Quantitative Traits
Quantitative traits were measured by extensively validated methods in our laboratory: colonic transit at 24 and 48 h, serum 7α-hydroxy-4-cholesten-3-one (C4), serum FGF19, total 48-h fecal BA excretion, percentage of individual BA excreted, fecal fat excretion over 48 h, and urine mannitol excretion after oral ingestion.
Scintigraphic Gastrointestinal and Colonic Transit
To measure gastrointestinal and colonic transit, we used the dual-isotope method, which has been extensively used and validated, including studies of 287 patients with lower functional gastrointestinal diseases (32), and the performance characteristics of the method in health and IBS (18). Briefly, 0.1 mCi 111InCl3 was mixed with a slurry of 5 mg of activated charcoal, evaporated to dryness, and packed into a gelatin capsule that was coated with one layer of methacrylate, which dissolves in a pH-sensitive manner upon reaching the quasi-alkaline terminal ileum, allowing radiolabel transfer to the colon for quantitation of colon transit. The capsule was administered following an overnight fast; after it had been shown by gamma camera to have emptied from the stomach, subjects ingested a 99mTc-labeled meal. Subjects ingested standardized meals for lunch and dinner, 4 and 8 h after the radiolabeled breakfast. Using the gamma camera, abdominal images (anterior and posterior images of 2 min duration) were acquired at specified times during the subsequent 48-h period. For colonic transit (major focus of this study), 111In counts were quantified within a 247 keV (± 20%) window, and a variable region of interest program was employed to quantitate counts in the colon. Counts were corrected for isotope decay and tissue attenuation. The geometric center (GC) of colonic counts was used to quantify transit at 24 and 48 h. The GC is the weighted average of the counts in the different segments of the colon, ascending (AS), transverse (TC), descending (DC), and rectosigmoid (RS) colon, numbered as segments 1 to 4, respectively, and segment 5 is the difference between 100% of abdominal counts minus counts in the colon, which was previously validated as virtually equivalent with counts in expelled stool (S). The GC is calculated by the formula
A high GC implies fast colonic transit, whereas a low GC implies slow colonic transit.
48-h Stool Collection on 100 g Fat Diet
The participants were asked to follow a diet of at least 100 g of fat per day for 4 days, which consisted of 2 days before and during the 48-h stool collection on days 3 and 4. Volunteers recorded in a diary the food and the grams of fat consumed each day. They collected all bowel movements in a 48-h period. These samples were kept cold in supplied coolers with ice packs or in the volunteer's freezer and returned to the research center the day following the completion of the 48-h stool collection.
Bile Acid Malabsorption and Synthesis
We used two methods to document diarrhea related to BA.
Serum 7α-hydroxy-4-cholesten-3-one.
Serum C4 is a measurement of hepatic cholesterol synthesis and is closely related to the fecal loss of BAs. Serum C4 is a validated method for measurement of BAM. In head-to-head comparisons with the 75SeHCAT retention test, increased serum C4 had sensitivity of 90% and specificity of 79% in diagnosing BAM (38) where shorter retention half-time of 75SeHCAT was associated with increased level of C4 and had 98% negative predictive value and 74% positive predictive value for diagnosis of BAM (6).
Following the method adapted from Gälman et al. (21), and using HPLC/tandem mass spectrometry, we used serum C4 to screen for high BA synthesis (14).
Fecal BA excretion.
Using HPLC/tandem mass spectrometry, we have adapted a method used with serum samples (42) to measure fecal total and individual BAs (39) in a 48-h collection of stools collected during ingestion of a 100 g fat/day diet, measured by HPLC/tandem mass spectrometry.
Serum FGF19
Serum fibroblast growth factor 19 (FGF19), a measure of feedback regulation of BA synthesis (46), was measured by ELISA (FGF19 Quantikine Enzyme-Linked Immunosorbent Assay Kit, R&D Systems, Minneapolis, MN), as in previous studies (34).
Fecal Fat
Daily fecal fat excretion, while ingesting a 100 g fat diet daily, was measured by nuclear magnetic resonance spectrometry at Mayo Clinic's Department of Laboratory Medicine and Pathology.
Colonic Permeability by Urinary Excretion of Lactulose and Mannitol After Oral Ingestion
We used orally administered lactulose (1 g) and mannitol (0.2 g) in liquid formulation (240 ml water) to study permeability (13). We had previously identified increased small bowel permeability in IBS-D compared with healthy controls (37). The 0- to 2-h urine reflects most closely small intestinal permeability and the 8- to 24-h urine reflects colonic permeability. The validated HPLC-tandem mass spectrometry method was used (13).
Selection of Genotypes of Interest in Synthesis and Effects of Bile Acids
A priori, the primary genotypes of interest were GPBAR1 (15), and KLB (50) since these were previously documented to be associated with alteration of small bowel or colonic transit, respectively. The SNPs in GPBAR1 and KLB are functionally significant: rs11554825 in GPBAR1 is associated with ulcerative colitis and primary sclerosing cholangitis (25) and has been shown to be in linkage disequilibrium with mutations in the exon from which the receptor protein GPBAR1 is transcribed. At least two of those mutations are associated with reduced TGR5 protein expression in HEK293 cells and reduced functional response to ascending doses of taurolithocholate (25). Similarly, the G allele of KLB is associated with reduced stability of the protein klotho β in HEK293 cells (50), and this reduces the negative feedback regulation by the ileal hormone FGF19 of hepatocyte BA synthesis.
In contrast, there were no associations of colonic transit with the other genes associated with the proteins and receptors involved in the enterohepatic circulation of BAs (50).
Genotyping Method
DNA was extracted from venous blood, and candidate genotype analysis was conducted by established PCR-based methods, as previously detailed in prior publications: rs4795541 [SLC6A4 (28)]; rs351855 (FGFR4), and rs17618244 [KLB (50)]; rs11554825 [GPBAR1 alias TGR5 (16)]; and rs4263839 [TNFSF15 (54)]. Gene names are given according to Hugo Gene Nomenclature.
Briefly, genomic DNA was isolated from whole blood by use of the QIAamp DNA Blood Maxi Kit (Qiagen, Valencia, CA), and stored at −80°C until genotyping. The serotonin transporter protein promoter polymorphism (SLC6A4 rs4795541), also referred to as 5′-HTTLPR, was determined by PCR-based fragment length. The remaining four SNPs were analyzed by TaqMan SNP Genotyping Assays (Applied Biosystems, Foster City, CA). Per the manufacturer's instructions: rs351855 (FGFR4, catalog no. C316661410F); rs17618244 (KLB, catalog no. C2562036310F); rs11554825 (GPBAR1, catalog no. C305885110F); and rs4263839 (TNFSF15, catalog no. C12026810F).
Following polymerase chain reaction amplification, end reactions were analyzed by using ABI 7300 Real-Time PCR System by Sequence Detection Software (Applied Biosystems).
Statistical Analysis
The quantitative traits measured among the three groups were summarized as means ± SE.
We used Spearman correlations to explore the associations of total fecal BA with colonic transit and intestinal permeability.
The univariate associations of each quantitative trait with genotype were assessed at α = 0.05 in the total set of participants by the Kruskal-Wallis test (general genetic, 2-degree of freedom model, which compares the three genotype groups: homozygous for major allele; heterozygous; and homozygous for minor allele). A priori, the primary genes of interest were GPBAR1 (16), and KLB (50); with these two primary genotypes of interest, we applied the Benjamini-Hochberg false detection rate (FDR) correction (P = 0.033).
We also assessed the impact of the primary genotypes of interest (GPBAR1 and KLB) in combination. This involved comparisons among the three GPBAR1 genotypes separately for each KLB genotype (AG and GG, since there was only 1 patient with AA genotype). Thus there were 6 comparisons for each of the 2 colonic transit end points, GC24 and GC48 (total 12), and 3 comparisons for total fecal BA excretion. With a Bonferroni correction, the adjusted P value for 12 pairwise comparisons is 0.004 (0.05/12), and for 3 comparisons it is 0.017 (0.05/3).
Statistical Power
Prestudy power analysis.
Table 1 shows the estimated genotype distribution of participants that would have been expected for the main genes of interest, based on earlier studies conducted in our center.
Table 1.
Effect sizes demonstrable with the primary endpoint of colonic transit, based on expected proportions of participants in each genotype
| Estimated Power (%) (a priori) for GPBAR1, KLB, and 5-HTTLPR (1-way ANOVA, α = 0.05, Overall SNP Effect) |
||||
|---|---|---|---|---|
| Response | A Priori SD | GPBAR1 rs11554825 | KLB rs17618244 | 5-HTTLPR rs4795541 |
| N with genotype in each SNP | CC (22), | AA (1), | LL (32), | |
| CT (63), | AG (45), | LS (68), | ||
| TT (38) | GG (77) | SS (23) | ||
| GC 24 h* | 0.87 | 95% | 61% | 86% |
Estimated power refers to the ability of the samples to demonstrate a difference of 0.5 geometric center (GC) units in colonic transit at 24 h (*GC 24 h values of 2.4, 2.9, and 3.4). SNP, single nucleotide polymorphism.
Poststudy power assessment.
The results obtained in this study were used to assess the post hoc power of the study to detect the overall effect of genotype variation for the three main genotypes of interest (GPBAR1, KLB, and SLC6A4) by use of the general genetic model. This power calculation had to be conducted separately for each of the three main genes of interest because the minor allele frequency of each SNP differs; the allelic distribution was identified by earlier studies conducted in our center in which we assessed the minor allele frequency in the same population from which the present study cohort was derived (9, 16, 50). The analysis focused on the power to detect overall associations of each genotype with two quantifiable traits; that is, differences in colonic transit measurement at 24 or 48 h of 0.5 geometric center units (estimated to be an effect size of 24 and 12% at 24 and 48 h, respectively) and differences in total fecal BA excretion of 800 mM (that is, ∼40% effect size) across the three groups of participants.
RESULTS
Demographics and Psychosomatic Features of Participants
Age and sex distributions were similar in the three groups (Table 2), but there were higher psychosomatic symptom and depression scores in IBS patients relative to controls.
Table 2.
Demographics, psychosomatic scores and quantitative measurements of the 3 groups of participants
| IBS-C | Healthy Controls | IBS-D | P Value | |
|---|---|---|---|---|
| N | 30 | 30 | 64 | |
| Gender, female/male | 30/0 | 22/8 | 59/5 | |
| Age, yr | 44.6 ± 1.1 | 39.3 ± 2.1 | 41.9 ± 1.5 | 0.161 |
| BMI, kg/m2 | 26.6 ± 0.8 | 25.4 ± 0.7 | 29.7 ± 0.9 | 0.013 |
| Anxiety score (HAD) | 2.8 ± 0.5 | 2.1 ± 0.3 | 4.0 ± 0.5 | 0.117 |
| Depression score (HAD) | 0.9 ± 0.2 | 0.4 ± 0.1 | 1.6 ± 0.2 | 0.0005 |
| Psychosomatic symptom score | 0.4 ± 0.06 | 0.2 ± 0.04 | 0.5 ± 0.04 | <0.0001 |
| Bowel function | ||||
| No. of BM/day | 0.85 ± 0.1 | 1.18 ± 0.1 | 2.26 ± 0.1 | <0.0001 |
| BM form | 2.86 ± 0.2 | 3.77 ± 0.1 | 4.76 ± 0.1 | <0.0001 |
| Quantitative traits | ||||
| Fecal fat, g/day | 5.1 ± 0.9 | 6.6 ± 0.8 | 9.1 ± 0.9 | 0.007 |
| Serum C4, ng/ml | 23.5 ± 4.4 | 25.3 ± 3.1 | 34.7 ± 3.6 | 0.019 |
| Serum FGF-19, pg/ml | 134.9 ± 18.4 | 171.6 ± 25.0 | 118.8 ± 10.8 | 0.051 |
| Total fecal bile acid, mM | 579 ± 161 | 957 ± 185 | 2495 ± 382 | <0.0001 |
| Mean% fecal LCA/CDCA/DCA/CA/UDCA | 49/1/48/2/1 | 39/1/59/1/1 | 30/6/53/8/4 | <0.001 except DCA P = 0.033 |
| Gastric emptying T1/2, min | 117.3 ± 5.0 | 120.0 ± 5.7 | 124.7 ± 3.8 | 0.51 |
| Colonic filling at 6 h,% | 55.0 ± 5.5 | 54.1 ± 4.3 | 55.2 ± 3.4 | 0.92 |
| Colonic transit GC24 | 2.34 ± 0.2 | 2.41 ± 0.2 | 2.85 ± 0.2 | 0.13 |
| Colonic transit GC48 | 3.22 ± 0.17 | 3.86 ± 0.17 | 4.18 ± 0.12 | 0.0001 |
| Urine mannitol 0–2 h | 264.8 ± 42.9 | 355.2 ± 49.5 | 444.3 ± 75.2 | 0.039 |
| Urine mannitol 8–24 h | 65.8 ± 16.1 | 43.6 ± 4.2 | 45.5 ± 5.0 | 0.708 |
Values are means ± SE. Kruskal-Wallis test was used to assess the associations of quantitative traits in the 3 groups. Percentages of individual bile acids rounded to the closest whole number.
IBS-C; IBS-predominant constipation; IBS-D, IBS-predominant diarrhea; HAD, Hospital Anxiety and Depression Scale; BM, bowel movements; C4, 7 α-hydroxy-4-cholesten-3-one; LCA, lithocholic acid; CDCA, chenodeoxycholic acid; DCA, deoxycholic acid; CA, cholic acid; UDCA, ursodeoxycholic acid; ns, not significant.
Quantitative Traits and Relationships of Bile Acid, Colonic Transit, and Intestinal Permeability
Table 2 shows differences in IBS-C, IBS-D, and healthy control groups in numbers of bowel movements, stool consistency, colonic transit (GC48 h), intestinal permeability, fecal fat, serum FGF19 and C4, and total fecal BA excretion. As anticipated, there were numerical differences in several of the quantitative trait measurements in the three groups for colonic transit, serum C4 and FGF, fecal fat, and fecal BA excretion.
There were significant associations between total fecal BA and colonic transit at 24 h (rS = 0.25, P = 0.008) and at 48 h (rS = 0.43; P < 0.001), and intestinal permeability (rS = 0.23; P = 0.015).
Bowel Function, Fecal Bile Acids, Colonic Transit, and Intestinal Permeability in Relation to Candidate Genes
Table 3 presents the quantitative traits in the total set of participants for each candidate gene.
Table 3.
Candidate gene SNPs and bowel function, total fecal bile acids, colonic transit, and intestinal permeability
| N | No. of BM/day | BM Form | Fecal bile acid excretion, mM | Colonic Transit GC24 | Colonic Transit GC48 | Urine Mannitol 0–2 h | Urine Mannitol 8–24 h | |
|---|---|---|---|---|---|---|---|---|
| rs11554825 (GPBAR1) | ||||||||
| CC | 22 | 1.6 ± 0.2 | 4.1 ± 0.3 | 2,416 ± 799.5 | 3.0 ± 0.3 | 4.2 ± 0.2 | 552.8 ± 198.0 | 51.8 ± 9.1 |
| CT | 63 | 1.5 ± 0.1 | 3.9 ± 0.1 | 1,232 ± 234.6 | 2.4 ± 0.1 | 3.6 ± 0.1 | 313.0 ± 30.7 | 49.6 ± 8.8 |
| TT | 39 | 1.9 ± 0.2 | 4.2 ± 0.2 | 1,908 ± 352.0 | 2.8 ± 0.2 | 4.2 ± 0.1 | 373.3 ± 41.5 | 50.4 ± 5.5 |
| rs17618244 (KLB) | ||||||||
| AA* | 1 | 0.3 | 2.0 | 225.5 | 1.4 | 2.2 | 134.0 | 32 |
| AG | 45 | 1.7 ± 0.2 | 4.1 ± 0.2 | 1,673 ± 280.4 | 2.4 ± 0.2 | 3.7 ± 0.2 | 391.7 ± 94.5 | 51.3 ± 10.9 |
| GG | 78 | 1.7 ± 0.1 | 4.1 ± 0.1 | 1,685 ± 313.3 | 2.6 ± 0.1 | 3.8 ± 0.1 | 369.1 ± 35.2 | 49.9 ± 4.8 |
| rs351855 (FGFR4) | ||||||||
| AA | 13 | 1.6 ± 0.2 | 4.2 ± 0.2 | 1,669 ± 497.6 | 2.3 ± 0.3 | 4.1 ± 0.3 | 334.8 ± 58.0 | 38.0 ± 4.9 |
| AG | 58 | 1.7 ± 0.1 | 4.2 ± 0.1 | 1,632 ± 233.2 | 2.7 ± 0.1 | 3.9 ± 0.1 | 401.9 ± 76.6 | 44.3 ± 3.8 |
| GG | 53 | 1.5 ± 0.1 | 4.0 ± 0.2 | 1,709 ± 445.8 | 2.6 ± 0.2 | 3.8 ± 0.2 | 357.1 ± 45.2 | 59.2 ± 10.3 |
| rs4795541 (SLC6A4) | ||||||||
| LL | 32 | 1.4 ± 0.3 | 3.6 ± 0.2 | 1,197 ± 324.8 | 2.5 ± 0.2 | 3.7 ± 0.2 | 299.9 ± 40.8 | 58.1 ± 15.5 |
| LS | 69 | 1.7 ± 0.1 | 4.3 ± 0.1 | 1,774 ± 344.5 | 2.6 ± 0.1 | 3.9 ± 0.1 | 428.3 ± 69.0 | 48.2 ± 4.8 |
| SS | 23 | 2.0 ± 0.3 | 4.0 ± 0.2 | 1,964 ± 395.6 | 2.9 ± 0.3 | 4.1 ± 0.2 | 328.0 ± 51.2 | 45.4 ± 5.5 |
| rs4263839 (TNFSF15) | ||||||||
| AA | 12 | 2.0 ± 0.3 | 4.2 ± 0.3 | 1,655 ± 561.1 | 2.8 ± 0.4 | 4.0 ± 0.3 | 413.5 ± 81.6 | 38.6 ± 6.0 |
| AG | 65 | 1.6 ± 0.1 | 4.2 ± 0.1 | 1,390 ± 250.8 | 2.6 ± 0.1 | 3.8 ± 0.1 | 351.4 ± 63.9 | 46.0 ± 4.4 |
| GG | 47 | 1.6 ± 0.2 | 3.9 ± 0.2 | 2,055 ± 443.8 | 2.6 ± 0.2 | 4.0 ± 0.2 | 400.8 ± 54.2 | 59.5 ± 11.8 |
Values are means ± SE.
N = 1 subject.
Significant associations of GPBAR1 variant gene with colonic transit and fecal BA excretion in IBS.
The overall associations of GPBAR1 rs11554825 with colonic transit at 48 h (P = 0.003; Fig. 2A and Table 3), and with total fecal BA excretion (P = 0.030) were also significant, even after correction for FDR (P < 0.033). No other primary end point was significantly associated with any genotype after FDR correction.
Fig. 2.
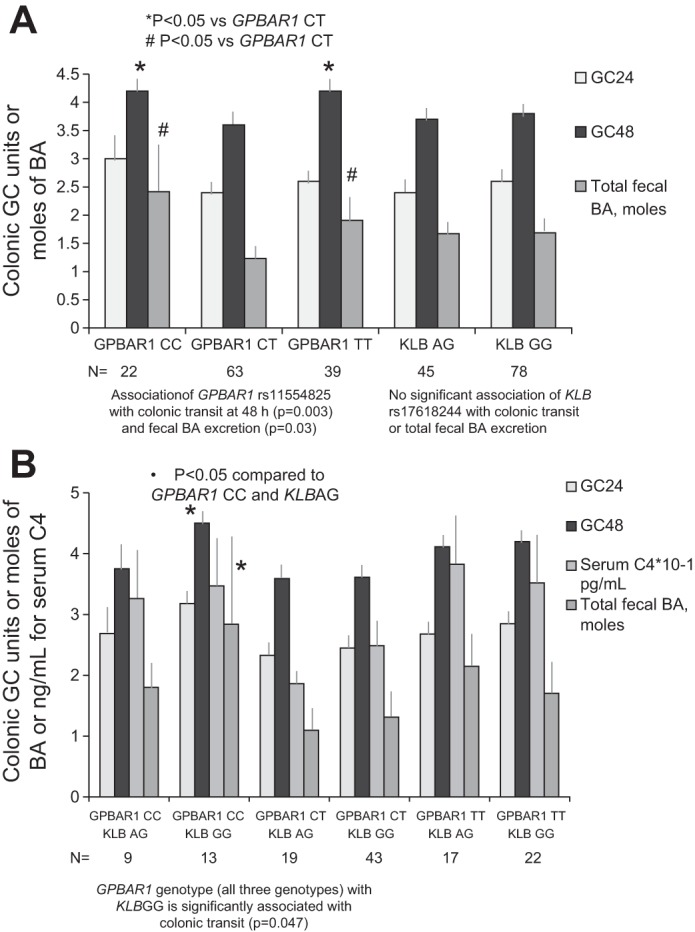
Association of individual GPBAR1 and KLB genotypes (A) and combination genotypes and colonic transit and bile acid (BA) synthesis or excretion (B). The homozygous GPBAR1 genotypes (CC and TT) are associated with accelerated colonic transit [geometric center (GC) at 48 h (GC48)]. This effect on transit is influenced by the interaction with the KLB G allele, which results in higher BA synthesis [serum 7α-hydroxy-4-cholesten-3-one (C4)], and total fecal BA excretion. Thus, in the presence of the GPBAR1 CC genotype, which is itself associated with accelerated transit (P = 0.003, A), the KLB GG genotype together with GPBAR1 CC genotype results in the fastest colonic transit and increased fecal BA excretion (B). More specifically, in the patients with KLB GG genotype, colonic transit (GC48) was significantly associated with GPBAR1 genotype (P = 0.047, adjusted for 12 pairwise comparisons of transit measures).
Interactions between GPBAR1 and KLB genes and the effects on colonic transit and BA parameters.
Figure 2A shows that the CC and TT genotypes of rs11554825 GPBAR1 were both associated with faster colonic transit relative to the CT heterozygotes.
Figure 2B and Table 4 show that KLB rs17618244 GG (which induces higher synthesis of BA) (52) when present with GPBAR1 CC genotype is associated with very high fecal total BA excretion and extremely rapid colon transit (GC48). KLB GG in association with GPBAR1 CT genotype causes moderate levels of fecal BA and C4 and moderate acceleration of colonic transit (GC48). In the presence of the KLB GG genotype, GPBAR1 CC accelerated colonic transit at 48 h relative to the GPBAR1 CT genotype [P = 0.0039 (unadjusted) or P = 0.047 (adjusted for 12 comparisons of colonic transit at both 24 and 48 h)]. The pairwise comparison between GPBAR1 CC and TT genotypes in the presence of KLB GG genotype was significant (P = 0.020), but not significant after adjustment for 12 comparisons. The effect of GPBAR1 genotypes CC and CT on total fecal BA excretion was significant [P = 0.042 (adjusted for 3 pairwise comparisons)]. No significant associations were detected for the KLB AG genotype in combination with GPBAR1 genotype.
Table 4.
Combination of candidate gene SNPs showing interaction in the association with colonic transit and total fecal bile acids, but not serum C4
| rs11554825 (GPBAR1) | rs17618244 (KLB) | N | No. of BM/day | BM form | Serum C4, ng/ml | Fecal bile acid excretion, mM | Colonic transit GC24 | Colonic transit GC48 |
|---|---|---|---|---|---|---|---|---|
| CC | AA | 0 | ||||||
| AG | 9 | 1.4 ± 0.3 | 4.2 ± 0.4 | 32.6 ± 8.1 | 1,800 ± 466 | 2.7 ± 0.5 | 3.8 ± 0.4 | |
| GG | 13 | 1.7 ± 0.3 | 4.1 ± 0.4 | 34.7 ± 7.9 | 2,842 ± 1,325 | 3.2 ± 0.3 | 4.5 ± 0.2 | |
| CT | AA | 1 | 0.3 | 2.0 | 16.0 | 226 | 1.4 | 2.2 |
| AG | 19 | 1.6 ± 0.2 | 3.9 ± 0.3 | 18.6 ± 2.2 | 1,095 ± 357 | 2.3 ± 0.3 | 3.6 ± 0.3 | |
| GG | 43 | 1.5 ± 0.1 | 4.0 ± 0.2 | 24.9 ± 2.8 | 1,310 ± 302 | 2.4 ± 0.2 | 3.6 ± 0.1 | |
| TT | AA | 0 | ||||||
| AG | 17 | 1.9 ± 0.3 | 4.2 ± 0.3 | 38.3 ± 7.5 | 2,149 ± 541 | 2.7 ± 0.3 | 4.1 ± 0.2 | |
| GG | 22 | 2.0 ± 0.3 | 4.2 ± 0.2 | 35.2 ± 7.3 | 1,704 ± 469 | 2.8 ± 0.3 | 4.2 ± 0.2 |
Values are means ± SE.
In our present patient cohort, GPBAR1 CC genotype is not observed with KLB AA genotype; therefore, we cannot assess effect of GPBAR1 CC genotype when there is reduced BA synthesis (which would be expected with KLB AA genotype).
There were no associations of the proportions of individual BAs with genotype, as shown for GPBAR1 in Table 5. The data for the other genes are not shown.
Table 5.
Association of GPBAR1 genotype with proportions (%) of individual bile acids
| rs11554825 | N | LCA | CDCA | DCA | CA | UDCA |
|---|---|---|---|---|---|---|
| CC | 22 | 32.5 ± 3.8 | 4.6 ± 1.3 | 53.5 ± 3.2 | 6.6 ± 2.3 | 2.8 ± 0.7 |
| CT | 63 | 40.9 ± 2.3 | 3.0 ± 0.6 | 50.0 ± 1.9 | 4.2 ± 1.2 | 1.9 ± 0.3 |
| TT | 39 | 32.6 ± 2.9 | 3.3 ± 0.8 | 57.9 ± 2.5 | 3.7 ± 1.0 | 2.5 ± 0.5 |
Values are means ± SE.
Univariate associations of candidate genes and quantitative traits in IBS.
There were univariate (P ≤ 0.05) associations (Table 6) of 1) GPBAR1 (rs11554825) with overall symptom phenotype (IBS vs. health), total fecal BA excretion, and gastric emptying; and 2) 5HTTLPR (rs4795541) with stool consistency, ease of stool passage, and total fecal BA excretion. Also 3) FGFR4 (rs351855) showed borderline association with serum FGF19 (P = 0.06).
Table 6.
Univariate associations of responses with genotype
| Candidate Genotype and Associated P Value for Symptom or Quantitative Trait |
|||||
|---|---|---|---|---|---|
| Symptoms and Phenotype | GPBAR1 | KLB | FGFR4 | SLC6A4 | TNFSF15 |
| Gene SNP or Variant | rs11554825 | rs17618244 | rs351855 | rs4795541 | rs4263839 |
| Symptom phenotype (IBS-C or D, or healthy) (n = ∼124) | 0.045 | 0.734 | 0.007 | 0.060 | 0.382 |
| HAD score anxiety | 0.055 | 0.379 | 0.175 | 0.959 | 0.913 |
| HAD score depression | 0.965 | 0.068 | 0.050 | 0.554 | 0.654 |
| Psychosomatic symptom score | 0.375 | 0.333 | 0.008 | 0.994 | 0.113 |
| Mean no. of stools | 0.098 | 0.254 | 0.722 | 0.090 | 0.168 |
| Mean stool consistency | 0.441 | 0.327 | 0.851 | 0.042 | 0.396 |
| Mean ease of stool passage | 0.122 | 0.246 | 0.424 | 0.039 | 0.215 |
| Mean proportion of incomplete evacuations | 0.429 | 0.295 | 0.003 | 0.927 | 0.516 |
| Fat and bile binetics (n = ∼124) | |||||
| Serum FGF19 (pg/ml | 0.178 | 0.743 | 0.060 | 0.171 | 0.855 |
| Serum C4, ng/ml | 0.100 | 0.891 | 0.838 | 0.827 | 0.342 |
| Total fecal bile acid, mM | 0.030 | 0.547 | 0.519 | 0.038 | 0.131 |
| Total fecal fat (g/24 h) | 0.776 | 0.521 | 0.800 | 0.334 | 0.113 |
| Transit data (n = ∼124) | |||||
| GE T½, min | 0.035 | 0.750 | 0.656 | 0.735 | 0.379 |
| Colon GC 24 h | 0.114 | 0.334 | 0.672 | 0.403 | 0.958 |
| Colon GC 48 h | 0.003 | 0.274 | 0.840 | 0.384 | 0.869 |
| Ascending colon T½, h | 0.049 | 0.341 | 0.366 | 0.421 | 0.631 |
| Permeability data (n = ∼117) | |||||
| Mannitol excretion (0–2 h) | 0.569 | 0.364 | 0.957 | 0.555 | 0.296 |
| Mannitol excretion (8–24 h) | 0.381 | 0.859 | 0.873 | 0.837 | 0.755 |
| L:M ratio (0–2 h) | 0.682 | 0.908 | 0.714 | 0.734 | 0.706 |
| L:M ratio (8–24 h) | 0.674 | 0.399 | 0.779 | 0.622 | 0.442 |
P values are based on Kruskal-Wallis test, Fisher's exact test (symptom phenotype) assuming the 2° of freedom general genetic model. L:M, lactulose-to-mannitol ratio; GET½, gastric emptying half time.
Variants in TNFSF15 (rs4263839) and KLB (rs17618244) were not individually associated with any quantitative traits. There were no univariate associations between the candidate gene variations and small bowel or colonic permeability (based on urine mannitol, lactulose, or lactulose-to-mannitol ratio).
Symptom Phenotype and Relation to Candidate Genes
There were significant associations (P < 0.033) of FGFR4 gene variant with IBS phenotype, psychosomatic symptom score, and sensations of ease of stool passage and of incomplete evacuation.
Post Hoc Analysis of Statistical Power in the Present Study
Table 7 shows the statistical power to identify a clinically meaningful difference in the colonic transit or total fecal BA measurements by using the observed measurements in the entire cohort, based on a 1-way ANOVA (α = 0.05) for the overall genotype effect. The table also shows that the power for each genotype of interest is influenced by the minor allele frequencies. The cited allele frequencies are based on prior studies from our laboratory (16, 28, 50) in 695 people (patients with IBS and healthy controls, who had similar ethnicity and race to the participants in the present study). In summary, the data show that there was adequate power for GPBAR1 and SLC6A4 genotypes to identify an effect of 0.5 GC unit in relation to colonic transit, and there was moderate power to identify an effect of ∼40% on fecal BA excretion.
Table 7.
Estimated post hoc power (%) for GPBAR1, KLB, and SLC6A4
| SNP | GPBAR1 rs11554825 | KLB rs17618244 | SLC6A4 rs4795541 |
|---|---|---|---|
| Allele frequencies | C: 42.2%; T: 57.8% | A: 19%; G: 81% | S: 43%; L: 57% |
| Colon transit GC @24 h | 84% | 37% | 59% |
| Colon transit GC @48 h | 80% | 48% | 74% |
| Total fecal BA | 61% | 11% | 17% |
Values were determined by 1-way ANOVA, α = 0.05, overall SNP effect. In this analysis, it was assumed that the colonic transit between genotypes for each SNP would differ by 0.5 GC units (e.g., GC24 h values of 2.4, 2.9, and 3.4) and total fecal BA values by 800 mM (e.g., 957, 1,757, and 2,557 mM). The minor allele frequencies are based on prior studies from our laboratory in 695 people (patients with IBS and healthy controls, who had similar ethnicity and race to the participants in the present study) for the specific genetic variants in GPBAR1 and KLB and 626 people for SLC6A4.
DISCUSSION
These data show that the GPBAR1 and KLB genes, respectively affecting biological effects and synthesis of BAs, are significantly associated with quantitative traits in IBS: colonic transit and total fecal BA excretion. We also observed significant associations between total fecal BA and colon transit at 48 h and intestinal permeability, consistent with the biological effects of di-α-hydroxy BAs on colonic secretion (2, 17), and motility (4). Similarly, the association of total fecal BA and intestinal permeability is consistent with the effects of BAs in rodent (23) and mammalian intestine and colon [e.g., rabbit colon (17)].
Association of Candidate Genetic Variations with Quantitative Traits in IBS
Our results also show that genetic control of GPBAR1 rs11554825 is associated with colonic transit at 48 h, even with FDR correction. We believe that this SNP is functionally relevant, as reported by Hov et al. (25).
GPBAR1 rs11554825 was also univariately associated with several clinical features (symptoms phenotype and anxiety, the latter being generally associated with the IBS-D phenotype), and total fecal BA excretion. The association between rs11554825 and total fecal BA excretion (and, possibly, serum C4) is also consistent with effects of GPBAR1 and BA homeostasis. Thus the GPBAR1 receptor contributes to BA homeostasis, as demonstrated in GPBAR1 homozygous mice (33). Overall, the associations of GPBAR1 genotype with colonic transit and total fecal BA excretion suggest that this gene predisposes carriers to pivotal pathophysiological mechanisms in IBS and provides evidence from humans in support of the importance of GPBAR1 to colonic motor and secretory functions demonstrated in animal studies, typically in knockout mice.
The significant FDR-corrected association of GPBAR1 with colonic transit at 48 h is intriguing, given the higher colonic transit observed with both CC and TT genotypes compared with CT genotype. GPBAR1 C allele (that is CC/CT group). Has been associated with borderline acceleration of small bowel and colonic transit in IBS-D (16). In the present study, GPBAR1 TT genotype was associated with numerically faster colonic transit when coupled with the G allele of KLB rs17618244 (i.e., AG or GG genotype); the KLB GG genotype results in a KLB protein with reduced stability (50) causing reduced FGF19-induced inhibition of BA synthesis and, therefore, higher BA synthesis rates. The three GPBAR1 genotypes in combination with KLB GG genotype were associated with accelerated colonic transit in the present analysis. The fastest colonic transit was observed with the GPBAR1 CC genotype in association with KLB GG genotype, which was previously shown to respectively accelerate transit (16) and reduce the feedback inhibition of BA synthesis (50).
Potential Significance of Other Univariate Associations
The potential significance of other univariate associations with SLC6A4 rs4795541 and FGFR4 rs351855 is discussed here.
Variation in the SLC6A4 gene (rs4795541) is associated with alteration in the function of the serotonin-transporter protein, SERT, and therefore determines the amount of 5-HT having access to serotonergic receptors. The present study shows associations with symptom phenotype and bowel functions that are consistent with effects of 5-HT. The association of SLC6A4 rs4795541 with fecal total BA is consistent with the effect of 5-HT on bile salt pool, possibly through significant induction of apical sodium-dependent BA transporter (47) or increased expression of renal BA transporters (26).
The borderline association observed between FGFR4 rs351855 and serum FGF19 is consistent with the hypothesis that the genetic variant in FGFR4 alters the function of the FGFR4-KLB receptor complex on the hepatocyte plasma membrane, leading to decreased negative feedback by endogenous FGF19, which could lead to increased hepatic BA synthesis and, ultimately, to stimulation of colonic transit. The previous observation showing that FGFR4 rs351855 alone was not significantly associated with colonic transit (49) was confirmed in the present study.
The univariate association of GPBAR1 with gastric emptying is consistent with the role of GPBAR1 receptor in mediating relaxation of gastric smooth muscle (36), and with the release from enteroendocrine L cells (35) of the incretin, GLP-1, which retards gastric emptying.
Potential Limitations
The sample size selected for this genetic association study was lower than that traditionally recommended for associations between individual genetic polymorphisms and subjective symptoms. On the other hand, it is relevant to note the post hoc analysis using the actual observed data showing adequate power to detect clinically meaningful quantitative differences of colonic transit (∼25% at 24 h and 12% at 48 h), and somewhat lower power for differences in fecal total BA excretion (Table 6).
The study population consisted mostly of women, with a male to female ratio of 1:9. Typically, a 1:2 ratio of males to females corresponds to the relative frequency of IBS in questionnaire-based epidemiological studies. Clinic samples of IBS patients are overwhelmingly female, e.g., 5:1 (females to males) in a clinic sample that addressed sex differences in irritable bowel symptoms (44). Nevertheless, studies of the effects of female sex, phase of menstrual cycle, and exogenously administered female sex hormones in postmenopausal women have shown only minor effects of progesterone or luteal phase on colonic transit in females (22, 24, 45).
In conclusion, genetic control of GPBAR1 receptor predisposes to differences in colonic transit and fecal BA excretion that are key pathobiological mechanisms in IBS; effects of GPBAR1 genotype are augmented in carriers of KLB GG genotype. These association studies also provide evidence from humans in support of the importance of GPBAR1 receptors to colonic motor and secretory functions that have been demonstrated in animal studies, including knockout and transgenic models (1, 35).
GRANTS
This study is supported by National Institutes of Health Grants RO1-DK92179 to Dr. Camilleri and Mayo Clinic Center for Clinical and Translational Science Grant UL1-TR000135.
DISCLOSURES
No conflicts of interest, financial or otherwise, are declared by the author(s).
AUTHOR CONTRIBUTIONS
M.C. and A.R.Z. conception and design of research; M.C. and A.R.Z. analyzed data; M.C. and A.R.Z. interpreted results of experiments; M.C. prepared figures; M.C. drafted manuscript; M.C., A.S., A.A., A.E.B., and A.R.Z. edited and revised manuscript; M.C. and A.R.Z. approved final version of manuscript; A.S., I.A.B., P.C., A.A., D.D.B., J.L., A.L., and L.J.D. performed experiments.
ACKNOWLEDGMENTS
The authors thank Michael Ryks and Deborah Rhoten for technical support and Cindy Stanislav for secretarial assistance.
REFERENCES
- 1.Alemi F, Poole DP, Chiu J, Schoonjans K, Cattaruzza F, Grider JR, Bunnett NW, Corvera CU. The receptor TGR5 mediates the prokinetic actions of intestinal bile acids and is required for normal defecation in mice. Gastroenterology 144: 145–154, 2013 [DOI] [PMC free article] [PubMed] [Google Scholar]
- 2.Alrefai WA, Saksena S, Tyagi S, Gill RK, Ramaswamy K, Dudeja PK. Taurodeoxycholate modulates apical Cl−/OH− exchange activity in Caco2 cells. Dig Dis Sci 52: 1270–1278, 2007 [DOI] [PubMed] [Google Scholar]
- 3.Areeshi MY, Haque S, Panda AK, Mandal RK. A serotonin transporter gene (SLC6A4). Polymorphism is associated with reduced risk of irritable bowel syndrome in American and Asian population: a meta-analysis. PLoS One 8: e75567, 2013 [DOI] [PMC free article] [PubMed] [Google Scholar]
- 4.Bampton PA, Dinning PG, Kennedy ML, Lubowski DZ, Cook IJ. The proximal colonic motor response to rectal mechanical and chemical stimulation. Am J Physiol Gastrointest Liver Physiol 282: G443–G449, 2002 [DOI] [PubMed] [Google Scholar]
- 5.Biomarkers Definitions Working Group. Biomarkers and surrogate endpoints: preferred definitions and conceptual framework. Clin Pharmacol Ther 69: 89–95, 2001 [DOI] [PubMed] [Google Scholar]
- 6.Brydon WG, Nyhlin H, Eastwood MA, Merrick MV. Serum 7 alpha-hydroxy-4-cholesten-3-one and seleno-homocholyltaurine (SeHCAT) whole body retention in the assessment of bile acid induced diarrhoea. Eur J Gastroenterol Hepatol 8: 117–123, 1996 [DOI] [PubMed] [Google Scholar]
- 7.Camilleri M. Peripheral mechanisms in irritable bowel syndrome. N Engl J Med 367: 1626–1635, 2012 [DOI] [PubMed] [Google Scholar]
- 8.Camilleri M. Physiological underpinnings of irritable bowel syndrome: neurohormonal mechanisms. J Physiol 2014 May 9 [Epub ahead of print] [DOI] [PMC free article] [PubMed] [Google Scholar]
- 9.Camilleri M, Busciglio I, Carlson P, McKinzie S, Burton D, Baxter K, Ryks M, Zinsmeister AR. Candidate genes and sensory functions in health and irritable bowel syndrome. Am J Physiol Gastrointest Liver Physiol 295: G219–G225, 2008 [DOI] [PMC free article] [PubMed] [Google Scholar]
- 10.Camilleri M, Carlson P, McKinzie S, Zucchelli M, D'Amato M, Busciglio I, Burton D, Zinsmeister AR. Genetic susceptibility to inflammation and colonic transit in lower functional gastrointestinal disorders: preliminary analysis. Neurogastroenterol Motil 23: 935–943, 2011 [DOI] [PMC free article] [PubMed] [Google Scholar]
- 11.Camilleri M, Katzka DA. Irritable bowel syndrome: methods, mechanisms, and pathophysiology. Genetic epidemiology and pharmacogenetics in irritable bowel syndrome. Am J Physiol Gastrointest Liver Physiol 302: G1075–G1084, 2012 [DOI] [PMC free article] [PubMed] [Google Scholar]
- 12.Camilleri M, McKinzie S, Busciglio I, Low PA, Sweetser S, Burton D, Baxter K, Ryks M, Zinsmeister AR. Prospective study of motor, sensory, psychological and autonomic functions in 119 patients with irritable bowel syndrome. Clin Gastroenterol Hepatol 6: 772–781, 2008 [DOI] [PMC free article] [PubMed] [Google Scholar]
- 13.Camilleri M, Nadeau A, Lamsam J, Nord SL, Ryks M, Burton D, Sweetser S, Zinsmeister AR, Singh R. Understanding measurements of intestinal permeability in healthy humans with urine lactulose and mannitol excretion. Neurogastroenterol Motil 22: e15–e26, 2010 [DOI] [PMC free article] [PubMed] [Google Scholar]
- 14.Camilleri M, Nadeau A, Tremaine WJ, Lamsam J, Burton D, Odunsi S, Sweetser S, Singh R. Measurement of serum 7alpha-hydroxy-4-cholesten-3-one (or 7alphaC4), a surrogate test for bile acid malabsorption in health, ileal disease and irritable bowel syndrome using liquid chromatography-tandem mass spectrometry. Neurogastroenterol Motil 21: 734–e43, 2009 [DOI] [PMC free article] [PubMed] [Google Scholar]
- 15.Camilleri M, Shin A, Busciglio I, Acosta A, Burton D, Lamsam J, Lueke A, Donato L, Zinsmeister AR. Validating a biomarker for irritable bowel syndrome. Gastroenterology 146, Suppl 1: S119–S120, 2014 [DOI] [PMC free article] [PubMed] [Google Scholar]
- 16.Camilleri M, Vazquez-Roque MI, Carlson P, Burton D, Wong BS, Zinsmeister AR. Association of bile acid receptor TGR5 variation and transit in health and lower functional gastrointestinal disorders. Neurogastroenterol Motil 23: 995–999, e458, 2011 [DOI] [PMC free article] [PubMed] [Google Scholar]
- 17.Chadwick VS, Gaginella TS, Carlson GL, Debongnie JC, Phillips SF, Hofmann AF. Effect of molecular structure on bile acid-induced alterations in absorptive function, permeability, and morphology in the perfused rabbit colon. J Lab Clin Med 94: 661–674, 1979 [PubMed] [Google Scholar]
- 18.Colucci R, Gambaccini D, Ghisu N, Rossi G, Costa F, Tuccori M, De Bortoli N, Fornai M, Antonioli L, Ricchiuti A, Mumolo MG, Marchi S, Blandizzi C, Bellini M. Influence of the serotonin transporter 5HTTLPR polymorphism on symptom severity in irritable bowel syndrome. PLoS One 8: e54831, 2013 [DOI] [PMC free article] [PubMed] [Google Scholar]
- 19.Deiteren A, Camilleri M, Bharucha AE, Burton D, McKinzie S, Rao AS, Zinsmeister AR. Performance characteristics of scintigraphic colon transit measurement in health and irritable bowel syndrome and relationship to bowel functions. Neurogastroenterol Motil 22: 415–423, 2010 [DOI] [PMC free article] [PubMed] [Google Scholar]
- 20.Fukudo S, Kanazawa M, Mizuno T, Hamaguchi T, Kano M, Watanabe S, Sagami Y, Shoji T, Endo Y, Hongo M, Itoyama Y, Yanai K, Tashiro M, Aoki M. Impact of serotonin transporter gene polymorphism on brain activation by colorectal distention. Neuroimage 47: 946–951, 2009 [DOI] [PubMed] [Google Scholar]
- 21.Gälman C, Arvidsson I, Angelin B, Rudling M. Monitoring hepatic cholesterol 7alpha-hydroxylase activity by assay of the stable bile acid intermediate 7alpha-hydroxy-4-cholesten-3-one in peripheral blood. J Lipid Res 44: 859–866, 2003 [DOI] [PubMed] [Google Scholar]
- 22.Gonenne J, Esfandyari T, Camilleri M, Burton DD, Stephens DA, Baxter KL, Zinsmeister AR, Bharucha AE. Effect of female sex hormone supplementation and withdrawal on gastrointestinal and colonic transit in postmenopausal women. Neurogastroenterol Motil 18: 911–918, 2006 [DOI] [PubMed] [Google Scholar]
- 23.Gullikson GW, Cline WS, Lorenzsonn V, Benz L, Olsen WA, Bass P. Effects of anionic surfactants on hamster small intestinal membrane structure and function: relationship to surface activity. Gastroenterology 73: 501–511, 1977 [PubMed] [Google Scholar]
- 24.Hinds JP, Stoney B, Wald A. Does gender or the menstrual cycle affect colonic transit? Am J Gastroenterol 84: 123–126, 1989 [PubMed] [Google Scholar]
- 25.Hov JR, Keitel V, Laerdahl JK, Spomer L, Ellinghaus E, ElSharawy A, Melum E, Boberg KM, Manke T, Balschun T, Schramm C, Bergquist A, Weismüller T, Gotthardt D, Rust C, Henckaerts L, Onnie CM, Weersma RK, Sterneck M, Teufel A, Runz H, Stiehl A, Ponsioen CY, Wijmenga C, Vatn MH; Study Group IBSEN, Stokkers PC, Vermeire S, Mathew CG, Lie BA, Beuers U, Manns MP, Schreiber S, Schrumpf E, Häussinger D, Franke A, Karlsen TH. Mutational characterization of the bile acid receptor TGR5 in primary sclerosing cholangitis. PLoS One 5: e12403, 2010 [DOI] [PMC free article] [PubMed] [Google Scholar]
- 26.Jang JH, Rickenbacher A, Humar B, Weber A, Raptis DA, Lehmann K, Stieger B, Moritz W, Soll C, Georgiev P, Fischer D, Laczko E, Graf R, Clavien PA. Serotonin protects mouse liver from cholestatic injury by decreasing bile salt pool after bile duct ligation. Hepatology 56: 209–218, 2012 [DOI] [PubMed] [Google Scholar]
- 27.Kawamata Y, Fujii R, Hosoya M, Harada M, Yoshida H, Miwa M, Fukusumi S, Habata Y, Itoh T, Shintani Y, Hinuma S, Fujisawa Y, Fujino M. A G protein-coupled receptor responsive to bile acids. J Biol Chem 278: 9435–9440, 2003 [DOI] [PubMed] [Google Scholar]
- 28.Kim HJ, Camilleri M, Carlson PJ, Cremonini F, Ferber I, Stephens D, McKinzie S, Zinsmeister AR, Urrutia R. Association of distinct α2 adrenoceptor and serotonin-transporter polymorphisms associated with constipation and somatic symptoms in functional gastrointestinal disorders. Gut 53: 829–837, 2004 [DOI] [PMC free article] [PubMed] [Google Scholar]
- 29.Kumar S, Ranjan P, Mittal B, Ghoshal UC. Serotonin transporter gene (SLC6A4) polymorphism in patients with irritable bowel syndrome and healthy controls. J Gastrointestin Liver Dis 21: 31–38, 2012 [PubMed] [Google Scholar]
- 30.Lieu T, Jayaweera G, Bunnett NW. GPBA: a GPCR for bile acids and an emerging therapeutic target for disorders of digestion and sensation. Br J Pharmacol 171: 1156–1166, 2014 [DOI] [PMC free article] [PubMed] [Google Scholar]
- 31.Longstreth GF, Thompson WG, Chey WD, Houghton LA, Mearin F, Spiller RC. Functional bowel disorders. Gastroenterology 130: 1480–1491, 2006 [DOI] [PubMed] [Google Scholar]
- 32.Manabe N, Wong BS, Camilleri M, Burton D, McKinzie S, Zinsmeister AR. Lower functional gastrointestinal disorders: evidence of abnormal colonic transit in a 287 patient cohort. Neurogastroenterol Motil 22: 293–e82, 2010 [DOI] [PMC free article] [PubMed] [Google Scholar]
- 33.Maruyama T, Tanaka K, Suzuki J, Miyoshi H, Harada N, Nakamura T, Miyamoto Y, Kanatani A, Tamai Y. Targeted disruption of G protein-coupled bile acid receptor 1 (Gpbar1/M-Bar) in mice. J Endocrinol 191: 197–205, 2006 [DOI] [PubMed] [Google Scholar]
- 34.Odunsi ST, Camilleri M, McKinzie S, Burton D, Carlson P, Busciglio IA, Lamsam J, Singh R, Zinsmeister AR. Effects of chenodeoxycholate and a bile acid sequestrant, colesevelam, on intestinal transit and bowel function. Clin Gastroenterol Hepatol 8: 159–165, 2010 [DOI] [PMC free article] [PubMed] [Google Scholar]
- 35.Poole DP, Godfrey C, Cattaruzza F, Cottrell GS, Kirkland JG, Pelayo JC, Bunnett NW, Corvera CU. Expression and function of the bile acid receptor GpBAR1 (TGR5) in the murine enteric nervous system. Neurogastroenterol Motil 22: 814–825, 2010 [DOI] [PMC free article] [PubMed] [Google Scholar]
- 36.Rajagopal S, Kumar DP, Mahavadi S, Bhattacharya S, Zhou R, Corvera CU, Bunnett NW, Grider JR, Murthy KS. Activation of G protein-coupled bile acid receptor, TGR5, induces smooth muscle relaxation via both Epac- and PKA-mediated inhibition of RhoA/Rho kinase pathway. Am J Physiol Gastrointest Liver Physiol 304: G527–G535, 2013 [DOI] [PMC free article] [PubMed] [Google Scholar]
- 37.Rao AS, Camilleri M, Eckert DJ, Busciglio I, Burton DD, Ryks M, Wong BS, Lamsam J, Singh R, Zinsmeister AR. Urine sugars for in vivo gut permeability: validation and comparisons in irritable bowel syndrome-diarrhea and controls. Am J Physiol Gastrointest Liver Physiol 301: G919–G928, 2011 [DOI] [PMC free article] [PubMed] [Google Scholar]
- 38.Sauter GH, Münzing W, von Ritter C, Paumgartner G. Bile acid malabsorption as a cause of chronic diarrhea: diagnostic value of 7alpha-hydroxy-4-cholesten-3-one in serum. Dig Dis Sci 44: 14–19, 1999 [DOI] [PubMed] [Google Scholar]
- 39.Shin A, Camilleri M, Vijayvargiya P, Busciglio I, Burton D, Ryks M, Rhoten D, Lueke A, Saenger A, Girtman A, Zinsmeister AR. Bowel functions, fecal unconjugated primary and secondary bile acids, and colonic transit in patients with irritable bowel syndrome. Clin Gastroenterol Hepatol 11: 1270–1275, 2013 [DOI] [PMC free article] [PubMed] [Google Scholar]
- 40.Suenaert P, Bulteel V, Den Hond E, Hiele M, Peeters M, Monsuur F, Ghoos Y, Rutgeerts P. The effects of smoking and indomethacin on small intestinal permeability. Aliment Pharmacol Ther 14: 819–822, 2000 [DOI] [PubMed] [Google Scholar]
- 41.Swan C, Duroudier NP, Campbell E, Zaitoun A, Hastings M, Dukes GE, Cox J, Kelly FM, Wilde J, Lennon MG, Neal KR, Whorwell PJ, Hall IP, Spiller RC. Identifying and testing candidate genetic polymorphisms in the irritable bowel syndrome (IBS): association with TNFSF15 and TNFα. Gut 62: 985–994, 2013 [DOI] [PubMed] [Google Scholar]
- 42.Tagliacozzi D, Mozzi AF, Casetta B, Bertucci P, Bernardini S, Di Ilio C, Urbani A, Federici G. Quantitative analysis of bile acids in human plasma by liquid chromatography-electrospray tandem mass spectrometry: a simple and rapid one-step method. Clin Chem Lab Med 41: 1633–1641, 2003 [DOI] [PubMed] [Google Scholar]
- 43.Talley NJ, Phillips SF, Wiltgen CM, Zinsmeister AR, Melton LJ., III Assessment of functional gastrointestinal disease: the bowel disease questionnaire. Mayo Clin Proc 65: 1456–1479, 1990 [DOI] [PubMed] [Google Scholar]
- 44.Thompson WG. Gender differences in irritable bowel symptoms. Eur J Gastroenterol Hepatol 9: 299–302, 1997 [DOI] [PubMed] [Google Scholar]
- 45.Wald A, Van Thiel DH, Hoechstetter L, Gavaler JS, Egler KM, Verm R, Scott L, Lester R. Gastrointestinal transit: the effect of the menstrual cycle. Gastroenterology 80: 1497–1500, 1981 [PubMed] [Google Scholar]
- 46.Walters JR, Tasleem AM, Omer OS, Brydon WG, Dew T, le Roux CW. A new mechanism for bile acid diarrhea: defective feedback inhibition of bile acid biosynthesis. Clin Gastroenterol Hepatol 7: 1189–1194, 2009 [DOI] [PubMed] [Google Scholar]
- 47.Watanabe H, Akasaka D, Ogasawara H, Sato K, Miyake M, Saito K, Takahashi Y, Kanaya T, Takakura I, Hondo T, Chao G, Rose MT, Ohwada S, Watanabe K, Yamaguchi T, Aso H. Peripheral serotonin enhances lipid metabolism by accelerating bile acid turnover. Endocrinology 151: 4776–4786, 2010 [DOI] [PubMed] [Google Scholar]
- 48.Wedlake L, A'Hern R, Russell D, Thomas K, Walters JR, Andreyev HJ. Systematic Review: the prevalence of idiopathic bile acid malabsorption as diagnosed by SeHCAT scanning in patients with diarrhoea-predominant irritable bowel syndrome. Aliment Pharmacol Ther 30: 707–717, 2009 [DOI] [PubMed] [Google Scholar]
- 49.Wong BS, Camilleri M, Carlson P, McKinzie S, Busciglio I, Bondar O, Dyer RB, Lamsam J, Zinsmeister AR. Increased bile acid biosynthesis is associated with irritable bowel syndrome with diarrhea. Clin Gastroenterol Hepatol 10: 1009–1015, 2012 [DOI] [PMC free article] [PubMed] [Google Scholar]
- 50.Wong BS, Camilleri M, Carlson PJ, Guicciardi ME, Burton D, McKinzie S, Rao AS, Zinsmeister AR, Gores GJ. A klothoβ variant mediates protein stability and associates with colon transit in irritable bowel syndrome with diarrhea. Gastroenterology 140: 1934–1942, 2011 [DOI] [PMC free article] [PubMed] [Google Scholar]
- 51.Yuan J, Kang C, Wang M, Wang Q, Li P, Liu H, Hou Y, Su P, Yang F, Wei Y, Yang J. Association study of serotonin transporter SLC6A4 gene with Chinese Han irritable bowel syndrome. PLoS One 9: e84414, 2014 [DOI] [PMC free article] [PubMed] [Google Scholar]
- 52.Zhang ZF, Duan ZJ, Wang LX, Yang D, Zhao G, Zhang L. The serotonin transporter gene polymorphism (5-HTTLPR), and irritable bowel syndrome: a meta-analysis of 25 studies. BMC Gastroenterol 14: 23–34, 2014 [DOI] [PMC free article] [PubMed] [Google Scholar]
- 53.Zigmond AS, Snaith RP. The hospital anxiety and depression scale. Acta Psychiatr Scand 67: 361–370, 1983 [DOI] [PubMed] [Google Scholar]
- 54.Zucchelli M, Camilleri M, Nixon Andreasson A, Bresso F, Dlugosz A, Halfvarson J, Törkvist L, Schmidt PT, Karling P, Ohlsson B, Duerr RH, Simren M, Lindberg G, Agreus L, Carlson P, Zinsmeister AR, D'Amato M. Association of TNFSF15 polymorphism with irritable bowel syndrome. Gut 60: 1671–1677, 2011 [DOI] [PMC free article] [PubMed] [Google Scholar]