

Abstract
The dosimetric accuracies of CATPhan 504 and CIRS 062 have been evaluated using the kV-CBCT of Varian TrueBeam linac and Eclipse TPS. The assessment was done using the kV-CBCT as a standalone tool for dosimetric calculations towards Adaptive replanning. Dosimetric calculations were made without altering the HU-ED curves of the planning computed tomography (CT) scanner that is used by the Eclipse TPS. All computations were done using the images and dataset from kV-CBCT while maintaining the HU-ED calibration curve of the planning CT (pCT), assuming pCT was used for the initial treatment plan. Results showed that the CIRS phantom produces doses within ±5% of the CT-based plan while CATPhan 504 produces a variation of ±14% of the CT-based plan.
Keywords: Adaptive radiotherapy, adaptive replanning, cone beam CT, hounsfield units
Introduction
The choice of phantom, which is used for quality assurance (QA) of a linac with an on-board Cone Beam CT (CBCT), is determined by the linac manufacture's recommendation. While some phantoms may give desirable QA results, it cannot be concluded to be accurate in terms of dosimetric calculations. CBCT dosimetry has been underutilized due to the overdependence of CT images for treatment planning and dosimetric calculations. CBCT has been used to perform dose-of-the day computations but was dependant on dedicated research software for image registration.[1,2,3,4] CATPhan and CIRS phantoms have been confined to Quality Assurance purposes, therefore, the possibility of using those phantoms as part of dosimetric calculations have been overlooked.
Studies have shown an almost perfect correlation of 0.999 between CBCT and Planning CT (pCT), where dosimetric calculations were performed on linear accelerators with monitor units (MU) between 5 and 60.[1] pCT-kVCBCT Calibration curves have been observed to be very stable over a period of eight consecutive weeks.[2,3] Various image correction methods have been used, and dose variations observed to be in the range −0.23-0.69% of pCT doses.[4]
Successful results were obtained where site-specific and parameter-specific Hounsfield Unit to Electron Density (HU-ED) calibrations were performed, and also where population-based calibrations have been performed.[1,5,6]
Because the result of dose calculation accuracy in an inhomogeneous phantom is affected by the accuracy of CT number, it is important to know its uncertainties before the patient CBCT images are used for dosimetric calculations.[7,8,9] Also, it has been reported that HU values increase for inserts with relative electron densities greater than 1.0 and decrease for the lower density inserts.[8]
Observations from existing work show that: (1) Accurate results were obtained where phantom scan and calibration curves were generated by the same acquisition and reconstruction parameters, without necessarily using clinical parameters; (2) While population-based HU-D calibration curves have also proved to provide accurate doses, there is a statistical possibility of influence of outliers from patient body sizes that may affect the results; (3) Phantom inserts used for calibrations may also affect the calibration because the materials provided by the suppliers may not be true reflections of the densities of the equivalent tissues in the human body.
Computational methods have been suggested for image registration and image reconstruction of CBCT images for adaptive radiotherapy, but those suggestions have also not eliminated the overdependence of dedicated research software and have also been silent to address the question of the possibility of replanning using CBCT images directly.[4,10,11,12]
While some of the methods required dedicated research software and sophisticated correction methods, it can also be said that not every TPS may able to create individual HU-ED calculation curves.[4,6]
This work assesses the dosimetric accuracies of the CATPhan 504 and CIRS phantoms. The use of dedicated research software for deformable or rigid image registration such as NifTy™ will be avoided, except for the software which has already been incorporated into the TPS and the linac. In an attempt to directly use CBCT images for dosimetric calculations as part of the on-line Adaptive Radiotherapy process, the TrueBeam linac was used. The following assessment criteria were used:
Accuracy of the HU of CBCT of the two phantoms
Correlation between pCT and cone beam CT, and how it translates into dose
Consistency of the HU from the CBCT of the Trubeam using the two phantoms
Can Electron Density Curves of pCT and CBCT be used without the need for individual calibration curves? How will the dosimetric distribution differ from CT-based calculations, considering each phantom?
Materials and Methods
GE Light Speed CT scanner for Planning CT (pCT)
Varian TrueBeam linac as kV-CBCT
Eclipse Treatment Planning System
CATPhan 504 (insert: Air, Water, Acrylic, Delrin, PMP, LDPE, Teflon and Polystyrene)
CIRS model 062 with insert: Adipose, Breast 50/50, Muscle, Liver, Water, Lung (inhale), lung (exhale), Trabecular Bone, Dense Bone.
The kV-CBCT images were calibrated using pCT as reference HU. Dosimetric calculations were performed on the images acquired on both pCT and kV-CBCT. Single fraction doses were prescribed to targets in both image sets, and point dose calculations were determined using the same fields and monitor units. This was used to assess the dosimetric accuracies of the phantoms.
All acquisition parameters used in the work were selected based on the site-specific clinical parameters. Scanning parameters used on the CT were 120 kV, 220 mA, and slice thickness of 2.5 mm. On kV-CBCT, the parameters used were 125 kV, 254 mAs with half fan beam mode.
The following procedure was followed:
Insert materials (sensitometry targets) of specified physical densities were placed in specific locations in the phantoms. These specific locations were maintained during the period of experiments
The phantoms were aligned in a clinical position using the same isocenter as done when scanning patients. All positioning verification checks were taken into consideration
Scanned images of the phantoms were acquired and compared, that is CT and kV-CBCT
The HU values obtained were used to establish the relationship between the different Physical Densities (D), Electron Densities (ED) and their corresponding CT number in Hounsfield units
A calibration curve was plotted from the results
Detailed interpretation of the results using the CT scanner as a reference.
Calibration
The kV-CBCT HU was calibrated using the CT HU as a reference. The calibration was performed using both CATPhan 504 and CIRS model 062 phantoms. During this procedure, the phantoms were set up on the couch with isocenters marked on each phantom. Reference lasers were used for image positioning. Scanning parameters of 120 kV, 220 mA, and slice thickness of 2.5 mm were used on the CT scanner for both phantoms. On kV-CBCT, scanning parameters of 125 kV, 254 mAs were selected. These parameters were selected to match the clinical practice. Scans were performed first on CT and then performed on kV-CBCT on the same day. Circular regions of interest (ROI) of area 502.45 mm2 were selected for the sensitometry targets after the scan and HU values recorded. For dense bone, ROI of 38.05 mm2 was selected to measure the center area. Each ROI selected for the HU measurement was less than the physical area of the insert materials, with a 1-mm margin between the physical radius and the radius of the area of interest.[11] An equivalent square area was selected on the TrueBeam kV-CBCT during online review. The HU of pCT were plotted against the HU of kV-CBCT. After obtaining pCT-CBCT calibration curves, HU to Physical Density (HU-D) and HU to Electron Density (HU-ED) were also plotted to compare the pCT and kV-CBCT curves for variations on physical density and electron density. Figure 1 shows how ROI was selected on each CT image.
Figure 1.
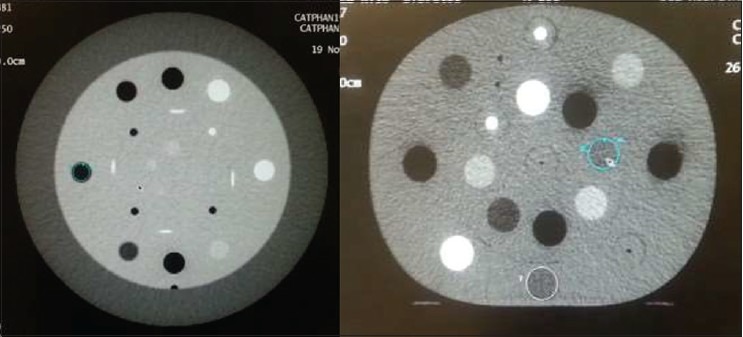
Selection of ROI on CATPhan (left); and CIRS (right) to measure HU. A circular ROI was selected to measure HU of the sensitometry targets in each phantom
Results and Discussion
Figures 2 and 3 show pCT - CBCT calibration curves obtained from both phantoms. The curve in Figure 2 represents the dataset from CATPhan 504 phantom. Figure 3 represents the curve obtained from the dataset of the CIRS phantom.
Figure 2.
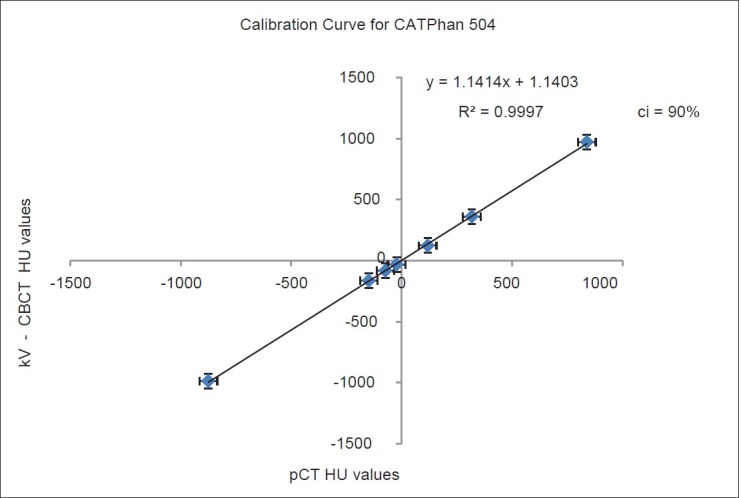
kV-CBCT plotted against pCT for CATPhan 504. The mean values of HU were plotted. The graph shows a linear correlation between pCT and kV-CBCT HU values
Figure 3.
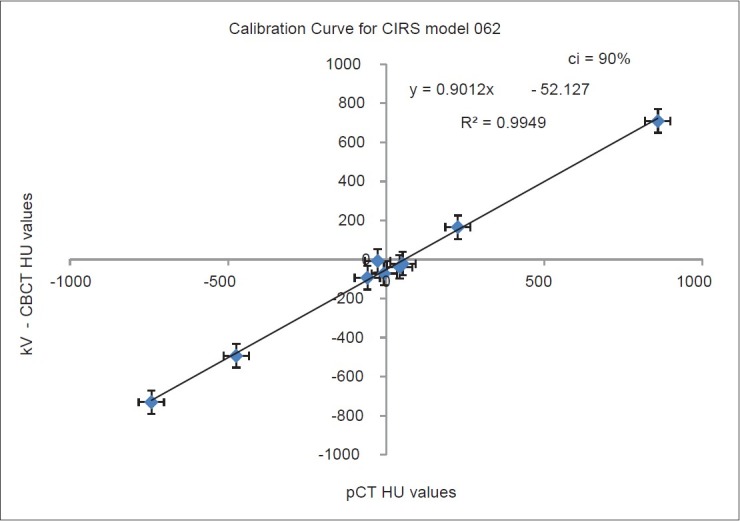
kV-CBCT plotted against pCT for CIRS model 062. The mean values of HU were plotted. The graph shows a linear correlation between the pCT and kV-CBCT HU values
Calibration curves
Variation of hounsfield units
Using the CATPhan 504 phantom, HU values obtained from CT scan showed that the overall standard deviations ranging from a minimum of 3.01 for Acrylic, which had a mean HU of 118.5. The maximum standard deviation observed was 44.61, which was recorded for the HU values of Air with a mean HU value of −874.59.
Values obtained from kV-CBCT, however, yielded overall standard deviations with a minimum of 11.35 for polystyrene, and a maximum of 32.70 for teflon, with mean HU values of −32.26 and 972.17, respectively. Though there was a linear correlation between the HU values for CT and kV-CBCT, overall, there was no correlation between their responses to the individual sensitometry targets. They varied across all the targets even though the results for kV-CBCT were quite consistent.
On CT, the CIRS model 062 yielded an overall minimum standard deviation of 2.24 for breast 50/50 sensitometry target with a mean HU value of −26.30 and a maximum standard deviation of 32.32 on dense bone with a mean HU value of 864.98.
Results of the same phantom on kV-CBCT showed a minimum standard deviation of 6.62 for breast 50/50 with a mean HU value of −7.41 and also a maximum of 46.06 for dense bone with a mean HU value of 709.31, thus repeating the trend observed on CT scanner. The overall results of obtained from CIRS phantom showed that kV-CBCT HU were also very consistent. Figures 4–8 show Physical Density and Electron Density curves for both phantoms. The Physical density curves for the CATPhan phantom are shown in Figures 4 and 5. Figure 5 shows the curves for both CT and TrueBeam linac.
Figure 4.
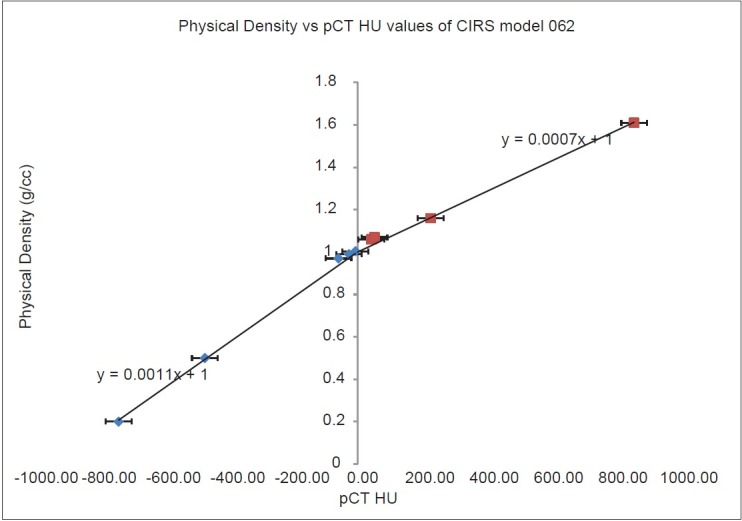
Bi-linear gradient for HU-Physical Density curve for CIRS. The curve has a linear gradient for negative HU values, and also a linear gradient for all positive HU values. This was observed on the HU values measured on pCT images
Figure 8.
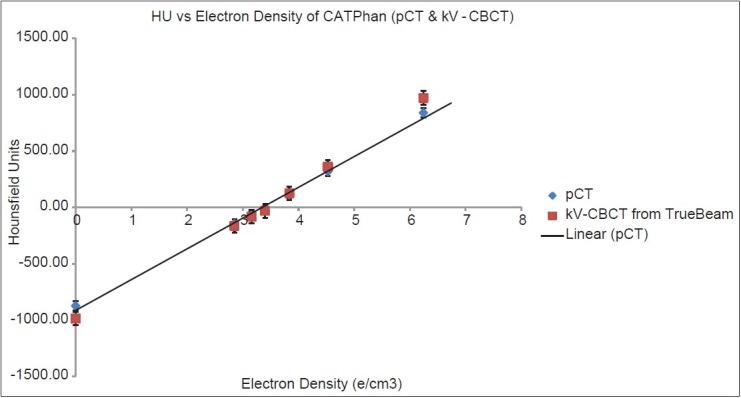
HU vs Electron Density for CATPhan 504. The diamond shapes represent the plot for pCT, while the square shapes represent the plot for the Trubeam linac. The values overlap for LDPE, PMP, Acrylic, Delrin and Polystyrene. Air and Teflon were out of the of range ± 40 HU
Figure 5.
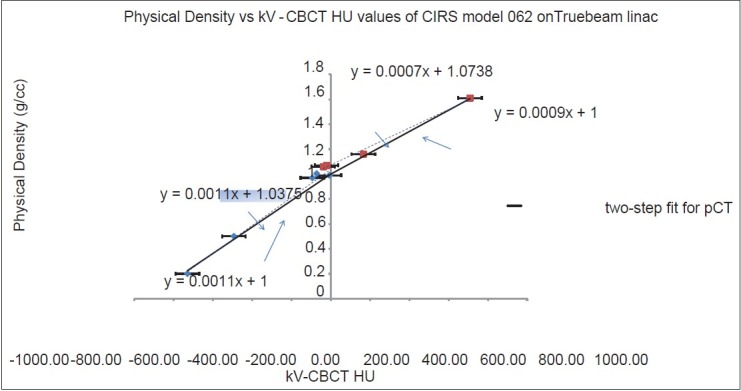
Bi-linear gradient for HU-Physical Density curve for CIRS. The solid lines show the bi-linear fit for the kV-CBCT HU-Density curve. However, the true behavior of the curve is represented in the broken lines
The Electron density curve in Figure 5 is similar to Relative Electron Density (RED) curve in Figure 7 which is required by treatment planning systems to perform computations. Though, the curves usually appear to be similar, they have different intercepts on the horizontal axis. The behavior of an ED curve predicts the RED curve. Figures 6 and 8 show the electron density curves for both phantoms. Figure 6 is for the CIRS phantom and Figure 8 is for the CATPhan.
Figure 7.
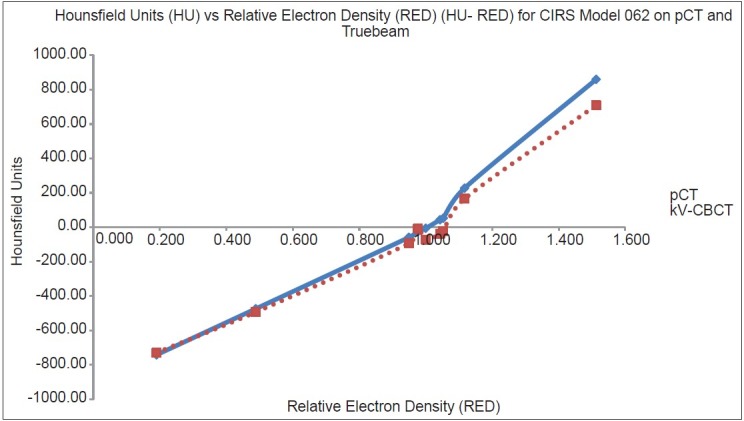
HU vs Relative Electron Density (HU-RED) for CIRS. The solid line represents the plot for pCT, while the broken line represents the plot for the Trubeam linac
Figure 6.
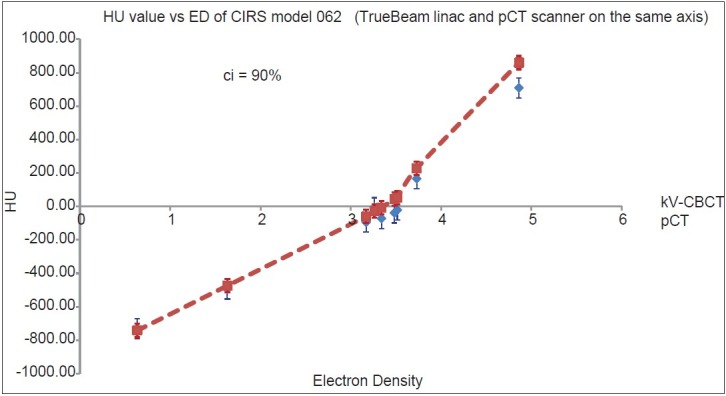
HU-ED for the CIRS model 062. The red line is the HU-ED curve for pCT while the diamonds represent the values from the TrueBeam linac. Taking the error margins into consideration, the curves overlap except for dense bone which falls out of the range of ±40 HU
Accuracy, linearity, and correlation between pCT and kV-CBCT
The linear responses of Figures 2 and 3 indicate that kV-CBCT source from the TrueBeam linac were very predictable due to its linearity in response. Responses from both CT and kV-CBCT also show that the Hounsfield units of kV-CBCT were very consistent. The error margins on the graphs were plotted with 90% confidence interval. A linear response to the curve suggests that an extrapolation or interpolation can be made from the curve to account for any HU values that have not been recorded. The stability of the kV-CBCT calibration curve was also investigated over a period of three consecutive months and was very found to be very stable.
The HU values obtained from kV-CBCT have linear correlations, but accuracy could not be established at lower Hounsfield units for all sensitometry targets of the CIRS phantom. The CATPhan, however, produced accurate values between the two HU datasets, that is, pCT and CBCT.
On the CIRS phantom, lung (exhale), lung (inhale), dense bone, trabecular bone, water, adipose, and breast had positive calibration factors, which but only lung (exhale) and lung (inhale) produced accurate kV-CBCT HU values with respect to the planning CT. Dense bone and trabecular bone both showed positive correlations with lower kV-CBCT HU values. It was also observed that for the targets with physical densities between 0.97 g/cm3 and 1.07 g/cm3 or with their corresponding ED of 3.17 e/cm3 and 3.516 e/cm3, it was not possible to predict the correlation between the Hounsfield units from CT and the linac.
Consistency and variation of HU for sensitometry targets
It was observed that the HU values of the two phantoms were very consistent. Though the values of the CIRS phantom fluctuated for breast 50/50, the values were quite consistent for the other sensitometry targets. The trend of consistency observed was that HU values from the linac were more stable at HU values greater than 100 HU. Occasional outliers were also observed within the dataset. Standard deviations of the dataset were below 25% except for dense bone, which had a standard deviation of 46.06%.
For the CIRS phantom, the variation of Hounsfield units of the dataset obtained on the CT scanner had a relatively smaller standard deviation than the dataset of values from the TrueBeam linac, therefore indicating a consistent and reliable result of the measurement. kV-CBCT also recorded very low Hounsfield units with high-density targets, yet the scatter contribution also made it unreliable with the relatively low electron-density sensitometry targets.
Very large variations in the Hounsfield units can cause problems with the interpretation of readings in the Treatment Planning System during a calibration. For breast 50/50, adipose, and water, the values fluctuate between negative HU and positive HU on kV-CBCT. The geometry of the phantom also influences the HU of the sensitometry target because it was observed that targets within the inner rings of the CIRS phantom yielded larger HU values compared to the same targets that were on the outer rings. In the human body, the targets are also not positioned on the surface; therefore, the extrapolation of the results to humans may result in dosimetric miscalculations.
HU-ED curves
CT was used as a reference in this case and the curve obtained from the TrueBeam linac was compared to it. IPEM report 91[10] recommends a ± 10 Hounsfield Units in all other targets but a ±5 HU variation in water for CT quality assurance purposes. This is stated for scans in which the CIRS phantom is used for quality assurance. The manufacturers' variations recommended for kV-CBCT is ±40 HU.
Figure 6 shows the kV-CBCT plot. The solid line is a linear fit for CT with an intercept of 1 on the vertical axis. While the linear fit for the CT shows an acceptable gradient for QA purposes, the broken line shows the actual behavior of the curve. It is evident that at low Hounsfield units, the scatter contribution is very significant. This has an impact on tissues with low physical densities. The targets affected by these scatter contributions were adipose, breast 50/50, water, muscle, and liver with physical densities of 0.97-1.09 g/cc.
Figure 7 shows the behavior of HU-RED curves for both scanning devices. At very low Hounsfield Units, the scatter contribution was very prominent in the kV-CBCT image. This affects the adipose, breast 50/50, liver, muscle, and water sensitometry targets, hence not giving a very reliable interpretation of the Hounsfield Units measured.
All results from the CATPhan phantom gave a clear distinction between each insert material and are shown in Figure 8. However, teflon and air were observed to be out of range of the recommended variations. While CATPhan produces very linear and accurate kV-CBCT responses that matched CT responses, the insert materials in the phantom do not reflect the tissues in the human body; therefore, the results may be accurate for QA purpose but in case of actual patients, it has very little representation.
Possible sources of errors
The following areas were considered to be possible sources of errors:
Linac Couch setup: The couches for CT and TrueBeam linac are very different and therefore may contribute to setup errors. This may affect the geometry of the acquired images during reconstruction and affect the recorded HU values. While CT was used as a reference for kV-CBCT, it was observed that the gantry rotating around the couch could contribute to a slight offset of the positioned phantom. Linac calibrations are performed after they have been in use over a period of time; thus, its regular use could generate a drift, generating an error in geometry. This may also go on to affect the isocenter of the setup during image acquisition and contribute to of the error observed in the HU values of the linac
Phantom positioning: Since CT and linac were in different rooms, position verification devices could be offset from the set-up on the CT. While on CT couch, the isocenters for both phantoms were clearly marked; therefore, there was no need for the couch to be repositioned vertically. However, on the couch of the linac, it was observed that the isocenter of the CIRS phantom was achieved at a 13 cm but had to be adjusted by 0.2 cm to attain the same marked isocenter on CATPhan. It was clearly evident that the positioning of the phantoms was another source of error which could also affect the results. This means that though the phantom may be in FOV of the kV-CBCT scanner, the SAD at which the image is acquired may vary.
Dosimetric accuracy
While the phantoms used in this work are often confined to QA purposes, the assessment was done to investigate their dosimetric accuracies due to the dominance of the Rando phantom in dosimetric evaluations.
Dosimetric calculations were performed on Eclipse TPS using both CT and kV-CBCT images. The calculations were done without any corrections or modifications to the HU-ED calibration curve in TPS. Therefore, all calculations were based on the pCT HU-ED calibration curve. Dose/MU calculations were also performed to determine the variations in accuracy of the prescribed doses delivered to the phantoms, with respect to their pCT- and CBCT-based images.
Single dose fractions were prescribed to targets in both image sets, and point dose contribution was determined for each field. For each phantom, the static fields from the 6MV TrueBeam linac was copied from the pCT-based plan and transferred unto the kV-CBCT image for the dose calculations. Doses on pCT-based plans were compared to the doses on the CBCT-based plans of both phantoms.
The dose per MU for plans based on CATPhan was consistent in both CT- and CBCT-based plans. For MU between 9500 and 50500 and single doses of 500 Gy, 800 Gy, 1000 Gy, 1500 Gy, 2000 Gy, and 2500 Gy, the ratio of dose to MU were calculated to study the variations for each prescribed dose.
On CATPhan
pCT-based doses to CATphan were 500.200 Gy, 799.536 Gy, 1000.031 Gy, 1499.813 Gy, 2005.596 Gy, and 2503.102 Gy for prescribed doses of 500 Gy, 800 Gy, 1000 Gy, 1500 Gy, 2000 Gy, and 2,500 Gy, respectively.
The corresponding doses on kV-CBCT-based doses were 570.933 Gy, 913.492 Gy, 1141.618 Gy, 1711.512 Gy, 2279.614 Gy, and 2854.663 Gy, respectively. Figure 9 shows a screenshot of the treatment plan.
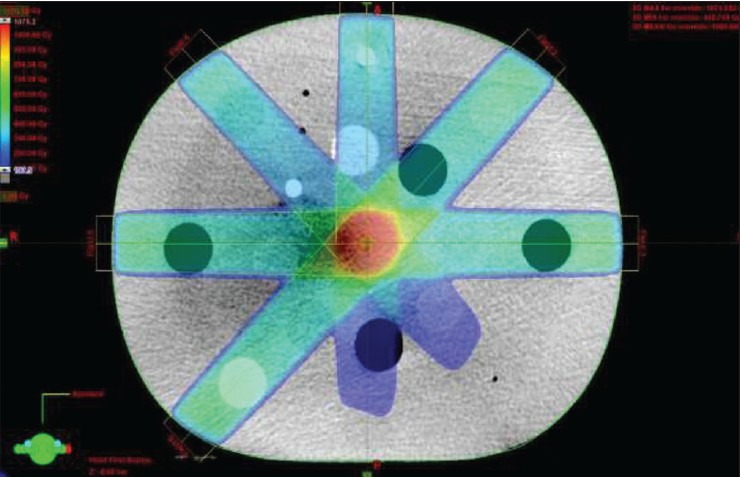
Figure 9.
CATPhan CT image with dose prescribed to the center of the phantom
For CT-based plans, D/MU for 500 Gy, 800 Gy, 1000 Gy, 1500 Gy, 2000 Gy, and 2,500 Gy were 0.00721, 0.00720, 0.00722, 0.00721, 0.00722, and 0.00722, respectively. The corresponding D/MU for the kV-CBCT-based plans was 0.00713, 0.00716, 0.00716, 0.00716, 0.00715, and 0.00716, respectively. Figure 10 shows a screenshot of the treatment plan
Figure 10.

kV-CBCT image with dose prescribed to the center of the phantom
On CIRS
pCT-based doses to the CIRS phantoms were 499.996 Gy, 800.046 Gy, 1000.080 Gy, 1499.668 Gy, 2002.965 Gy, and 2499.998 Gy for prescribed doses of 500 Gy, 800 Gy, 1000 Gy, 1500 Gy, 2000 Gy, and 2,500 Gy, respectively.
The corresponding doses on the kV-CBCT-based doses were 521.228 Gy, 836.416 Gy, 1048.286 Gy, 1571.815 Gy, 2090.128 Gy and 2616.250 Gy respectively.
The CT-based plans produced D/MU of 0.00595, 0.00595, 0.00595, 0.00594, 0.00595, and 0.00594 for the respective doses prescribed in ascending order.
The corresponding values for the kV-CBCT-based plans were 0.00592, 0.00592, 0.00591, 0.00592, 0.00592, and 0.00592, respectively. The treatment plan is shown in Figure 11.
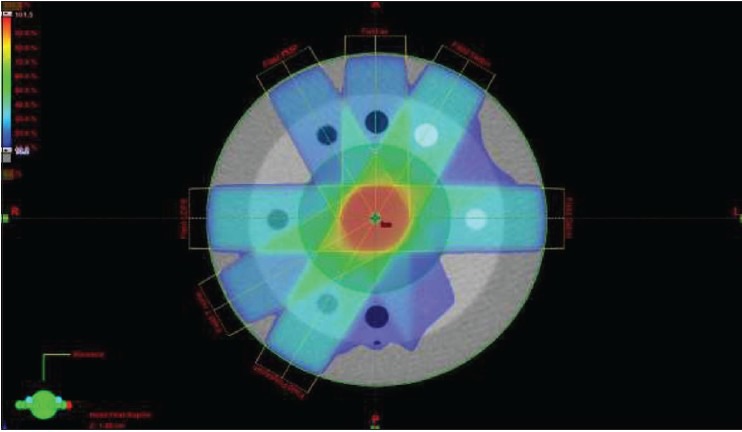
Figure 11.
CIRS kV-CBCT image with 1000Gy prescribed to PVT at the center of the phantom
The dosimetric studies showed a variation of ±14% of the pCT-based dose using CATPhan phantom and the CT calibration curve. The CIRS, however, produced results within ±5% of the prescribed dose, which was the pCT-based dose, using the CT calibration curve.
Conclusion
There is a near-perfect linear correlation between CT and CBCT for HU values produced from both phantoms. The acceptable margin of ±40 Hounsfield Units can be achieved from the TrueBeam linac on a daily basis with 90% confidence interval, irrespective of the phantom used. The ED-HU curves from kV-CBCT dataset indicate that TPS can accurately interpret the sensitometry target information required to make dosimetric computations from both phantoms. It successfully makes a distinction between each target, notwithstanding the effect of scatter at low HU values on CIRS. The CIRS phantom is reliable for calibrations for performing daily replans due to the geometric distribution of the sensitometry targets within the phantom and for its dosimetric accuracy. Dosimetric calculations obtained from the images acquired using TrueBeam linac show doses with variations within ±5% of the CT-based plans, using the CIRS phantom. This concludes that while the CATPhan phantom produces linear responses and produces highly accurate and consistent HU values on CBCT, it does not provide accurate dosimetric values due to the ±14% variation.
Acknowledgment
The authors wish to thank Mr. Derek D'Souza of UCLH Radiotherapy Physics, staff of Harley Street Clinic (HCA at ULCH), the Staff of UCLH Radiotherapy Physics Department, all CT and Linac radiographers at UCLH, and the Head of Radiotherapy Services at UCLH.
Footnotes
Source of Support: Nil.
Conflict of Interest: None declared.
References
- 1.Hughes J, Holloway LC, Quinn A, Fielding A. An investigation into factors affecting electron density calibration for a megavoltage cone-beam CT system. J Appl Clin Med Phys. 2012;13:3271. doi: 10.1120/jacmp.v13i5.3271. [DOI] [PMC free article] [PubMed] [Google Scholar]
- 2.Poludniowski GG, Evans PM, Webb S. Cone beam computed tomography errors and consequences for radiotherapy planning: An investigation of correction methods. Int J Radiat Oncol Biol Phys. 2012;84:e109–14. doi: 10.1016/j.ijrobp.2012.02.019. [DOI] [PubMed] [Google Scholar]
- 3.Yang Y, Schreibmann E, Li T, Wang C, Xing L. Evaluation of on-board kV cone beam CT (CBCT)-based dose calculation. Phys Med Biol. 2007;52:685–705. doi: 10.1088/0031-9155/52/3/011. [DOI] [PubMed] [Google Scholar]
- 4.van Zijtveld M, Dirkx M, Heijmen B. Correction of cone beam CT values using a planning CT for derivation of the “dose of the day”. Radiother Oncol. 2007;85:195–200. doi: 10.1016/j.radonc.2007.08.010. [DOI] [PubMed] [Google Scholar]
- 5.Fotina I, Hopfgartner J, Stock M, Steininger T, Lütgendorf-Caucig C, Georg D. Feasibility of CBCT-based dose calculations: Comparative analysis of HU adjustment techniques. Radiother Oncol. 2012;104:249–56. doi: 10.1016/j.radonc.2012.06.007. [DOI] [PubMed] [Google Scholar]
- 6.Richter A, Hu Q, Steglich D, Baier K, Wilbert J, Guckenberger M, et al. Investigation of the usability of cone beam CT data sets for dose calculation. Radiat Oncol. 2008;3:42. doi: 10.1186/1748-717X-3-42. [DOI] [PMC free article] [PubMed] [Google Scholar]
- 7.Ding GX, Duggan DM, Coffey CW, Deeley M, Hallahan DE, Cmelak A, et al. A study on adaptive IMRT treatment planning using kV cone-beam CT. Radiother Oncol. 2007;85:116–25. doi: 10.1016/j.radonc.2007.06.015. [DOI] [PubMed] [Google Scholar]
- 8.Hatton J, McCurdy B, Greer PB. Cone beam computerized tomography: The effect of calibration of the Hounsfield unit number to electron density on dose calculation accuracy for adaptive radiation therapy. Phys Med Biol. 2009;54:N329–46. doi: 10.1088/0031-9155/54/15/N01. [DOI] [PubMed] [Google Scholar]
- 9.ICRU-50, International Commission on Radiation Units and Measurements “Prescribing, recording, and reporting photon beam therapy”. Bethesda, MD, USA: 1993. [Google Scholar]
- 10.IPEM report no. 91; Institute of Physics and Engineering in Medicine “Recommended Standards for the Routine Performance Testing of Diagnostic X-Ray Imaging Systems” IPEM. York, UK: 2005. ISBN 1-903613-24-8. [Google Scholar]
- 11.Mail TB. Catphan 500 and 600 Manual, The Phantom Laboratory, Inc. Greenwich, UK, USA: 2006. p. 17. [Google Scholar]
- 12.Veiga C, McClelland J, Moinuddin S, Lourenço A, Ricketts K, Annkah J, et al. Toward adaptive radiotherapy for head and neck patients: Feasibility study on using CT-to-CBCT deformable registration for “dose of the day”. Med Phys. 2014;41:031703. doi: 10.1118/1.4864240. [DOI] [PubMed] [Google Scholar]