

Abstract
Proper gene regulation is essential for proper organismal development and appropriate responses to external stimuli. Specialized factors, termed master regulators, are often responsible for orchestrating the molecular events that result from signaling cascades. Master regulators coordinate the activation and repression of specific gene classes. Estrogen receptor α (ER) precipitates the signaling cascade that results from endogenous or exogenous estrogen hormones. ER is a classic transcriptional activator and the mechanisms by which ER coordinates gene activation are well characterized. However, it remains unclear how ER coordinates the immediate repression of genes. We integrated genomic transcription, chromosome looping, transcription factor binding, and chromatin structure data to analyze the molecular cascade that results from estradiol (E2)-induced signaling in human MCF-7 breast cancer cells and addressed the context-specific nature of gene regulation. We defined a class of genes that are immediately repressed upon estrogen stimulation, and we compared and contrasted the molecular characteristics of these repressed genes vs activated and unregulated genes. The most striking and unique feature of the repressed gene class is transient binding of ER at early time points after estrogen stimulation. We also found that p300, a coactivator and acetyltransferase, quantitatively redistributes from non-ER enhancers to ER enhancers after E2 treatment. These data support an extension of the classic physiological squelching model, whereby ER hijacks coactivators from repressed genes and redistributes the coactivators to ER enhancers that activate transcription.
In the absence of chromatin, local binding of activators and repressors drives gene activation and repression in prokaryotes (1, 2). However, transcription factor (TF) binding to local genes is neither necessary nor sufficient to direct changes in transcription in eukaryotes. The context-dependent rules of transcription activation and repression remain elusive; however, the development of unbiased genomic approaches promises to provide insight into the mechanisms of TF action. Previous studies have shown that the basic principles of gene regulation are often shared between TFs. For instance, insulators, defined by their ability to insulate local genes from the activating and repressing properties of TFs, are ubiquitous modifiers of TF activity (3). We have previously found that the presence of insulators at activator-bound genes may abrogate the activation potential of the gene (4). More recent work has shown that the spatial orientation of insulators, relative to the activator binding site and transcriptional start site, is a critical factor that determines whether a gene is activated (5). Of note, the core promoter elements may also contribute to the specificity of TF-mediated activation. For instance, caudal specifically activates genes that contain the downstream promoter element as opposed to the TATA box (6). Recent work has shown that both the TATA element and pause button element correlate with the presence of paused RNA polymerase II (PolII) (7). Moreover, disruption of paused PolII proximal elements disrupts 5′ PolII distribution, and the disruption of a paused PolII abrogates heat shock factor-induced transcription of heat shock–inducible genes (8). The presence and absence of other ancillary TFs are also important for proper regulatory control of genes. For instance, the presence of GAGA-associated factor at heat shock–inducible genes is important for full gene activation (9). The hypoxia-inducible factor also requires the binding sites for HNF4, AP-1, GATA2, and ETS (10–12). In these cases, the binding of the master regulators (heat shock factor and hypoxia-inducible factor) may be compromised in the absence of these factors (for a review, see Ref. 13).
The mechanism by which activators repress genes remains more poorly understood. A recent study of GATA1-induced erythroid differentiation revealed that unique combinations of TFs present at genes before to GATA1 induction predetermine the gene expression fate upon differentiation. For instance, the interplay of GATA1 and an auxiliary TF, TAL1, is a major determinant of induction vs repression (14). The co-occupancy of GATA1 and TAL1 accounts for positive changes in gene expression; however, a common feature of repressed genes is that TAL1 is lost. This suggests that TAL1 redistributes from repressed genes to active genes upon differentiation, consistent with a model whereby factors are sequestered from their targets, in a process called physiological squelching (15–19), and redistributed to activated genes (20). One of the first reports to show that transcription factors compete for common cofactors showed that estrogen receptor α (ER) abrogated the activation potential of other nuclear receptors in a ligand and ER dose–dependent manner (15). Recently, genomic analyses suggested that ER stimulation can cause the cofactor steroid receptor coactivator (SRC)-3 to redistribute from Forkhead box protein A1 sites to ER binding sites; however, this study did not look at the expression changes associated with SRC-3 redistribution (21). Herein, we expand upon this physiological squelching model to show that transient ER binding associates with repressed genes and that a critical cofactor, p300, quantitatively redistributes upon estrogen treatment.
TFs interface with coactivators to mediate changes in gene expression. Generally, coactivators can bridge interactions with the general transcriptional machinery or modulate the chromatin landscape to influence downstream TF binding and gene activation. Many transcription cofactors are common to a wide range of transcriptional activators. Two of the most promiscuous and ubiquitous coactivators are the acetyltransferase p300 and its paralog, cAMP response element-binding protein (CREB)–binding protein (CBP). Both CBP and p300 have 4 distinct protein-protein interaction domains that physically interact with a diverse set of TFs, from nuclear receptors, from hydrophobic or acidic activation domains, and from components of the basal transcription machinery (22). Moreover, p300 is an epigenetic reader protein, with the ability to interact with methylated and acetylated histones and other proteins via its PHD domain and bromodomains, respectively (23–25). Upon recruitment to chromatin, p300 acts primarily to acetylate proteins, namely histones, to enhance transcription or facilitate TF binding (26). CBP and p300 are essential proteins, and even haploinsufficiency of one paralog or the other causes chronic diseases such as Rubinstein-Taybi syndrome (27) and a predisposition for non-Hodgkin lymphoma (28). The dose-dependent effects of limiting p300/CBP can be rescued by reintroduction or overexpression of the proteins (29–32). Both p300 and CBP have been studied extensively in the context of ER-mediated chromatin changes and transcription (33–35). Here, we examine the genomic distribution of ER and p300 before and after estrogen treatment and examine the negative role that p300 may play in the estradiol (E2)-mediated signaling cascade.
Materials and Methods
Chromatin immunoprecipitation (ChIP) sequencing (seq)
ER ChIP was performed as described previously (36) with minor modifications. In short, MCF-7 cells were grown in DMEM supplemented with fetal bovine serum to a final concentration of 10%. Cells were cultured in charcoal-dextran fetal bovine serum for 3 days before 100 nM E2 stimulation. High temporal resolution was achieved by increasing the cross-linking concentration of formaldehyde to 2% and reducing the time before glycine quenching to 1 minute as described previously (4). Library preparation was performed as described previously (4, 37). Data are available under GEO (Gene Expression Omnibus) accession number GSE54855.
Quantifying changes in global run-on (GRO)-seq
We used the R package DEseq (38) to statistically determine differentially expressed GRO-seq genes using the raw number of reads aligning to gene annotations before and after estrogen treatment. We applied an independent gene filter (R package genefilter) to increase the sensitivity of detecting differences in expression (39). We identified 1106 genes that were significantly activated and 728 genes that were repressed at both the 10- and 40-minute time points. Note that the chromatin interaction analysis by paired-end tag sequencing (ChIA-PET) data were not used in the classification of genes by GRO-seq.
Peak calling
We aligned raw sequence reads to the hg19 genome using bowtie (40). Replicate time points were found to be concordant and were therefore merged to call peaks using model-based analysis of ChIP-seq (MACS) (41) and a mock immunoprecipitation as a background data set (4). We used the peaksplitter option in MACS to further dissect the broad regions of enrichment (41). Many peaks were found at multiple time points, so redundant peaks were filtered out if a 100-bp window centered on the summit was within 30 bp of the adjacent peak; the peak summit with the most tag counts was retained. The union of ChIP-seq peaks for histone 3 arginine 26 citrullination (H3R26Cit) and ER was used for the analyses (Supplemental Dataset 1).
De novo motif analysis
We used the 60 bp of sequence surrounding the peak summits for de novo motif identification with MEME (42). If the genomic coordinates data set contained more than 2000 ChIP-seq peaks, we randomly selected 2000 peaks for motif analysis.
Enhancer analysis
Of the 728 sustained, immediate repressed genes, 704 genes showed physical interaction, by RNA PolII ChIA-PET, to an enhancer and overlapped a DNase hypersensitive site. Note that we used PolII ChIA-PET data to classify repressed genes, because the genes are most active before E2 treatment and repression may be ER independent. For the cases in which we observe passive ER binding to repressed genes, the ER ChIA-PET data would not be informative because the post-E2 ER ChIA-PET time point was taken after maximal ER binding is observed by ChIP. The enhancers of E2-repressed genes were compared directly with enhancers of 1755 unregulated genes that also contain PolII ChIA-PET enhancers that overlap with DNase hypersensitive sites. Of the 1106 activated genes, 460 contained at least one ER ChIA-PET enhancer. We found that 424 of the 460 also contained H3R26Cit; these enhancers were compared with 60 unregulated genes with ER ChIA-PET/H3R26Cit enhancers. In Supplemental Tables 1 and 2, if any of the genes had an enhancer that was enriched for each factor/modification, then that gene was classified as enriched for that mark. Note that the P values in Supplemental Table 2 are from a comparison of repressed genes that have PolII ChIA-PET/DNase enhancers with unregulated genes that have PolII ChIA-PET/DNase enhancers. The P values in Supplemental Table 1 are derived from a comparison of activated genes that have ER ChIA-PET/H3R26Cit enhancers with unregulated genes that have ER ChIA-PET/H3R26Cit enhancers.
Kinetic analysis
The kinetic ER ChIP-seq analysis was independent of the ChIA-PET data, because kinetic ER ChIA-PET does not exist. We used transient ER binding sites near repressed genes (Figure 4) or canonical ER binding sites (maximum intensity at 10 or 40 minutes) near activated genes for de novo motif analysis and assessment of histone H3 acetylated at lysine 27 (H3K27ac) changes.
Figure 4.

A, De novo motif analysis at ER binding sites at significantly repressed genes that peak at 2 or 5 minutes showed a motif that most resembles the ATF1 (P = .0050), cJun (P = .0015), CREB1 (P = .0028), and JunD (P = .0074) motifs. B, After 10 minutes of E2 treatment H3K27ac is reduced dramatically at transient ER binding sites near repressed genes. Compared with random regions, canonical ER binding sites (maximum at either 10 or 40 minutes) modestly increase their H3K27ac signal.
Results
E2-responsive enhancers associate with distinct transcription factors and cofactors
The MCF-7 breast cancer–derived cell line is a model system for studying estrogen signaling. For this reason, a very comprehensive set of molecular genomics data is available for this cell line. Binding of many transcription factors, cofactors, and histone marks has been measured in MCF-7 cells before and after E2 treatment (21, 43–50). Enhancers that physically interact with genes via looping have been identified in MCF-7 cells using ChIA-PET (45). The chromatin landscape has been surveyed by DNase-seq before and after E2 treatment (51). Although these methodologies measure TF binding events, chromatin changes, and the physical interactions that precipitate the ER regulatory cascade, transcriptional output ultimately controls cell fate. To study the E2-response network, we analyzed a high-resolution time course of changes in nascent transcription (GRO-seq) upon E2 treatment in MCF-7 cells (52). GRO-seq measures nascent transcription by mapping the orientation and position of all classes of transcriptionally engaged RNA polymerase (53). The GRO-seq time points allow the opportunity to discern the primary effects on transcription from the complex cascade of regulatory interactions precipitated by these primary transcripts.
We reanalyzed the raw GRO-seq data to increase the power to detect true changes in transcription (Supplemental Figures 1–4). We assumed a conservative rate of polymerase movement through the gene of 2 kb/min; therefore, we only looked for transcriptional changes as far as 20 kb into the gene body after 10 minutes, as far as 80 kb after 40 minutes, and as far as 320 kb after 160 minutes after E2. Reanalysis of the GRO-seq data identified 1106 genes that were activated at both the 10- and 40-minute time points (Figure 1), and we refer to these as immediate and sustained E2-activated genes. Although we also reanalyzed the 160-minute time point (Figure 1C), we concluded that transcriptional changes at 160 minutes probably result from a convolution of primary and postprimary transcriptional changes in the E2-mediated cascade. We used ChIA-PET data for ER after 45 minutes of E2 treatment and found that 460 activated genes overlap with at least one interaction partner of the ChIA-PET interaction pairs. One gene has 126 identified enhancers, whereas the vast majority of genes have less than 5 enhancers (Supplemental Figure 5). H3R26Cit, a histone modification that is critical for propagation of the E2-mediated regulatory cascade (36) overlaps with the enhancers of >92% (424 of 460) of the activated, enhancer-containing genes. However, H3R26Cit intensity only modestly correlates with changes in nascent transcription (change in normalized GRO-seq signal) after 40 minutes of E2 treatment (ρ = 0.19) and absolute transcription levels, measured by raw GRO-seq signal, at 40 minutes (ρ = 0.33). This finding is consistent with a context-specific mechanism for transcription regulation that is not linearly associated with TF binding or histone marks (4). To gain a more comprehensive understanding of ER-mediated gene expression changes, we analyzed all the ChIP-seq data that are available for MCF-7 cells (Supplemental Figure 6 and Supplemental Table 3).
Figure 1.
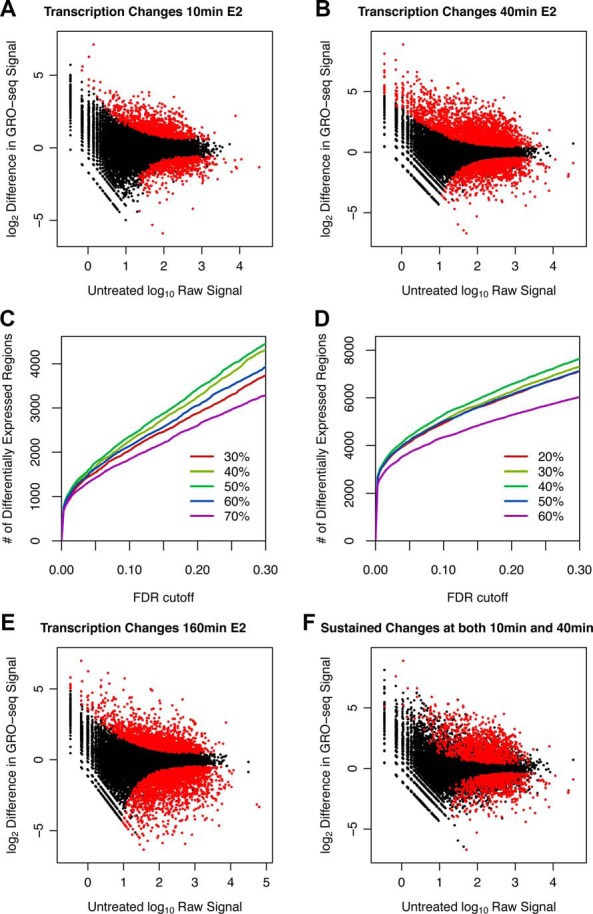
Reanalysis of GRO-seq transcriptome data after E2 treatment reveals substantial overlap between genes regulated at 10 and 40 minutes. Genes are classified as unregulated, activated, and repressed after 10 minutes (A), 40 minutes (B), and 160 minutes (E) of E2 treatment using independent gene filtering and the R statistical package DESeq. F, Red points represent significant changes in gene expression that are sustained from 10 to 40 minutes after E2 treatment. C, We assessed the power to detect significant changes by prefiltering between 30% and 70% of the data. We found that we increase statistical power as we remove 30%, 40%, and 50% of the data. The 50% threshold was used, because we start to overfilter as we go over 50% (the 60% line dips below the 50% line). This results from discarding true positives at higher thresholds. D, In contrast to panel C, we used a 40% filtering threshold.
We examined the factors that were bound at immediate and sustained activated genes that have ChIA-PET identified enhancers and H3R26Cit. We found that at least one enhancer (some genes have multiple enhancers) of >80% of the genes in this class has HDAC2 binding before E2 stimulation (Fisher exact P = .001) and 85% have p300 before E2 treatment (Fisher exact P = .0002). As expected, the p300 signal increases at these enhancers after 45 minutes of E2 treatment (Supplemental Figures 7 and 8). SIN3A is significantly enriched at >80% of ER-activated gene enhancers identified by ER ChIA-PET (Fisher exact P = 3.4e−5) (Supplemental Table 1), suggesting that ER binding may alleviate the repressive role of SIN3A in transcription.
Next we looked at E2-repressed genes that overlap with PolII ChIA-PET–identified enhancers that were found before E2 treatment. We found that p300 is specifically enriched at down-regulated genes compared with that at unregulated genes with the same enhancer class (Fisher exact P = 1.1e−14) (Supplemental Table 2). However, the signal for p300 decreases after 45 minutes of E2 at both repressed and unregulated enhancers (Supplemental Figure 8). Fisher exact P values were calculated by a comparison with the same class of enhancers (identified by ER ChIA-PET and ER peaks) at genes that are not regulated by E2; note that despite not being regulated by E2, many genes have proximal ER binding and ChIA-PET signals. These data and analyses are clear examples of TFs and coactivators that associate with ER-responsive genes both before and after E2 treatment.
Transient ER binding marks repressed genes
Next we analyzed kinetic ER ChIP-seq data to explore the possibility that kinetics and ER dynamics play an important role in E2-mediated changes in gene expression. We classified ER peaks by when they reach maximal ER-binding intensity by ChIP-seq. Most peaks reach maximum intensity at 10 or 40 minutes, but about 10% of the ER peaks reach maximum intensity at 2 or 5 minutes (Figure 2A). We refer to this class of binding sites as transient. As expected, activated genes are enriched for canonical (maximum at 10 or 40 minutes after E2) ER binding (Figure 2B); however, repressed genes tend to be closer to transient ER binding sites than activated or unregulated genes (Figure 2B). Of the top most intense ER peaks that peak at 2 minutes, ESR1, peptidylarginine deiminase 2 (PAD2), and 2 enhancers near contig_176551 (Supplemental Figure 9) are targeted. ESR1 encodes ER and previous studies have shown that nascent transcription of ESR1 is reduced immediately after E2 treatment (52). PAD2 is an important cofactor in E2-mediated activation (36), and it is immediately degraded at the protein level upon E2 treatment (Supplemental Figure 10). The function of this RNA contig is unknown, but it is unique to MCF-7 cells, is highly expressed before E2, and is dramatically reduced in nascent transcription as early as 10 minutes after E2 (Supplemental Figure 9). These data indicate that the early transient targets of ER are important.
Figure 2.

Transient ER binding events target integral components of the E2 cascade. A, These heatmaps show that a minority of ER binding sites reach maximal ER ChIP-seq intensity at 2 or 5 minutes, and the majority are maximal at 10 or 40 minutes. B, The cumulative distribution function for distance from ER binding sites is plotted for activated, unregulated, and repressed gene classes. The top panel exclusively considers ER peaks that reach maximum intensity at 10 or 40 minutes after E2; the bottom panel considers transient ER binding sites.
Having noticed that the integral components of the E2 regulatory network were transiently targeted and repressed by ER at early time points, we compared the GRO-seq changes after 40 minutes of E2 treatment with those for all ER binding sites that had a gene within 10 kb. We found that 59% of the ChIP peaks having a maximum ER intensity at 2 or 5 minutes after E2 are near E2-repressed genes, whereas only 28% of the ChIP peaks that are maximum at 40 minutes are near E2-repressed genes (Figure 3A). Note that the change in the expression of genes near transient 2- and 5-minute ChIP peaks is shifted toward the left (repressed), and the distribution of genes near 40-minute peaks is shifted right (activated). These data show raw changes in gene expression regardless of whether the change is significant, so we next considered ER-binding kinetics at significantly activated and repressed gene classes (Figure 1F). We found that transient ER binding sites were enriched within the repressed class of genes compared with activated and unregulated genes. Repressed genes were 4.5 times more enriched (11.8%/2.7%) for 2-minute transient ER sites and 8 times more enriched (12.2%/1.4%) for 5-minute transient ER binding events than activated genes (Figure 3, B and C). In contrast, repressed genes were 2-fold depleted (18%/35%) compared with activated genes for ER peaks that are maximally intense at 40 minutes (Fisher exact P = 2.2e−16). A comparison between repressed and unregulated genes showed similar ratios (2 minutes = 5-fold increase, 5 minutes = 4-fold increase, and 40 minutes = 2-fold decrease) (Fisher exact P = 4.0e−13) (Figure 3C). There was no statistically significant difference between ER-binding kinetics at activated and unregulated gene classes (Fisher exact P = 0.46).
Figure 3.

E2-repressed genes are enriched for transient ER binding events. A, Histogram shows the distribution of differential gene expression by GRO-seq for genes that are closest to early ER peaks (transparent blue) and genes closest to 40-minute peaks (transparent red). B, We plot the fraction of the ER ChIP peaks for each category that are maximally intense at each time point. Note that the distributions of unregulated and activated genes are similar and that repressed genes are enriched for peaks that are maximal at early time points. C, We plotted the ratio of the fraction of the repressed genes to either the fraction of activated (left-most panel) or unregulated (right-most panel) genes, for each kinetic time point.
Transient ER binding sites at repressed genes are not enriched for the estrogen response DNA element (ERE)
We hypothesized that ER may be interacting with transient binding sites near repressed genes in a noncanonical manner, so we performed de novo motif analysis to determine whether the canonical ERE is the most enriched motif. We found that the ERE is not enriched at these sites (Figure 4A). In contrast, the ERE half-site and the ERE were found de novo at ER binding sites near activated genes (Supplemental Figure 11). We constructed a database of more than 150 TF binding site position–specific weight matrices using in vivo human ChIP-seq data to compare our de novo-identified motif against. We developed this resource because current databases (54–56) all have position–specific weight matrices derived from a variety of organisms and techniques (eg, bacterial one-hybrid, SELEX, ChIP, and protein-binding microarrays). The heterogeneity of these databases was not ideal for comparing matrices found by ChIP-seq in human cells. Using this database (Supplemental Dataset 2), we found that the most significant de novo motif corresponds most closely to the activating transcription factor 1 (ATF1), cJun, CREB1, and JunD motifs (Figure 4A). Note that these cJun and JunD motifs are functional components of the AP-1 complex. ChIP-seq data is not available for cJun, ATF1, and CREB1 in MCF-7 cells, so we further analyzed JunD data and another AP-1 component, FosL2. The repressed genes with enhancers, from Supplemental Table 2, are significantly enriched for the AP-1 components Fosl2 (P = 3.1e−09) and JunD (P = 1.5e−4). Of these enhancers, 77% are enriched for either FosL2 or JunD.
p300 redistributes quantitatively after E2 treatment
We hypothesized that ER transiently interacts with the cofactors associated with enhancers that are active before E2 treatment, such as ATF1, the AP-1 complex, and CREB1 enhancers, and redistributes these cofactors to ER-activated genes. We found that that the H3K27ac signal is markedly decreased at >75% of the transient ER binding sites near repressed genes (Figure 4B), consistent with redistribution of acetyltransferase coactivators. We propose a passive repression mechanism, whereby activated ER will encounter cofactors engaged at non-ER enhancers at some frequency before finding EREs. If the ER-cofactor affinity is higher than the existing cofactor-TF affinity, such as the AP-1–cofactor affinity, then ER may cause disassociation of the cofactor from the TF and the ER-cofactor complex will be recruited together to EREs. This model is consistent with the fact that repressed genes are actually depleted for ER binding, relative to unregulated and activated genes (Figure 3, B and C) (52). Therefore, we consider this model an extension of the classic squelching model, whereby TFs can repress genes by sequestering cofactors (20). Importantly, the coactivators p300 and its paralog CBP are known to interact with CREB1, ATF1, and the AP-1 complex (26, 57–59). ER has also been shown to interact with CBP/p300 through interactions with the SRC family of coregulators (33); this interaction is critical for activation of ER-responsive genes (60). Because we had shown that the p300 signal decreases at enhancers that physically associate with repressed genes (Supplemental Figure 8), 70% of the ER-repressed genes from Supplemental Table 2 contain p300, and H3K27ac decreases at transient ER binding sites (Figure 4B), we wanted to test whether we could detect redistribution of p300 at a more inclusive set of sites (note that ChIA-PET detects physical interactions and is less sensitive that ChIP-seq for the same sequencing depth). The p300 protein is an ideal cofactor to test because it is limiting in cells (27, 29–32), acetylates H3K27, and is a common coactivator of ER, ATF1, CREB1, and the AP-1 complex. It is important to look at a limiting cofactor because an abundance of free cofactors will not allow for squelching, and redistribution is not likely to be observed (21). We chose to examine the genomic redistribution of p300, so we analyzed all p300 binding sites, regardless of whether the p300 site corresponds with a gene that is regulated by E2. After 45 minutes of E2 treatment we found that, on average, the p300 signal modestly decreases at preexisting p300 binding sites that do not overlap with ER binding sites (Figure 5A). In contrast, the composite p300 signal increases dramatically at p300 binding sites that overlap ER peaks upon E2 treatment (Figure 5A). These composite profiles display what happens on average at a p300 binding site. To quantify the raw p300 signal that changes in each category, we multiplied the area between the curves by the number of p300 peaks that are used to generate the composite profiles (47 731 p300 peaks without ER and 7674 p300 peaks overlap ER). We found that 85% of the p300 signal that is lost at non-ER p300 peaks upon E2 treatment is gained at p300 peaks that overlap ER peaks (Figure 5B). Note that the change in p300 intensity in each category varies, depending on the specific p300 binding site (Figure 5C). As expected, the raw p300 signal at ER-bound sites tends to increase at most sites (75%), and most non-ER p300 peaks (65%) tend to lose p300 signal upon E2 treatment (Figure 5C). For example, MAPK9 is significantly repressed after 10 and 40 minutes of E2 treatment, and the MAPK9 enhancer loses p300 after 45 minutes of E2 (Figure 6A). In contrast, the E2-inducible TFF1 gene gains a p300 enhancer at the site of ER binding (Figure 6B). These data support a model whereby physiological squelching occurs through the redistribution of TFs; importantly, our kinetic data reveal that ER may physically interact with cofactors on chromatin in a transient manner to precipitate cofactor redistribution and cause gene repression.
Figure 5.
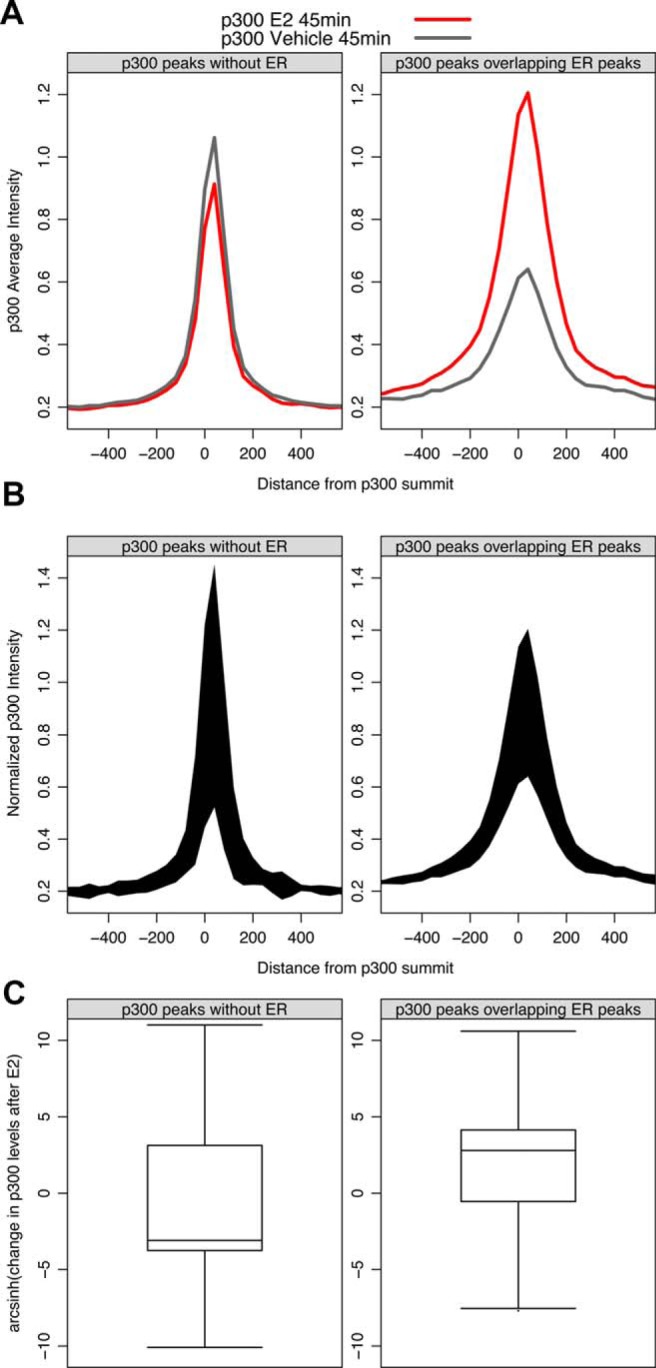
The p300 protein quantitatively redistributes from non-ER binding sites to ER binding sites upon E2 treatment. A, Composite profiles for p300 before and after E2 treatment reveal that the average change in p300 at non-ER peaks is modestly decreased; in contrast, the average positive change in p300 at ER peaks is substantial. B, Normalizing the area between the curves from panel A by the number of genomic regions that comprise the composite (47 731 p300 peaks without ER and 7674 p300 peaks overlap ER) shows that 85% of the p300 signal lost at non-ER peaks is gained at ER binding sites upon E2 treatment. C, To transform the negative values on the y-axis to a semilog form, we performed inverse hyperbolic sine transformation.
Figure 6.

A, The MAPK9 gene is immediately repressed upon E2 treatment and maintains its repressed state at 40 minutes. The p300-containing MAPK9 enhancer (transparent gray box) loses p300 after 45 minutes of E2 treatment. The normalized ER-ChIP-seq intensity at the p300 summit is highest after 2 minutes of E2 treatment. B, The E2-inducible TFF1 gene gains p300 at an ER-bound enhancer (transparent gray box) after E2 treatment. The normalized ER-ChIP-seq intensity at the p300 summit is highest after 10 minutes of E2 treatment.
Discussion
TFs bind to DNA to modulate transcription levels, but proximal TF binding is neither necessary nor sufficient to activate or repress genes. Recent genomic tools provide the opportunity to study the context-specific nature of TF-induced gene modulation. Recent studies have revealed that the spatial organization of insulators (5) and core promoter elements (6) and the presence of cofactors (4, 10–12) influence the activation potential of TF-bound genes. However, the mechanism by which classic TF activators act to immediately repress genes is less understood. Our analysis expanded upon the physiological squelching model proposed many years ago (15–19). We found that ER transiently interacts with enhancers that are active before estrogen treatment. We propose that ER passively strips common cofactors, such as p300, from these enhancers; as a result, ER and the cofactors are corecruited to canonical ER binding sites to activate transcription (Figure 7). This molecular model of physiological squelching is supported by our observation that transiently bound ER peaks are enriched for repressed genes and p300 is quantitatively redistributed upon estrogen treatment.
Figure 7.

A, Before estrogen treatment, gene A is maintained in an active state by AP-1 and AP-1′w interaction with a cofactor. Gene B is transcribed at basal levels. B, Some ligand-bound ER molecules are likely to encounter engaged cofactors before finding EREs. C, If the affinity of the cofactor-ER interaction exceeds that of the cofactor-AP-1 interaction, then ER may be able to dissociate the cofactor from gene A. This redistribution of cofactor can cause repression of gene A and activation of gene B.
We propose that the ability to “hijack” cofactors is dependent upon the affinity between the TFs that are competing for common cofactors. Therefore, squelching is not necessarily a pan-repression model and specificity could be achieved by competing TFs having a common set of cofactors. A previous report has shown that ER and FOXA1 compete for the coactivator SRC-3, and repression is probably achieved through a squelching mechanism (21). Note that the SRC family of proteins physically bridges the ER/p300 interaction (33, 60), so our measurement of p300 redistribution may be an indirect result of SRC squelching by ER.
Previous work has proposed squelching as a general mechanism of nuclear receptor repression. For instance, ligand-dependent activation and repression of peroxisome proliferator-activated nuclear receptor γ (PPARγ) genes is dependent on the ability of PPARγ to interact with SRC and p300/CBP (32). The authors noted that the expression of PPARγ-repressed genes is dependent on AP-1, which may be competing for the SRC and p300/cofactors (32). Moreover, the antagonistic effect that glucocorticoid receptor has on AP-1 target gene expression may be due to squelching of cofactors (61–64). Whereas the mechanisms of antagonism between AP-1 and nuclear receptors are the subject of much debate, the fact remains that this antagonism is apparent for many nuclear receptors. For instance, in addition to ER, glucocorticoid receptor, and PPARγ, the retinoic acid receptor has been shown to repress AP-1 responsive genes and AP-1 can repress vitamin D receptor and retinoic acid receptor responsive genes (63, 64). Furthermore, PPARγ stimulation causes a redistribution of p300, CBP, and mediator from repressed enhancers (65). Further investigation of these receptors will determine whether transient receptor binding and quantitative cofactor redistribution are associated with other nuclear receptor–repressed genes.
We are not proposing that squelching is the only mechanism by which immediate E2-responsive genes are repressed; but we did detect that transient ER binding occurs at 25% of ER-bound repressed genes (Figure 3B). A more comprehensive time course of ER binding after E2 treatment would probably increase the fraction of repressed genes that exhibit transient ER binding. These transient ER-binding events indicate that high temporal resolution of TF binding is necessary to fully understand the regulatory networks of regulatory cascades. Unbiased molecular genomic approaches and analyses permit the study of context-specific TF action in an unprecedented manner. Unraveling networks in this manner promises to reveal how TFs propagate regulatory cascades under normal physiological states and how these cascades are disrupted in disease states. We look forward to high temporal resolution kinetic experiments that measure changes in TF occupancy, chromatin structure, and transcriptional output throughout development and within regulatory networks to elucidate the complex cascade of molecular events that occur within biological networks.
Additional material
Supplementary data supplied by authors.
Acknowledgments
We thank R. Louis Schiltz and Fabiana Duarte for critical review of the article.
This work was supported by a Department of Defense Era of Hope Scholar Award (W871XWH-07-1-0372) to S.A.C. X.Z. was supported by the Susan G. Komen for the Cure Postdoctoral Fellowship (KG101303) and the National Science Foundation of China (81372850). G.L.H. and M.J.G. were supported by the Intramural Research Program of the National Institutes of Health, National Cancer Institute, Center for Cancer Research.
M.J.G. performed the computational and statistical analyses, designed the study, and wrote the manuscript. X.Z. performed the experiments. S.A.C. and G.L.H. supervised the research. All authors read and approved the final manuscript.
Disclosure Summary: The authors have nothing to disclose.
Footnotes
- ATF1
- activating transcription factor 1
- CBP
- cAMP response element-binding protein –binding protein
- ChIA-PET
- chromatin interaction analysis by paired-end tag sequencing
- ChIP
- chromatin immunoprecipitation
- CREB
- cAMP response element-binding protein
- E2
- estradiol
- ER
- estrogen receptor α
- ERE
- estrogen response DNA element
- GRO
- global run-on
- H3K27ac
- histone H3 acetylated at lysine 27
- H3R26Cit
- histone 3 arginine 26 citrullination
- MACS
- model-based analysis of ChIP-seq
- PAD2
- peptidylarginine deiminase 2
- PolII
- RNA polymerase II
- PPARγ
- peroxisome proliferator–activated nuclear receptor γ
- seq
- sequencing
- SRC
- steroid receptor coactivator
- TF
- transcription factor.
References
- 1. Busby S, Ebright RH. Promoter structure, promoter recognition, and transcription activation in prokaryotes. Cell. 1994;79:743–746. [DOI] [PubMed] [Google Scholar]
- 2. Gilbert W, Müller-Hill B. Isolation of the lac repressor. Proc Natl Acad Sci USA. 1966;56:1891–1898. [DOI] [PMC free article] [PubMed] [Google Scholar]
- 3. Burgess-Beusse B, Farrell C, Gaszner M, et al. The insulation of genes from external enhancers and silencing chromatin. Proc Natl Acad Sci USA 2002;99(suppl 4):16433–16437. [DOI] [PMC free article] [PubMed] [Google Scholar]
- 4. Guertin MJ, Lis JT. Chromatin landscape dictates HSF binding to target DNA elements. PLoS Genet. 2010;6:e1001114. [DOI] [PMC free article] [PubMed] [Google Scholar]
- 5. Tiana M, Villar D, Pérez-Guijarro E, et al. A role for insulator elements in the regulation of gene expression response to hypoxia. Nucleic Acids Res. 2012;40:1916–1927. [DOI] [PMC free article] [PubMed] [Google Scholar]
- 6. Juven-Gershon T, Hsu JY, Kadonaga JT. Caudal, a key developmental regulator, is a DPE-specific transcriptional factor. Genes Dev. 2008;22:2823–2830. [DOI] [PMC free article] [PubMed] [Google Scholar]
- 7. Kwak H, Fuda NJ, Core LJ, Lis JT. Precise maps of RNA polymerase reveal how promoters direct initiation and pausing. Science. 2013;339:950–953. [DOI] [PMC free article] [PubMed] [Google Scholar]
- 8. Lee H, Kraus KW, Wolfner MF, Lis JT. DNA sequence requirements for generating paused polymerase at the start of hsp70. Genes Dev. 1992;6:284–295. [DOI] [PubMed] [Google Scholar]
- 9. Ardehali MB, Yao J, Adelman K, et al. Spt6 enhances the elongation rate of RNA polymerase II in vivo. EMBO J. 2009;28:1067–1077. [DOI] [PMC free article] [PubMed] [Google Scholar]
- 10. Zhang W, Tsuchiya T, Yasukochi Y. Transitional change in interaction between HIF-1 and HNF-4 in response to hypoxia. J Hum Genet. 1999;44:293–299. [DOI] [PubMed] [Google Scholar]
- 11. Yamashita K, Discher DJ, Hu J, Bishopric NH, Webster KA. Molecular regulation of the endothelin-1 gene by hypoxia. Contributions of hypoxia-inducible factor-1, activator protein-1, GATA-2, and p300/CBP. J Biol Chem. 2001;276:12645–12653. [DOI] [PubMed] [Google Scholar]
- 12. Aprelikova O, Wood M, Tackett S, Chandramouli GV, Barrett JC. Role of ETS transcription factors in the hypoxia-inducible factor-2 target gene selection. Cancer Res. 2006;66:5641–5647. [DOI] [PubMed] [Google Scholar]
- 13. Guertin MJ, Lis JT. Mechanisms by which transcription factors gain access to target sequence elements in chromatin. Curr Opin Genet Dev. 2013;23:116–123. [DOI] [PMC free article] [PubMed] [Google Scholar]
- 14. Wu W, Cheng Y, Keller CA, et al. Dynamics of the epigenetic landscape during erythroid differentiation after GATA1 restoration. Genome Res. 2011;21:1659–1671. [DOI] [PMC free article] [PubMed] [Google Scholar]
- 15. Meyer ME, Gronemeyer H, Turcotte B, Bocquel MT, Tasset D, Chambon P. Steroid hormone receptors compete for factors that mediate their enhancer function. Cell. 1989;57:433–442. [DOI] [PubMed] [Google Scholar]
- 16. Gilbert DM, Heery DM, Losson R, Chambon P, Lemoine Y. Estradiol-inducible squelching and cell growth arrest by a chimeric VP16-estrogen receptor expressed in Saccharomyces cerevisiae: suppression by an allele of PDR1. Mol Cell Biol. 1993;13:462–472. [DOI] [PMC free article] [PubMed] [Google Scholar]
- 17. Gill G, Ptashne M. Negative effect of the transcriptional activator GAL4. Nature. 1988;334:721–724. [DOI] [PubMed] [Google Scholar]
- 18. Triezenberg SJ, Kingsbury RC, McKnight SL. Functional dissection of VP16, the trans-activator of herpes simplex virus immediate early gene expression. Genes Dev. 1988;2:718–729. [DOI] [PubMed] [Google Scholar]
- 19. Triezenberg SJ, LaMarco KL, McKnight SL. Evidence of DNA: protein interactions that mediate HSV-1 immediate early gene activation by VP16. Genes Dev. 1988;2:730–742. [DOI] [PubMed] [Google Scholar]
- 20. Carroll JS, Meyer CA, Song J, et al. Genome-wide analysis of estrogen receptor binding sites. Nat Genet. 2006;38:1289–1297. [DOI] [PubMed] [Google Scholar]
- 21. He HH, Meyer CA, Chen MW, Jordan VC, Brown M, Liu XS. Differential DNase I hypersensitivity reveals factor-dependent chromatin dynamics. Genome Res. 2012;22:1015–1025. [DOI] [PMC free article] [PubMed] [Google Scholar]
- 22. Vo N, Goodman RH. CREB-binding protein and p300 in transcriptional regulation. J Biol Chem. 2001;276:13505–13508. [DOI] [PubMed] [Google Scholar]
- 23. Manning ET, Ikehara T, Ito T, Kadonaga JT, Kraus WL. p300 forms a stable, template-committed complex with chromatin: role for the bromodomain. Mol Cell Biol. 2001;21:3876–3887. [DOI] [PMC free article] [PubMed] [Google Scholar]
- 24. Zeng L, Zhang Q, Gerona-Navarro G, Moshkina N, Zhou MM. Structural basis of site-specific histone recognition by the bromodomains of human coactivators PCAF and CBP/p300. Structure. 2008;16:643–652. [DOI] [PMC free article] [PubMed] [Google Scholar]
- 25. Delvecchio M, Gaucher J, Aguilar-Gurrieri C, Ortega E, Panne D. Structure of the p300 catalytic core and implications for chromatin targeting and HAT regulation. Nat Struct Mol Biol. 2013;20:1040–1046. [DOI] [PubMed] [Google Scholar]
- 26. Chrivia JC, Kwok RP, Lamb N, Hagiwara M, Montminy MR, Goodman RH. Phosphorylated CREB binds specifically to the nuclear protein CBP. Nature. 1993;365:855–859. [DOI] [PubMed] [Google Scholar]
- 27. Petrij F, Giles RH, Dauwerse HG, et al. Rubinstein-Taybi syndrome caused by mutations in the transcriptional co-activator CBP. Nature. 1995;376:348–351. [DOI] [PubMed] [Google Scholar]
- 28. Morin RD, Mendez-Lago M, Mungall AJ, et al. Frequent mutation of histone-modifying genes in non-Hodgkin lymphoma. Nature. 2011;476:298–303. [DOI] [PMC free article] [PubMed] [Google Scholar]
- 29. Yao TP, Oh SP, Fuchs M, et al. Gene dosage-dependent embryonic development and proliferation defects in mice lacking the transcriptional integrator p300. Cell. 1998;93:361–372. [DOI] [PubMed] [Google Scholar]
- 30. Tanaka Y, Naruse I, Maekawa T, Masuya H, Shiroishi T, Ishii S. Abnormal skeletal patterning in embryos lacking a single Cbp allele: a partial similarity with Rubinstein-Taybi syndrome. Proc Natl Acad Sci USA. 1997;94:10215–10220. [DOI] [PMC free article] [PubMed] [Google Scholar]
- 31. Akimaru H, Chen Y, Dai P, et al. Drosophila CBP is a co-activator of cubitus interruptus in hedgehog signalling. Nature. 1997;386:735–738. [DOI] [PubMed] [Google Scholar]
- 32. Li M, Pascual G, Glass CK. Peroxisome proliferator-activated receptor γ-dependent repression of the inducible nitric oxide synthase gene. Mol Cell Biol. 2000;20:4699–4707. [DOI] [PMC free article] [PubMed] [Google Scholar]
- 33. Kim MY, Hsiao SJ, Kraus WL. A role for coactivators and histone acetylation in estrogen receptor α-mediated transcription initiation. EMBO J. 2001;20:6084–6094. [DOI] [PMC free article] [PubMed] [Google Scholar]
- 34. Kraus WL, Kadonaga JT. p300 and estrogen receptor cooperatively activate transcription via differential enhancement of initiation and reinitiation. Genes Dev. 1998;12:331–342. [DOI] [PMC free article] [PubMed] [Google Scholar]
- 35. Hanstein B, Eckner R, DiRenzo J, et al. p300 is a component of an estrogen receptor coactivator complex. Proc Natl Acad Sci USA. 1996;93:11540–11545. [DOI] [PMC free article] [PubMed] [Google Scholar]
- 36. Zhang X, Bolt M, Guertin MJ, et al. Peptidylarginine deiminase 2-catalyzed histone H3 arginine 26 citrullination facilitates estrogen receptor α target gene activation. Proc Natl Acad Sci USA. 2012;109:13331–13336 [DOI] [PMC free article] [PubMed] [Google Scholar]
- 37. Guertin MJ, Martins AL, Siepel A, Lis JT. Accurate prediction of inducible transcription factor binding intensities in vivo. PLoS Genet. 2012;8:e1002610. [DOI] [PMC free article] [PubMed] [Google Scholar]
- 38. Anders S, Reyes A, Huber W. Detecting differential usage of exons from RNA-seq data. Genome Res. 2012;22:2008–2017. [DOI] [PMC free article] [PubMed] [Google Scholar]
- 39. Gentleman R, Carey V, Huber W, Hahne F. genefilter: genefilter: methods for filtering genes from microarray experiments. R package version 1.46.1 Vienna, Austria: R Foundation for Statistical Computing; 2011. [Google Scholar]
- 40. Langmead B, Trapnell C, Pop M, Salzberg SL. Ultrafast and memory-efficient alignment of short DNA sequences to the human genome. Genome Biol. 2009;10:R25. [DOI] [PMC free article] [PubMed] [Google Scholar]
- 41. Zhang Y, Liu T, Meyer CA, et al. Model-based analysis of ChIP-Seq (MACS). Genome Biol. 2008;9:R137. [DOI] [PMC free article] [PubMed] [Google Scholar]
- 42. Bailey TL, Boden M, Buske FA, et al. MEME suite: tools for motif discovery and searching. Nucleic Acids Res. 2009;37:W202–W208. [DOI] [PMC free article] [PubMed] [Google Scholar]
- 43. ENCODE Project Consortium. An integrated encyclopedia of DNA elements in the human genome. Nature. 2012;489:57–74. [DOI] [PMC free article] [PubMed] [Google Scholar]
- 44. Welboren WJ, van Driel MA, Janssen-Megens EM, et al. ChIP-Seq of ERα and RNA polymerase II defines genes differentially responding to ligands. EMBO J. 2009;28:1418–1428. [DOI] [PMC free article] [PubMed] [Google Scholar]
- 45. Fullwood MJ, Liu MH, Pan YF, et al. An oestrogen-receptor-α-bound human chromatin interactome. Nature. 2009;462:58–64. [DOI] [PMC free article] [PubMed] [Google Scholar]
- 46. Tan SK, Lin ZH, Chang CW, et al. AP-2γ regulates oestrogen receptor-mediated long-range chromatin interaction and gene transcription. EMBO J. 2011;30:2569–2581. [DOI] [PMC free article] [PubMed] [Google Scholar]
- 47. Joseph R, Orlov YL, Huss M, et al. Integrative model of genomic factors for determining binding site selection by estrogen receptor-α. Mol Syst Biol. 2010;6:456. [DOI] [PMC free article] [PubMed] [Google Scholar]
- 48. Schmidt D, Schwalie PC, Ross-Innes CS, et al. A CTCF-independent role for cohesin in tissue-specific transcription. Genome Res. 2010;20:578–588. [DOI] [PMC free article] [PubMed] [Google Scholar]
- 49. Kong SL, Li G, Loh SL, Sung WK, Liu ET. Cellular reprogramming by the conjoint action of ERα, FOXA1, and GATA3 to a ligand-inducible growth state. Mol Syst Biol. 2011;7:526. [DOI] [PMC free article] [PubMed] [Google Scholar]
- 50. Zwart W, Theodorou V, Kok M, Canisius S, Linn S, Carroll JS. Oestrogen receptor-co-factor-chromatin specificity in the transcriptional regulation of breast cancer. EMBO J. 2011;30:4764–4776. [DOI] [PMC free article] [PubMed] [Google Scholar]
- 51. Neph S, Vierstra J, Stergachis AB, et al. An expansive human regulatory lexicon encoded in transcription factor footprints. Nature. 2012;489:83–90. [DOI] [PMC free article] [PubMed] [Google Scholar]
- 52. Hah N, Danko CG, Core L, et al. A rapid, extensive, and transient transcriptional response to estrogen signaling in breast cancer cells. Cell. 2011;145:622–634. [DOI] [PMC free article] [PubMed] [Google Scholar]
- 53. Core LJ, Waterfall JJ, Lis JT. Nascent RNA sequencing reveals widespread pausing and divergent initiation at human promoters. Science. 2008;322:1845–1848. [DOI] [PMC free article] [PubMed] [Google Scholar]
- 54. Sandelin A. JASPAR: an open-access database for eukaryotic transcription factor binding profiles. Nucleic Acids Res. 2004;32(Database issue):D91–D94. [DOI] [PMC free article] [PubMed] [Google Scholar]
- 55. Newburger DE, Bulyk ML. UniPROBE: an online database of protein binding microarray data on protein-DNA interactions. Nucleic Acids Res. 2009;37:D77–D82. [DOI] [PMC free article] [PubMed] [Google Scholar]
- 56. Matys V. TRANSFAC and its module TRANSCompel: transcriptional gene regulation in eukaryotes. Nucleic Acids Res. 2006;34:D108–110. [DOI] [PMC free article] [PubMed] [Google Scholar]
- 57. Lundblad JR, Kwok RP, Laurance ME, Harter ML. Adenoviral E1A-associated protein p300 as a functional homologue of the transcriptional co-activator CBP. Nature. 1995;374:85–88 [DOI] [PubMed] [Google Scholar]
- 58. Lee JS, See RH, Deng T, Shi Y. Adenovirus E1A downregulates cJun- and JunB-mediated transcription by targeting their coactivator p300. Mol Cell Biol. 1996;16:4312–4326. [DOI] [PMC free article] [PubMed] [Google Scholar]
- 59. Arias J, Alberts AS, Brindle P, et al. Activation of cAMP and mitogen responsive genes relies on a common nuclear factor. Nature. 1994;370:226–229. [DOI] [PubMed] [Google Scholar]
- 60. Acevedo ML, Kraus WL. Mediator and p300/CBP-steroid receptor coactivator complexes have distinct roles, but function synergistically, during estrogen receptor α-dependent transcription with chromatin templates. Mol Cell Biol. 2003;23:335–348. [DOI] [PMC free article] [PubMed] [Google Scholar]
- 61. Jonat C, Rahmsdorf HJ, Park KK, et al. Antitumor promotion and antiinflammation: down-modulation of AP-1 (Fos/Jun) activity by glucocorticoid hormone. Cell. 1990;62:1189–1204. [DOI] [PubMed] [Google Scholar]
- 62. Schüle R, Rangarajan P, Kliewer S, et al. Functional antagonism between oncoprotein c-Jun and the glucocorticoid receptor. Cell. 1990;62:1217–1226. [DOI] [PubMed] [Google Scholar]
- 63. Schüle R, Evans RM. Functional antagonism between oncoprotein c-Jun and steroid hormone receptors. Cold Spring Harb Symp Quant Biol. 1991;56:119–127. [DOI] [PubMed] [Google Scholar]
- 64. Kamei Y, Xu L, Heinzel T, et al. A CBP integrator complex mediates transcriptional activation and AP-1 inhibition by nuclear receptors. Cell. 1996;85:403–414. [DOI] [PubMed] [Google Scholar]
- 65. Step SE, Lim HW, Marinis JM, et al. Anti-diabetic rosiglitazone remodels the adipocyte transcriptome by redistributing transcription to PPARγ-driven enhancers. Genes Dev. 2014;28:1018–1028. [DOI] [PMC free article] [PubMed] [Google Scholar]
Associated Data
This section collects any data citations, data availability statements, or supplementary materials included in this article.