Abstract

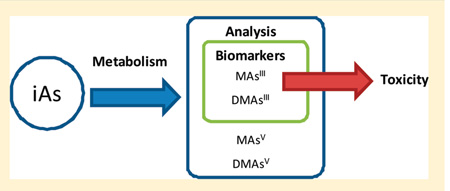
Growing evidence suggest that the methylated trivalent metabolites of inorganic arsenic (iAs), methylarsonite (MAsIII) and dimethylarsinite (DMAsIII), contribute to adverse effects of iAs exposure. However, the lack of suitable methods has hindered the quantitative analysis of MAsIII and DMAsIII in complex biological matrices. Here, we show that hydride generation-cryotrapping-atomic absorption spectrometry can quantify both MAsIII and DMAsIII in livers of mice exposed to iAs. No sample extraction is required, thus limiting MAsIII or DMAsIII oxidation prior to analysis. The limits of detection are below 6 ng As/g of tissue, making this method suitable even for studies examining low exposures to iAs.
Inorganic arsenic (iAs), a carcinogenic metalloid found in the earth’s crust, can accumulate in aquifers naturally or due to industrial activities.1 Chronic iAs exposure through contaminated drinking water has been linked to risks of various diseases, including cancer, hypertension, and diabetes.2–4 The individual susceptibility to these diseases varies considerably, even at similar exposure levels, complicating the risk assessment. Current evidence suggest that the trivalent methylated metabolites of iAs, methylarsonite (MAsIII) and dimethylarsinite (DMAsIII), are more toxic than pentavalent methylarsonate (MAsV) and dimethylarsinate (DMAsV), or iAs species, arsenite (iAsIII) and arsenate (iAsV).5 Both MAsIII and DMAsIII are products of iAs methylation by arsenic (+3 oxidation state) methyltransferase6 and by cultured human hepatocytes.7 Both MAsIII and DMAsIII are present in the urine of individuals exposed to iAs in drinking water.8 However, results of recent studies indicate that the concentrations and proportion of iAs metabolites in urine do not necessarily reflect the concentrations and speciation of As in tissues targeted by iAs exposure.9–11 Other studies demonstrate an organ specific accumulation of iAs and methylated arsenicals after exposure to iAs.12 Thus, the quantitative analysis of iAs metabolites in target tissues is crucial for elucidating the mechanisms of the adverse effects of iAs exposure and for understanding the interindividual variations in manifestation and severity of the diseases associated with this exposure.
Several methods have been developed for the speciation analysis of As in aqueous samples, including human urine.13–15 However, only hydride generation-cryotrapping-atomic absorption spectroscopy (HG-CT-AAS) is uniquely suited for the oxidation state specific analysis of As in complex biological matrices.6,16,17 Unlike HPLC techniques, HG-CT-AAS does not require digestion or extraction of biological samples and, therefore, limits the artifacts associated with the oxidation or with on-column binding of the reactive, but unstable methylated trivalent metabolites.18 We have previously used HG-CT-AAS for quantitative analysis of iAs metabolites, including MAsIII and DMAsIII in cultured mammalian cells capable of methylating iAs.6 Here, speciation analysis of As is carried out in two sample aliquots. In the first aliquot, hydrides (arsine and methyl-sub-stituted arsines) from the trivalent As species (iAsIII, MAsIII, and DMAsIII) are selectively generated at pH 6 and measured directly without sample pretreatment. The second aliquot is treated with 2% l-cysteine to reduce the pentavalent As species (iAsV, MAsV, and DMAsV) to trivalency; thus, arsines generated from this sample aliquot represent both tri- and pentavalent As species (iAsIII+V, MAsIII+V, and DMAsIII+V) present in the sample. The concentrations of the pentavalent As species are then determined by subtracting the results of analysis in the first sample aliquot from results of the analysis in the second aliquot. (See Supporting Information for technical details.) The goal of the present study was to examine whether this HG-CT-AAS technique is also suitable for quantitative, oxidation state specific analysis of As species in tissues.
In the first step, we compared the efficiency of generation of As species in aqueous solutions and in mouse livers. Here, we used the liver from an untreated mouse fed a regular diet and drinking deionized water (DIW). Ten percent liver homogenates (w/v) were prepared in DIW on ice and spiked with iAsV, MAsV, and DMAsV standards to generate calibration curves. In parallel, calibration curves were generated for solutions of these standards in DIW. Both, the aqueous standard solutions and the spiked homogenates were treated with 2% l-cysteine and analyzed by HG-CT-AAS6,16,17 using an AAnalyst800 atomic absorption spectrometer equipped with a FIAS400 flow injection accessory (PerkinElmer Norwalk, CT, USA). We found that the slopes of the calibration curves generated for the aqueous standards and spiked homogenates are very similar (Table S1, Supporting Information), suggesting that the complex matrix of the liver homogenate does not interfere with the analysis.
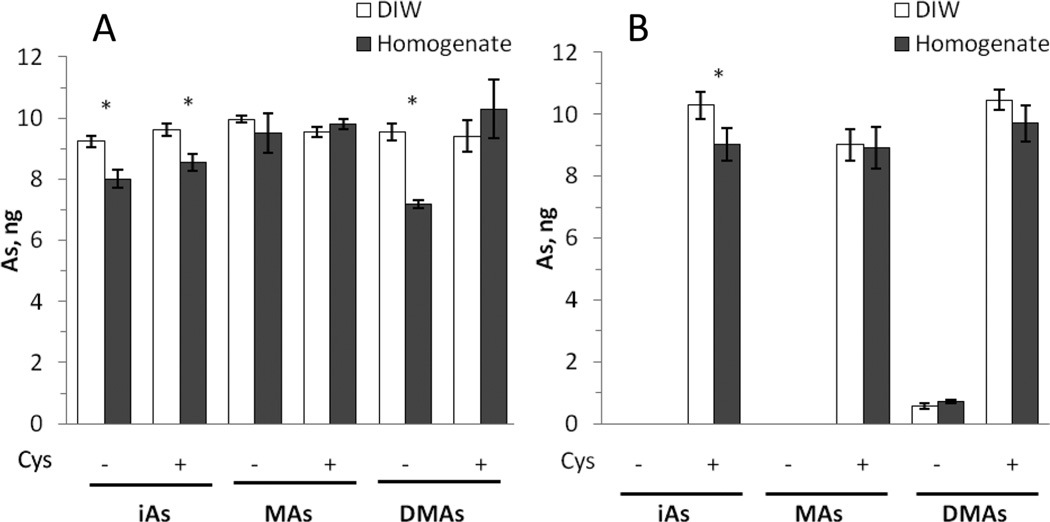
In the second step, we compared the recovery of As standards from a liver homogenate and aqueous solutions. Here, a mixture of pentavalent iAsV, MAsV, and DMAsV standards (10 ng As each) and individual trivalent iAsIII, MAsIII, and DMAsIII standards (10 ng As each) were prepared in DIW or in a 10% liver homogenate from an untreated mouse and analyzed with or without l-cysteine pretreatment. Figure 1 shows that, regardless of the matrix, the trivalent arsenicals can be quantitatively analyzed in the absence or presence of l-cysteine with As recoveries of ~92–105%. Lower As recoveries were found only for homogenates spiked with iAsIII (~80%) or DMAsIII (~72%) that were not treated with l-cysteine. In contrast, the pentavalent arsenicals were detected only after the prereduction with l-cysteine. Consistent with our previous findings,17 only DMAsV generated a small amount of dimethylarsine (~6–7% of total As) in the absence of l-cysteine. The recoveries of As for DIW and homogenates spiked with pentavalent standards ranged from ~90 to 102%. Detection limits calculated for a blank liver homogenate with and without l-cysteine pretreatment ranged from 9 to 14 pg As, which translate to ≤6 ng As/g of the tissue (Table S2, Supporting Information).
Figure 1.
HG-CT-AAS analysis of DIW and 10% liver homogenate spiked with AsIII (A) and AsV (B) standards. DIW and aliquots of the homogenate were spiked with a mixture of AsV standards (10 ng each) or with individual AsIII standards (10 ng each) and analyzed before and after pretreatment with 2% l-cysteine (Cys) (mean ± SD, n = 3). *Statistically significant differences (p < 0.05) between the amounts of an As species detected in DIW and in the homogenate as determined by ANOVA with a Bonferroni multiple comparison post-test.
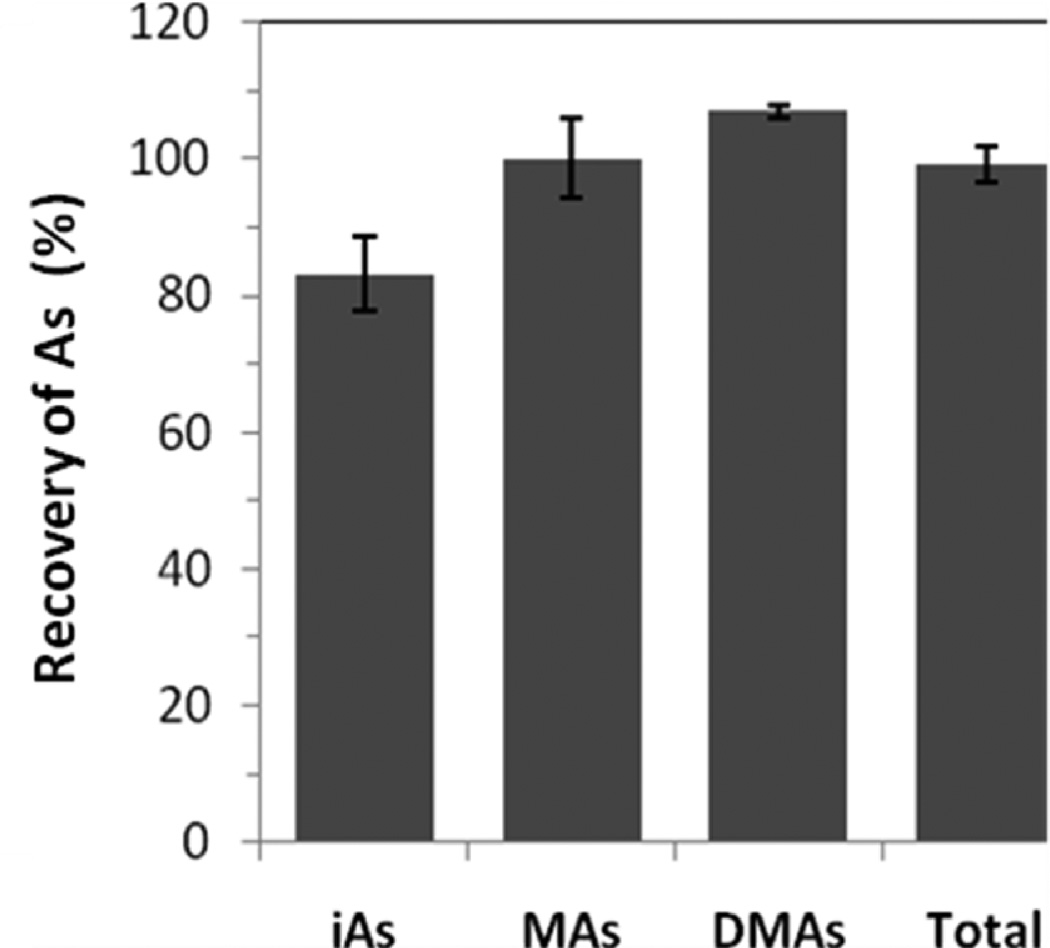
Finally, we used HG-CT-AAS to determine the concentrations of As species in the liver of a mouse exposed to iAsIII in drinking water (50 mg As/L) for 9 days. Here, the freshly dissected liver was divided into 4 sections. Each section was homogenized in ice-cold DIW. Aliquots of the 10% homogenates were immediately analyzed for AsIII species (without l-cysteine pretreatment) and for AsIII+V species (after pretreatment with l-cysteine). Additional aliquots from each liver section were digested in phosphoric acid for 10 h at 90 °C using the MARS5 microwave system.19 This digestion eliminates the biological matrix and oxidizes all trivalent As species to pentavalency.20 Thus, only the total iAs (iAsIII+V), MAs (MAsIII+V), and DMAs (DMAsIII+V) can be measured in the digested samples. Table 1 compares results of the direct speciation analysis and analysis of the digested homogenate from one of the liver sections. On the basis of the direct analysis, MAsIII and DMAsIII represented, respectively, 12% and 45% of the total speciated As, while their pentavalent counterparts, MAsV and DMAsV, accounted for 8% and 18%, respectively. Notably, the sums of tri- and pentavalent MAs and DMAs determined by the direct analysis were in a good agreement with the concentrations of MAsIII+V and DMAsIII+V determined in the digested homogenates. However, the amount of iAs recovered during the direct analysis represented only ~79% of iAs recovered after the digestion. Figure 2 shows the recoveries of iAs, MAs, and DMAs in directly analyzed homogenates from all 4 sections of the liver as compared to the analyses in digested homogenates. Here, the direct analysis recovered approximately 99% of total As, with individual recoveries of 83 ± 5% for iAsIII+V, 100 ± 6% for MAsIII+V, and 107 ± 1% for DMAsIII+V. Together with the data in Table 1, these results suggest high As recoveries and a good reproducibility of the speciation analysis in liver homogenates.
Table 1.
Concentration of As Species in One Section of the Liver (ng As/g of Tissue) from a Mouse Exposed to iAsIII in Drinking Water (50 ppm As) for 9 Daysa
| analysis of digested liver homogenateb |
direct analysis of fresh liver homogenatec |
||
|---|---|---|---|
| As species | ng As/g of tissue | ng As/g of tissue | % recoveryd |
| iAsIII | 151 ± 15 | ||
| iAsV | 158 ± 16 | ||
| iAsIII+V | 392 ± 12 | 309 ± 7 | 79 ± 3 |
| MAsIII | 220 ± 5 | ||
| MAsV | 143 ± 6 | ||
| MAsIII+V | 390 ± 1 | 363 ± 4 | 93 ± 1 |
| DMAsIII | 828 ± 11 | ||
| DMAsV | 324 ± 16 | ||
| DMAsIII+V | 1069 ± 10 | 1152 ± 11 | 108 ± 2 |
| total AsIII+V | 1851 ± 16 | 1824 ± 14 | 99 ± 1 |
Results of the direct analysis of fresh liver homogenate and the homogenate digested in phosphoric acid. A total of 9 aliquots of the homogenate prepared from 1 section of the liver was analyzed by HG-CT-AAS.
Three aliquots were microwave digested in phosphoric acid at 90 °C for 10 h and analyzed for AsIII+V species. (Mean ± SD are shown for n = 3.)
Six aliquots were analyzed directly: 3 aliquots were analyzed for AsIII species (without pretreatment), and 3 aliquots were analyzed for AsIII+V species after pretreatment with 2% l-cysteine. The concentrations of AsV species were calculated as the difference between the two measurements. (Mean ± SD are shown for n = 3 replicate measurements of the homogenate from 1 liver section.)
% recovery = (ng AsIII+V determined by the direct analysis/ng AsIII+V determined in the digested homogenate) × 100.
Figure 2.
Recovery of total speciated As during the direct analyses of fresh (undigested) homogenates prepared from 4 sections of the liver of a mouse exposed to iAsIII (50 ppm As) for 9 days (mean ± SD, n = 4). The homogenates were analyzed by HG-CT-AAS as described for Figure 1. The % recovery was calculated as (AsIII+V analyzed directly/AsIII+V after digestion) × 100.
In conclusion, this work shows that HG-CT-AAS is suitable for the quantitative, oxidation state specific analysis of As species, including the unstable MAsIII and DMAsIII, in mammalian tissues. Our data show that approximately 66% of As in the liver of a mouse exposed to iAs is represented by trivalent species; ~12% by MAsIII and ~45% by DMAsIII. These results further strengthen the hypothesis that methylated trivalent arsenicals contribute to the adverse effects in tissues targeted by iAs exposure. Additional optimization may be needed to improve recoveries of iAs, which are likely bound to high-affinity binding sites in tissue homogenates, and to prevent the oxidation of DMAsIII, which contributes to lower recoveries of this unstable As species.
Supplementary Material
Acknowledgments
Funding Sources
GIL grant 200710.0028; NIH grant DK056350, Czech Science Foundation grant 203/09/1783, and IAC ASCR project No. AV0Z40310501.
ABBREVIATIONS
- iAs
inorganic arsenic
- MAsIII
methylarsonite
- DMAsIII
dimethylarsinite
- MAsV
methylarsonate
- DMAsV
dimethylarsinate
- iAsIII
arsenite
- iAsV
arsenate
- AsIII
trivalent arsenic
- AsV
pentavalent arsenic
- HG-CT-AAS
hydride generation-cryotrapping-atomic absorption spectrometry
- DIW
deionized water
Footnotes
ASSOCIATED CONTENT
Supporting Information. Detailed experimental section including analytical procedures, characteristics of calibration curves, and detection limits. This material is available free of charge via the Internet at http://pubs.acs.org.
REFERENCES
- 1.Smedley PL, Kinniburgh DG. Appl. Geochem. 2002;17:517–568. [Google Scholar]
- 2.IARC Working Group on the Evaluation of Carcinogenic Risks to Humans. IARC Monogr. Eval. Carcinog. Risks Hum. 2004;84:1–477. [PMC free article] [PubMed] [Google Scholar]
- 3.Wang CH, Hsiao CK, Chen CL, Hsu LI, Chiou HY, Chen SY, Hsueh YM, Wu MM, Chen CJ. Toxicol. Appl. Pharmacol. 2007;222:315–326. doi: 10.1016/j.taap.2006.12.022. [DOI] [PubMed] [Google Scholar]
- 4.Navas-Acien A, Silbergeld EK, Streeter RA, Clark JM, Burke TA, Guallar E. Environ. Health Perspect. 2006;114:641–648. doi: 10.1289/ehp.8551. [DOI] [PMC free article] [PubMed] [Google Scholar]
- 5.Thomas DJ, Styblo M, Lin S. Toxicol. Appl. Pharmacol. 2001;176:127–144. doi: 10.1006/taap.2001.9258. [DOI] [PubMed] [Google Scholar]
- 6.Hernandez-Zavala A, Matousek T, Drobna Z, Paul DS, Walton F, Adair BM, Dedina J, Thomas DJ, Styblo M. J. Anal. At. Spectrom. 2008;23:342–351. doi: 10.1039/b706144g. [DOI] [PMC free article] [PubMed] [Google Scholar]
- 7.Devesa V, Maria DR, Adair B, Drobna Z, Waters SB, Hughes MF, Styblo M, Thomas DJ. J. Anal. At. Spectrom. 2004;19:1460–1467. [Google Scholar]
- 8.Valenzuela OL, Borja-Aburto VH, Garcia-Vargas GG, Cruz-Gonzalez MB, Garcia-Montalvo EA, Calderon-Aranda ES, Del Razo LM. Environ. Health Perspect. 2005;113:250–254. doi: 10.1289/ehp.7519. [DOI] [PMC free article] [PubMed] [Google Scholar]
- 9.Kenyon EM, Del Razo LM, Hughes MF, Kitchin KT. Toxicology. 2005;206:389–401. doi: 10.1016/j.tox.2004.08.003. [DOI] [PubMed] [Google Scholar]
- 10.Kenyon EM, Del Razo LM, Hughes MF. Toxicol. Sci. 2005;85:468–475. doi: 10.1093/toxsci/kfi107. [DOI] [PubMed] [Google Scholar]
- 11.Hernandez-Zavala A, Valenzuela OL, Matousek T, Drobna Z, Dedina J, Garcia-Vargas GG, Thomas DJ, Del Razo LM, Styblo M. Environ. Health Perspect. 2008;116:1656–1660. doi: 10.1289/ehp.11503. [DOI] [PMC free article] [PubMed] [Google Scholar]
- 12.Kenyon EM, Hughes MF, Adair BM, Highfill JH, Crecelius EA, Clewell HJ, Yager JW. Toxicol. Appl. Pharmacol. 2008;232:448–455. doi: 10.1016/j.taap.2008.07.018. [DOI] [PubMed] [Google Scholar]
- 13.Gong ZL, Lu XF, Cullen WR, Le XC. J. Anal. At. Spectrom. 2001;16:1409–1413. [Google Scholar]
- 14.Suzuki KT, Mandal BK, Ogra Y. Talanta. 2002;58:111–119. doi: 10.1016/s0039-9140(02)00260-6. [DOI] [PubMed] [Google Scholar]
- 15.Sampayo-Reyes A, Zakharyan RA, Healy SM, Aposhian HV. Chem. Res. Toxicol. 2000;13:1181–1186. doi: 10.1021/tx000154s. [DOI] [PubMed] [Google Scholar]
- 16.Del Razo LM, Styblo M, Cullen WR, Thomas DJ. Toxicol. Appl. Pharmacol. 2001;174:282–293. doi: 10.1006/taap.2001.9226. [DOI] [PubMed] [Google Scholar]
- 17.Matousek T, Hernandez-Zavala A, Svoboda M, Langrova L, Adair BM, Drobna Z, Thomas DJ, Styblo M, Dedina J. Spectrochim. Acta, Part B At. Spectrosc. 2008;63:396–406. doi: 10.1016/j.sab.2007.11.037. [DOI] [PMC free article] [PubMed] [Google Scholar]
- 18.Raab A, Meharg AA, Jaspars M, Genney DR, Feldmann J. J. Anal. At. Spectrom. 2004;19:183–190. [Google Scholar]
- 19.Hughes MF, Edwards BC, Herbin-Davis KM, Saunders J, Styblo M, Thomas DJ. Toxicol. Appl. Pharmacol. 2010;249:217–223. doi: 10.1016/j.taap.2010.09.017. [DOI] [PubMed] [Google Scholar]
- 20.Hughes MF, Devesa V, Adair BM, Styblo M, Kenyon EM, Thomas DJ. Toxicol. Appl. Pharmacol. 2005;208:186–197. doi: 10.1016/j.taap.2005.02.008. [DOI] [PMC free article] [PubMed] [Google Scholar]
Associated Data
This section collects any data citations, data availability statements, or supplementary materials included in this article.


