

Abstract
Laser capture microdissection (LCM) is a useful method to isolate specific cells or cell layers of interest from heterogeneous tissues, such as the retina. The collected cells can be used for DNA, RNA, or protein analysis. We have applied LCM technology to isolate cells from the outer nuclear, inner nuclear, and ganglion cell layers of the retina for mRNA and microRNA (miRNA) expression and epigenetic (DNA methylation) analysis. Here, we describe the methods we have employed for sample preparation, LCM-based isolation of retinal layers, RNA/DNA extraction, RNA quality check, microRNA analysis by quantitative PCR, and DNA methylation analysis by bisulfite sequencing.
Keywords: Laser capture microdissection, Retina, Gene expression, microRNA, Epigenetics, Quantitative PCR, RNA extraction, DNA methylation, Bisulfate sequencing
1. Introduction
Laser capture microdissection (LCM) is a microscope-based technology that can be used to dissect specific cells, or groups of cells, of interest from sectioned tissues with infrared- or UV laser beam-mediated tissue cutting (1). The technology is flexible, allowing cell collection under the microscope with objectives ranging from ×4 up to ×65. This enables isolation of not only large areas of tissue sections containing mixed cell populations, but also isolation of specific cell types and even single cells. These features of the LCM are especially valuable for the isolation of specific cells from heterogeneous tissues, such as the retina. Cells can be stained to discern specific cell types, or transgenic mice carrying cell type-specific fluorescent reporters can also be used. In combination with genomic and proteomic technologies, LCM allows the study of molecular mechanisms in specific cells or specific groups of cells. Fluorescence-activated cell sorting (FACS) provides another technology for isolation of specific cell types for downstream analysis, but it does not have the ability to utilize cell morphology as a section criterion, nor does it allow the selection of spatially associated clusters of cells.
The retina is composed of well-organized and stratified layers of cells and intervening synaptic areas. The cell bodies of retinal cells reside in the outer nuclear layer (ONL), inner nuclear layer (INL), and ganglion cell layer (GCL). Each layer is composed of one or more specific cell types. LCM can be a potent tool for the isolation of specific retinal cell layers and subsequent molecular analysis. Nuclear staining facilitates clear discrimination of each layer, which helps to avoid unwanted contamination of cells from other layers.
In this chapter, we describe the approaches and detailed LCM methods that we have been using to study murine retinal cell/layer-specific mRNA and microRNA (miRNA) expression and DNA methylation patterns (2, 3). We describe the methods designed to maintain RNA quality, and to prepare retinal samples, laser-microdissect the cells, and quantify expression levels using quantitative PCR (qPCR). We also describe the use of LCM for epigenetic analysis (4, 5), specifically for studying differential DNA methylation in the retinal layers. In addition to the retina-related material provided in this chapter, the reader may also find useful some of the available references on different aspects of general LCM methodology (6–8).
2. Materials
2.1. Tissue Preparation and Laser Microdissection
Dissecting tweezers and scissors.
PBS buffer: RNase free.
Sucrose.
Tissue-Tech OCT compound (Ted Pella).
Cryostat.
PEN foil slides (Leica Microsystems).
DEPC water.
Ethanol.
Mayer's hematoxylin.
200- μl Tubes.
LCD system.
TRIzol (Invitrogen).
2.2. RNA Extraction and cDNA Synthesis
Chloroform.
Microcentrifuge.
Isopropyl alcohol.
Agilent 2100 Bioanalyzer (Agilent Technologies).
Agilent RNA 6000 Pico kit (Agilent Technologies).
NCode™ miRNA First-Strand cDNA Synthesis Kit (Invitrogen).
ATP.
Poly A Polymerase.
RNase-free microcentrifuge tube.
Water bath/heating block with temperature control.
miRNA-specific or control-specific reverse primer.
2× SYBR® Green master mix (Bio-Rad).
2.3. DNA Methylation Analysis
QiaAmp DNA Micro Kit (Qiagen) or the AllPrep DNA/RNA Micro Kit (Qiagen).
QiaAmp DNA Micro Kit (Qiagen).
EZ DNA Methylation-Gold Kit (Zymo Research).
mM dNTPs (Fermentas, Thermo Fisher Scientific).
PCR: JumpStart REDTaq (Sigma-Aldrich).
MinElute Gel Extraction Kit (Qiagen).
ContigExpress of Vector NTI Advance 10 (Invitrogen).
TOPO-TA Cloning Kit for Sequencing (Invitrogen).
SOC medium (Invitrogen).
Warm LB shaker (Fisher Scientific).
50 mg/ml Kanamycin (Sigma-Aldrich).
PyroMark Q24 pyrosequencer (Qiagen).
PyroMark Assay design software (Qiagen).
HotStar Taq Polymerase (Qiagen).
PyroMark Q24 Vacuum Prep Tool (Qiagen).
Streptavidin Sepharose HP beads (Amersham Biosciences).
Annealing Buffer (Qiagen).
PyroMark Q24 Pyrosequencing System (Qiagen).
Binding Buffer (Qiagen).
3. Methods
3.1. Sample Preparation
Enucleate the eye and remove the muscles with tweezers and scissors (see Note 1) (we use predominantly mouse eyes for our studies, but these methods could be adapted for use with other species).
Cryoprotect the eye in increasing concentration of sucrose in the following gradient: 5% sucrose/PBS, 10% sucrose/PBS, 20% sucrose/PBS, and 25% sucrose/PBS. In each condition, the eye should be immersed in the sucrose buffer at 4°C for 30 min or until the eye sinks to the bottom of the tube.
Immerse the eye in 25% sucrose in PBS/OCT compound mixture at the ratio of 2:1 for 1 h at 4°C.
Snap-freeze the eye in fresh 25% sucrose in PBS/OCT compound mixture on dry ice and store it at −80°C until use.
3.2. Laser Capture Microdissection
Cut frozen sections at 7–10 μm with a cryostat and mount them on PEN foil slides. Proceed to step 2 as soon as possible (see Note 2).
-
Stain the sections on ice unless otherwise mentioned as follows (see Note 3):
Fix the sections in 70% ethanol for 30 s.
Wash in DEPC water for 30 s.
Stain the sections in Mayer's hematoxylin for 10–30 s at room temperature.
Wash in DEPC water for 30 s.
Wash in 95% ethanol for 30 s.
Wash in 100% ethanol for 30 s.
Air-dry for 1–2 min.
During the air-dry, prepare the sample collection tubes (into the cap of a 200-μl tube, add 35 μl of lysis buffer TRIzol, see Note 4) and set them onto the microscope.
Microdissect the cells under the LCM microscope through provided software according to the manufacturer's instruction (see Note 5). Figure 1 shows sample images of what sections look like before and after microdissection.
Complete the dissection within 1 h because of the risk of RNA degradation (see Note 6).
Store the collected cells at −80°C until RNA extraction (see Note 7).
Fig. 1.
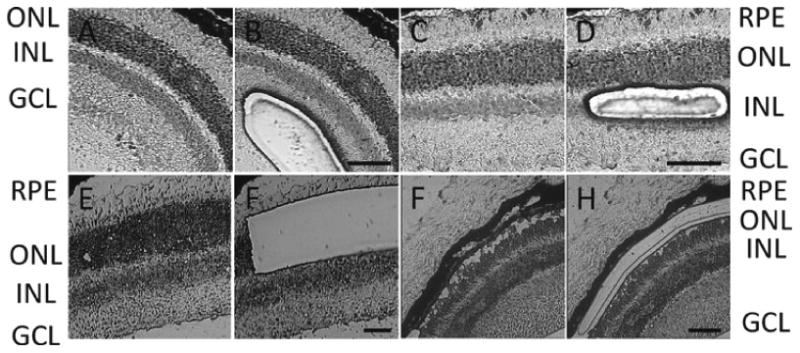
Laser capture microdissection of the mouse retina. Cells from the ganglion cell layer (GCL) (a, b), inner nuclear layer (INL) (c, d), outer nuclear layer (ONL) (e, f), and retinal pigment epithelium (RPE) (g, h) were collected by LCM. Figures show section appearance before (a, c, e, g) and after (b, d, f, h) microdissection. The size bar represents 50 μm.
3.3. RNA Extraction and RNA Quality Control
Thaw the collected samples on ice and increase its volume to at least 100 μl with the used lysis buffer (see Note 8).
Add 20 μl of chloroform to separate the aqueous and organic phases (see Note 9).
Shake tubes vigorously by hand for 15 s and incubate them at room temperature for 2–3 min.
Centrifuge the samples at 12,000 × g for 15 min at 4°C.
Following centrifugation, remove the colorless upper aqueous phase. Do not take the complete colorless phase, only approximately 60–70%, and make sure not to touch the interphase.
Transfer the aqueous phase to a fresh tube and precipitate the RNA with 50 μl of isopropyl alcohol.
Mix the contents of the tube and incubate the samples for 10 min at room temperature.
Centrifuge the samples at 12,000 × g for 10 min at 4°C. The RNA precipitates to the bottom or lower side of the tube which is invisible due to its amount.
Remove the supernatant. Wash the RNA pellet once with 500 μl of 75% ethanol. Mix the sample by vortexing.
Centrifuge at 7,500 × g for 5 min at 4°C.
Remove the supernatant. Let the tube dry and dissolve the purified RNA in 10 μl of DEPC water.
RNA quality can be analyzed using an Agilent 2100 Bioanalyzer if an adequate amount of RNA is collected with LCM. We have used the Agilent RNA 6000 Pico kit for low RNA quantities. Typically, 1 μl of the collected samples is assessed on the chips (see Note 10).
3.4. cDNA Synthesis
There are two major strategies that are commonly used for template cDNA synthesis in the case of miRNAs. One is to prepare a “universal” cDNA sample which can be used to measure all expressed transcripts, or alternatively one can synthesize miRNA-specific cDNA which is enriched for the miRNA of interest after the reverse transcription step.
3.4.1. Universal cDNA Synthesis
The following method uses the NCode™ miRNA First-Strand cDNA Synthesis Kit with some modifications and can be used when the isolated total RNA is at least 10 ng (see Note 11).
Poly(A) Tailing
Dilute the stock ATP solution based on the quantity of RNA available according to the following formula: ATP dilution factor = 10,000/___ ng of total RNA.
Each reaction requires 0.25 μl of Poly A Polymerase. To avoid pipetting 0.25 μl of enzyme, dilute 1 μl fourfold (1 μl of enzyme with 3 μl of DEPC water) and use 1 μl in the reaction. If multiple samples are transcribed, create a master mix with the common components without diluting the enzyme.
-
Add the following at room temperature to at least 10 ng total RNA:
2.5 μl of 5× miRNA reaction buffer
1.25 μl of 25 mM MnCl2
1 μl of diluted ATP (from step 1)
1 μl of Poly A Polymerase (from step 2)
DEPC-treated water to 12.5 μl
Mix gently and centrifuge the tube briefly to collect the contents.
Incubate the tube in a heat block or water bath at 37°C for 15 min. After incubation, proceed immediately to the first-strand cDNA synthesis.
First-Strand cDNA Synthesis
-
Add the following to an RNase-free microcentrifuge tube:
4 μl of polyadenylated RNA
1 μl of annealing buffer
3 μl of universal RT primer (25 μM)
Incubate the tube at 65°C for 5 min.
Place the tube on ice for 1 min.
-
Add the following to the tube, for a final volume of 20 μl:
10 μl of 2× First-Strand Reaction Mix
2 μl of SuperScript™ III RT/RNaseOUT™ Enzyme Mix
Spin the tube briefly to collect the contents.
Transfer the tube to a thermal cycler preheated to 50°C and incubate for 50 min.
Incubate at 85°C for 5 min to stop the reaction.
Chill the reaction on ice. Store samples at −20°C or proceed directly to qPCR. Figure 2 shows an example of qPCR analysis with marker genes for the different retinal cell layers, demonstrating that strong layer-specific signals can be obtained with minimal contamination from other layers.
Fig. 2.
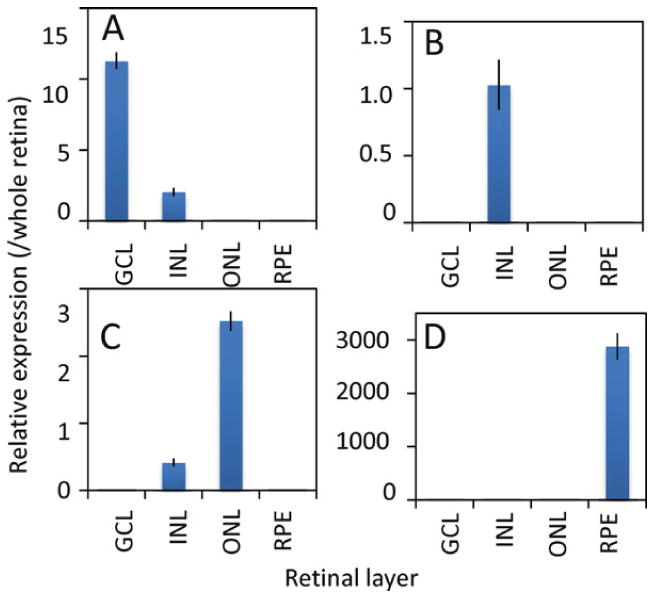
QPCR analysis of marker gene expressions in microdissected retinal layers. To evaluate cross-contamination, qPCR was carried out for marker genes known to be preferentially expressed in the GCL (a, Thy1), INL (b, Chx10), ONL (c, Crx), and RPE (d, RPE65) of microdissected mouse retina. Expression of each gene was normalized to Gapdh and then expressed as relative expression compared to whole retina. Note that Crx, although predominantly expressed in photoreceptors, is also expressed in bipolar cells of the INL.
3.4.2. Transcript-Specific cDNA Synthesis
This method is the appropriate choice in most cases when the isolated RNA is below 10 ng (see Note 12).
-
In an RNase-free tube, combine:
1–10 ng of template total RNA
2 μl of 5× RT Reaction buffer
2 μl of miRNA-specific or control-specific reverse primer
0.5 μl of 10 mM dNTP mix
0.5 μl of RNase inhibitor (10 U)
0.5 μl of reverse transcriptase (20 U)
DEPC water to 10 μl total volume
Gently mix the contents of the tube and spin down.
Incubate for 30 min at 50°C followed by heat inactivation of the reverse transcriptase for 5–10 min at 85°C.
Store samples at −20°C.
3.5. miRNA Analysis by qPCR (See Note 13)
-
Combine the following for each reaction:
2 μl of 10× diluted cDNA template
10 μl of 2× SYBR® Green master mix
1 μl of miRNA specific forward primer (see Note 14)
1 μl of Universal PCR primer
DEPC water to 20-μl total volume
Run qPCR with optimized annealing temperature for each miRNA (or mRNA) (see Note 15). If the instrument used is able to run a post-cycling melting curve analysis, it is desirable to check assay specificity by including this step.
3.6. Bisulfite Sequencing for DNA Methylation Analysis
3.6.1. Isolate DNA Using the QiaAmp DNA Micro Kit
Genomic DNA for bisulfite sequencing is isolated using either the QiaAmp DNA Micro Kit or the AllPrep DNA/RNA Micro Kit.
Microdissect the desired cells into 15 μl of Buffer ATL in a 0.2-ml tube (see Notes 16 and 17). The cells can be stored in the buffer at −80°C until you are ready to isolate the DNA.
Follow the steps as listed for “Isolation of Genomic DNA from Laser-Microdissected Tissues” in the kit manual. Elute the DNA with 20 μl of Buffer AE. As suggested in the last step, incubate the column with Buffer AE for 5 min at room temperature before centrifugation to increase DNA yield.
3.6.2. Isolate DNA Using the AllPrep DNA/RNA Micro Kit
Microdissect the desired cells into 28 μl of Buffer RLT Plus. The cells can be stored in the buffer at −80°C until you are ready to isolate the RNA and DNA. Multiple dissections can be combined prior to isolation of nucleic acid up to 350 μl.
Follow the steps as listed for “Simultaneous Purification of Genomic DNA and Total RNA from Microdissected Cryosections” in the manufacturer's instructions. Elute the DNA with 20 μl of Buffer EB (preheated to 70°C).
3.6.3. Bisulfite Conversion of DNA
Bisulfite modification of DNA creates sequence differences by converting unmethylated cytosines to uracil, leaving methylated cytosines unchanged (9). Methylation state is proportionately represented by presence of C versus T residues, as determined by DNA sequencing, after PCR amplification.
Bisulfite modification of genomic DNA is performed using the EZ DNA Methylation-Gold Kit, according to the manufacturer's instructions (see Note 18) with the modifications described below.
After the 64°C step is complete and the temperature has reached 4°C, complete the rest of the protocol immediately. Do not store the sample at 4°C for up to 20 h as suggested by the manufacturer.
Elute the column twice with 10 μl of M-Elution buffer instead of the suggested 10 μl. For each elution, the column is incubated for 10 min at room temperature prior to centrifugation. Pool and divide the 20 μl into four aliquots and freeze at −80°C. Bisulfite treatment is harsh, and converted DNA is prone to degradation, which is accelerated by freeze–thaw cycles. Use 1 μl per reaction below.
3.6.4. Bisulfite Sequencing by Direct Sequencing or Cloning
Identify a 200–300-bp region to be sequenced. In our experience, regions of more than 350 bp do not amplify efficiently and are more prone to PCR bias.
Copy and paste the genomic sequence (with 100 bp on either side of your identified region) into the Web-based MethPrimer program that identifies CpG sites and CpG islands (10). This program will design primers designed to specifically amplify bisulfite-modified genomic DNA and will include sequence that contains C not followed by G (represented by T in the primers to selectively amplify only bisulfite-modified DNA) and avoid regions that contain CpG (see Note 19).
-
For PCR amplification using the primers from MethPrimer, combine the following for each reaction:
3 μl of 10× PCR buffer
0.6 μl of 10 mM dNTPs 1.2 μl of Forward Primer (10 μM)
1.2 μl of Reverse Primer (10 μM)
1.2 μl of JumpStart REDTaq
21.8 μl of DEPC water
1 μl of bisulfite-converted genomic DNA
Run the PCR amplification with the optimized annealing temperature (X°C) with the following cycling conditions: 94°C for 1 min for initial denaturation followed by 40 cycles of 94°C for 30 s, X°C for 30 s, 72°C for 1 min, and a final elongation of 72°C for 10 min, followed by incubation at 4°C (short term) or 20°C (long term).
Visualize 10–20 μl of each reaction on a 2% agarose gel to confirm a single product of the appropriate size.
For direct sequencing, agarose gel-purify the PCR product (MinElute Gel Extraction Kit) and directly sequence using the forward primer. Using the ContigExpress function of Vector NTI Advance 10, the chromatograph peak heights for T and C at each CpG site can be measured and the log10 [T peak height (unmethylated)/C peak height (methylated)] versus CpG position with respect to the transcription start site was plotted. CpG sites with log10 (U/M) > 1 have a relative lack of methylation and CpG sites with log10 (U/M) < 1 are relatively methylated.
-
Alternatively, sequencing of individual clones after PCR amplification can be performed using the TOPO-TA Cloning Kit for Sequencing.
-
Combine the following (see Note 20):
0.5–2 μl of fresh (see Note 21) PCR product, depending on the band intensity
0.5 μl of salt solution
0–1.5 μl of DEPC water
0.5 μl of pCR™4-TOPO® TA vector in a total volume of 3 μl
Incubate at room temperature for 5 min and then place the reaction on ice.
-
Transform One Shot® TOP10 Chemically Competent Escherichia coli as follows:
Prechill microfuge tubes and thaw competent cells on ice.
Transfer 25 μl of competent cells (half of each tube of cells) to the prechilled microfuge tube.
Add 2 μl of this ligation mix to a tube of competent cells, and flick gently by hand (do not mix by pipette).
Incubate on ice for 5 min.
Heat shock cells at 42°C for 30 s and immediately transfer to ice.
Add 125 μl of SOC medium and shake at 200 rpm at 37°C for 1 h.
Warm LB + 50 mg/ml kanamycin (Sigma-Aldrich) plates for 30 min before plating cells.
Plate 50–100 μl of each transformation and let the plate dry on the bench.
Incubate overnight at 37°C.
The following day, pick colonies for sequencing and analyze by colony PCR, if necessary, prior to sequencing using the M13 reverse primer. Typically, ten clones per sample per sequence are averaged. BiQ Analyzer is a good software tool for analysis, visualization, and quality control of bisulfite sequencing data (11).
-
3.6.5. Bisulfite Sequencing by Pyrosequencing
We use the PyroMark Q24 pyrosequencer, which is based upon the principle of sequencing by synthesis and provides quantitative methylation data at each CpG site (12). Up to 24 samples can be analyzed in parallel.
Using the PyroMark Assay design software, paste in the sequence of interest and highlight the target region. The chosen target region should only encompass about 20 bases for the easiest assay design (see Note 22).
Perform PCR optimization with the forward (biotinylated, HPLC purified) and reverse primers, with HotStar Taq Polymerase and additional MgCl2 when necessary according to the manufacturer's protocol. For each PCR, 1 μl of bisulfite-converted DNA should be sufficient.
Run 5 μl of product from a 30-μl PCR reaction on a 2% agarose gel to ensure that a single product of the expected size is present.
If a reasonable intensity band is visualized on the gel, use 10 μl of PCR product in the pyrosequencing reaction. In the case of inefficient PCR amplification, up to 20 μl of product can be used.
Purify the biotinylated PCR product and make it single stranded with PyroMark Q24 Vacuum Prep Tool, following manufacturer's direction. During this step, the PCR product is bound to Streptavidin Sepharose HP beads, purified, washed, denatured using a 0.2 M NaOH solution, and washed again as per the manufacturer's protocol.
Anneal 0.3 μM of pyrosequencing primer to the purified single-stranded PCR product in Annealing Buffer.
Perform pyrosequencing using the PyroMark Q24 Pyrosequencing System.
If needed, design the additional sequencing primers using the PyroMark Assay design software, fix the original forward and reverse primers, set a new target region, and repeat the assay design. With a single sequencing primer, 40–60 bp can usually be sequenced. If more sequence is desired, a serial pyrose-quencing assay can be performed (13). In this case, the same PCR product is sequenced with different sequencing primers to cover a longer region of interest.
Run serial pyrosequencing reactions by adding 20 μl of Binding Buffer to each well of a plate immediately after the initial run has been performed, followed by the 10-min incubation with shaking and the usual vacuum prep workstation protocol (see Note 23).
Acknowledgments
The work described in this chapter was supported by grants from the National Eye Institute, NIH (5R01EY009769, 5P30EY001765, and 5R01EY020406), and by generous gifts from the Guerrieri Family Foundation and from Mr. and Mrs. Robert and Clarice Smith.
Footnotes
For the mouse pups, earlier than postnatal day 10, we generally cryoprotect the eyes as part of the whole head. The head is decapitated right below the upper jaw, and the eyelids are removed to directly expose the eyes to the buffer.
Once slides are prepared, they should be used as soon as possible. However, in our lab, we have tested the RNA quality obtained from fresh versus stored slides (−80°C in sealed box with desiccant), and did not observe a significant difference in quality.
One can wash for a shorter period of time in each step, but this is a trade-off between RNA quality and stress-free laser dissection. One should proceed to the next step as soon as possible due to the risk of RNA degradation, but inadequate washing of the section can lead to residual OCT compound on the section, which causes significant slowing of the LCM cutting process, and hence increases the risk of reduced RNA quality and quantity.
The method of RNA extraction must be decided prior to microdissection. In our LCM experiments, we collect samples directly into tubes containing lysis buffer (35 μl). For miRNA analysis, we collect into TRIzol. It is useful to check the evaporation rate of one's chosen lysis buffer before use. Extended cutting times (over 1 h) may reduce the volume of the buffer, changing its properties, which may result in degraded samples or low yield.
For fine cutting, one should adjust the laser power according to the section thickness and the characteristics of the layer being cut. High-power laser output burns the cells along the edge of the cut.
Longer exposure of sections to ambient temperature causes significant loss of intact RNA. First, check how long you take to finish one section to estimate how many sections you can put on one slide. For qPCR using cDNA templates synthesized with random hexamers, you can extend the dissection time somewhat as partial degradation of mRNA length is less of a problem than with oligo-dT primed cDNA.
Samples may be stored in TRIzol for a few days at −80°C, but it is recommended to process them as soon after cutting as possible.
We decided to use TRIzol for isolation because it captures all types of RNA from the samples, including the miRNA and mRNA fractions. We found this useful when expression of intronic miRNAs was compared to that of their host genes, which we could achieve from the same sample (2). Also the lack of a miRNA enrichment step helps ensure that a complete miRNA fraction is collected. If small RNA enrichment is necessary, it can follow the TRIzol-based purification.
The manufacturer's protocol uses 200 μl of chloroform for phase separation for each milliliter of TRIzol used; we use 20 for 100 μl of TRIzol and 1/10 of other volumes indicated (except for the washing of the precipitated RNA pellet, for which we use 500 μl of 75% ethanol).
Generally, it is difficult to assess RNA quality from LCM samples due to the limited amount of RNA that is collected. In our experience, a BioAnalyzer run is useful with samples that contain at least 1 ng of total RNA. In that case, visual inspection of the 5S, 18S, and 28S ribosomal RNA peaks or use of the RNA integrity number (RIN) gives an estimation of RNA integrity (14). With LCM samples containing less than 1 ng of total RNA, we generally do not assess RNA integrity. As one rough method to assess cDNA quality when amounts are limiting, a qPCR run with known primers for a highly and constitutively expressed gene can be used. In case of miRNAs, it is safe to assume that RNases would digest larger transcripts with greater probability (e.g., mRNA) than mature miRNAs with 18–22-nucleotide length. Hence, moderately degraded samples should still yield acceptable miRNA expression results (see http://www.abrf.org/Other/ABRFMeetings/ABRF2011/RG%20Presentions/SChittur-STighe_R5a.pdf).
Due to the short length of mature miRNAs and the lack of a polyadenylated tail, the priming step of the reverse transcription step provides a challenge. The former prevents random priming while the latter prevents the use of oligo-dT to initiate the reaction. For universal cDNA synthesis, in the first step, a polyadenylated tail is generated on the 3′ end of each transcript by addition of poly A polymerase and ATP. In the second step, the resulting tailed transcript is primed with a modified oligo-dT primer that carries a specific overhang that is a unique sequence that will serve as a general priming site in the following qPCR reaction. The amplification is then carried out with a miRNA-specific forward primer and a universal reverse primer. Despite the short length of miRNAs, the resulting amplicon is in the range of 80–90 bp, which is close to the preferred amplicon length for qPCR. The major advantage of this method is that from one cDNA sample multiple miRNAs can be assayed. In this approach, the major limit is the sample quantity itself (preferably the input total RNA should be above 10 ng). One but significant drawback of the universal cDNA method, however, is that its sensitivity is not always adequate for LCM samples. Only abundant miRNAs can be measured with great confidence. This approach is often the method of choice when dozens of miRNAs have to be investigated from a limited amount of material. When needed, sensitivity can be improved through the use of locked nucleic acid (LNA)-enhanced oligonucleotides in a slightly different method when not only the forward but also the reverse primer contain a short miRNA-specific sequence (see Note 12).
Alternatively, a transcript-specific cDNA can be generated by miRNA-specific RT primers. One method is to use the miR-CURY LNA™ microRNA PCR System from Exiqon. Generally, 1 ng of total RNA should be used, but it may work with less (10–100 pg) in the case of abundant miRNAs (see Note 11). The primers used contain the reverse complement of the last few nucleotides at the 3′ end of the given miRNA, reducing significantly the subset of transcripts that are copied, and thereby enriching for the desired transcripts. The RT primer also contains a unique sequence for priming during amplification, while an miRNA-specific oligo (which usually covers the full length of the mature miRNA) serves as the forward primer. The major advantage of this approach is improved sensitivity over the universal cDNA method, while the most significant disadvantages are the increased labor, sample, and reagent requirements. For each investigated miRNA, a different RT reaction is needed which can also lead to increased technical variation, which may be decreased through the use of master mixes where possible and precise pipetting. This method may be preferred in the case of a rare target and when the number of miRNAs to investigate is low. It can complement the universal cDNA method or serve as a backup when it fails.
There are two choices of sample preparation before template synthesis for qPCR. One is to enrich the small RNAs from the collected samples, and the other is to measure miRNA expression from total RNA. Depending on the downstream protocol used, enrichment may be necessary. qPCR analysis of miRNAs follows the same steps as when one measures mRNA levels in a sample. After reverse transcription to generate template cDNA, specific forward and reverse primers are used for amplification. The same simple method of SybrGreen detection can be applied to follow the amplification, and depending on the qPCR instrument, reaction quality can be assessed by melting curve analysis.
miRNA-specific forward primers have to be designed and ordered separately if one uses the universal cDNA method. Usually, it is the same sequence as the mature sequence of the miRNA of interest. In case of the miRNA-specific cDNA method, these primers are included in pairs with the appropriate primers for the reverse transcription step.
Once the template cDNA is synthesized, it is useful to test the resulting cDNA with a primer set for a transcript that could later serve as a normalizing control (in the case of the universal cDNA method). Usually, 5S rRNA or U6 snRNA can be used for these purposes. It is recommended to use more than one “housekeeping” gene to avoid normalization problems associated with differential expression of a particular “housekeeping” gene. miRNA qPCR assays should be optimized similarly to regular qPCR assays. Optimal primer concentration, annealing temperature, and cDNA dilution should be determined. It is also recommended to check assay linearity and efficiency by obtaining a standard curve with each assayed primer set. Data analysis should proceed as with regular qPCR.
If you are just dissecting cells for DNA, you can dissect for longer than 1 h because of the greater stability of DNA. However, depending on the humidity of the room, you will periodically need to add 15 μl of nuclease-free water to the cap as the fluid will slowly evaporate.
The number of sections you dissect depends upon the desired cell type and species. Typically, 14–16 cryosections of a mouse eye will fit on one PEN foil slide.
The CT Conversion Reagent is designed for ten reactions. Although once prepared, the instructions say that the solution can be stored for 1 week at 4°C or up to 1 month at −20°C, we use the reagent the same day and discard any leftover.
As a first pass, try the default parameters for primer selection. However, by manipulating the target, excluded region, product size, and product CpGs, you can often direct primer design to a particular region. Occasionally, in a very dense CpG island or in a region that results in long strings of T's after bisulfite conversion, primer design or efficient sequencing is impossible.
The TOPO TA Cloning manual (Invitrogen) recommends setting up a 6-μl final volume cloning reaction. We have found that we get satisfactory results using a reaction volume of 3 μl, which enables twice the number of cloning reactions from each kit.
The TOPO TA Cloning kit relies on a standard PCR product having single 3′ adenine overhangs. If your Taq polymerase is a proofreading polymerase, if you plan to store your samples before cloning, or if you need to gel-purify your PCR product after amplification, you will need to add 3′ adenines as described in the manual under “Addition of 3′ A-Overhangs Post-Amplification.”
The analysis target region can be expanded after suitable primers have been found. To avoid incorporating CpG sites in primer sequences, ensure that the “allow primer over variable position” is turned off under “Assay Settings.” Bisulfite PCR products should be no larger than 350 bp to enable efficient amplification. In our experience, assays with scores of 65 or greater as determined by the PyroMark Assay design software work effectively. If primers cannot be designed in your target region, try using the reverse strand, shortening the target region (design a serial pyrosequencing reaction to compensate) or, if the sequencing primer indicates that self-annealing is possible, the addition of a ∼2 mismatched bases at the 5′ end may prevent self-annealing.
The overall signal may be lower in a serial pyrosequencing reaction.
References
- 1.Curran S, McKay JA, McLeod HL, Murray GI. Laser capture microscopy. Mol Pathol. 2000;53(2):64–68. doi: 10.1136/mp.53.2.64. [DOI] [PMC free article] [PubMed] [Google Scholar]
- 2.Hackler L, Jr, Wan J, Swaroop A, Qian J, Zack DJ. MicroRNA profile of the developing mouse retina. Invest Ophthalmol Vis Sci. 2010;51(4):1823–1831. doi: 10.1167/iovs.09-4657. [DOI] [PMC free article] [PubMed] [Google Scholar]
- 3.Wahlin KJ, Hackler L, Jr, Adler R, Zack DJ. Alternative splicing of neuroligin and its protein distribution in the outer plexiform layer of the chicken retina. J Comp Neurol. 2010;518(24):4938–4962. doi: 10.1002/cne.22499. [DOI] [PMC free article] [PubMed] [Google Scholar]
- 4.Kalantari M, et al. Laser capture microdissection of cervical human papillomavirus infections: copy number of the virus in cancerous and normal tissue and heterogeneous DNA methylation. Virology. 2009;390(2):261–267. doi: 10.1016/j.virol.2009.05.006. [DOI] [PMC free article] [PubMed] [Google Scholar]
- 5.Wu Y, Strawn E, Basir Z, Halverson G, Guo SW. Promoter hypermethylation of progesterone receptor isoform B (PR-B) in endometriosis. Epigenetics. 2006;1(2):106–111. doi: 10.4161/epi.1.2.2766. [DOI] [PubMed] [Google Scholar]
- 6.Arin MJ, Roop DR. Use of laser capture microscopy in the analysis of mouse models of human diseases. Methods Enzymol. 2002;356:207–215. doi: 10.1016/s0076-6879(02)56934-2. [DOI] [PubMed] [Google Scholar]
- 7.Espina V, et al. Laser-capture microdissection. Nat Protoc. 2006;1(2):586–603. doi: 10.1038/nprot.2006.85. [DOI] [PubMed] [Google Scholar]
- 8.Neira M, Azen E. Gene discovery with laser capture microscopy. Methods Enzymol. 2002;356:282–289. doi: 10.1016/s0076-6879(02)56941-x. [DOI] [PubMed] [Google Scholar]
- 9.Frommer M, et al. A genomic sequencing protocol that yields a positive display of 5-methylcytosine residues in individual DNA strands. Proc Natl Acad Sci USA. 1992;89(5):1827–1831. doi: 10.1073/pnas.89.5.1827. [DOI] [PMC free article] [PubMed] [Google Scholar]
- 10.Li LC, Dahiya R. MethPrimer: designing primers for methylation PCRs. Bioinformatics. 2002;18(11):1427–1431. doi: 10.1093/bioinformatics/18.11.1427. [DOI] [PubMed] [Google Scholar]
- 11.Bock C, et al. BiQ analyzer: visualization and quality control for DNA methylation data from bisulfite sequencing. Bioinformatics. 2005;21(21):4067–4068. doi: 10.1093/bioinformatics/bti652. [DOI] [PubMed] [Google Scholar]
- 12.Dupont JM, Tost J, Jammes H, Gut IG. De novo quantitative bisulfite sequencing using the pyrosequencing technology. Anal Biochem. 2004;333(1):119–127. doi: 10.1016/j.ab.2004.05.007. [DOI] [PubMed] [Google Scholar]
- 13.Tost J, El abdalaoui H, Gut IG. Serial pyrosequencing for quantitative DNA methylation analysis. Biotechniques. 2006;40(6):721–722. 724, 726. doi: 10.2144/000112190. [DOI] [PubMed] [Google Scholar]
- 14.Schroeder A, et al. The RIN: an RNA integrity number for assigning integrity values to RNA measurements. BMC Mol Biol. 2006;7:3. doi: 10.1186/1471-2199-7-3. [DOI] [PMC free article] [PubMed] [Google Scholar]