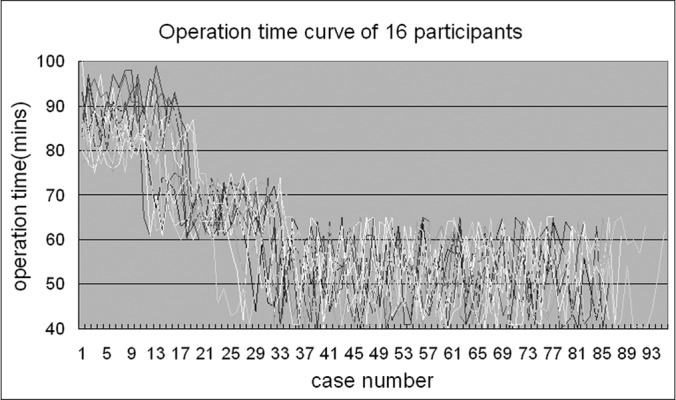
Figure 3.

These curves were drafted by all operation time data for the 16 participants of both groups, which visually showed there were 3 stages in the curves, not 2 stages as was previously thought.

These curves were drafted by all operation time data for the 16 participants of both groups, which visually showed there were 3 stages in the curves, not 2 stages as was previously thought.