

Abstract
Nucleic acid measurements are used to follow HIV-1 viral load in clinical applications while p24 ELISA is commonly used to monitor HIV-1 replication in research settings. Current ELISA assays are expensive and offer a narrow dynamic measurement range. This report describes a simple, sensitive and inexpensive bead-based assay offering a wide dynamic measurement range. This cytometric bead assay allows the detection of p24 concentrations over 4 orders of magnitude from less than 0.4 pg to up to 20,000 pg ml−1 in a volume of 50μl and can be combined with other measurements.
Keywords: HIV-1, p24, Detection, Multiplex assay, Diagnosis
The early diagnosis and the monitoring of HIV-1 infection in patients are paramount for the initiation and the evaluation of antiviral therapies. This is achieved by measuring viral nucleic acid with molecular techniques that have lowered the limit of detection from just below 50 RNA copies per ml of plasma down to the single viral genome (Maldarelli et al., 2007; Palmer et al., 2003). Such molecular assays require the isolation of nucleic acids, often from large sample volumes. The numerous stages involved and the instrumentation required for the extraction, the amplification, and the detection of the nucleic acid, preclude the use of molecular assays in resource poor settings (reviewed in Fiscus et al., 2006). In such settings, the early diagnosis of HIV infection relies widely on the measurement of the HIV-1 capsid protein p24 by ELISA (Fiscus et al., 2007). Similarly, in HIV experimental research, due to the large number of samples measured, it is often difficult to accommodate the costs of the detection of HIV-1 nucleic acids. Therefore, for routine monitoring of HIV-1 replication, the measurement of HIV-1 capsid p24 by ELISA has been adopted. This method requires a smaller sample volume and is less laborious than its molecular counterparts. Nonetheless, the ELISA method remains expensive and is often limited by a small dynamic range. Accurate analysis of ELISAs often necessitates the measurement of several sample dilutions in such a way that one or several dilutions fall within the dynamic range of the assay.
Because of these limitations, commercial p24 ELISAs belong to two groups (i) ultra sensitive assays that often use an amplification technique to lower their limit of detection (Fiscus et al., 2007; Respess et al., 2005; Sutthent et al., 2003; Tehe et al., 2006) and (ii) less sensitive assays that allow the measurement of samples with high concentrations of antigen. The ultra sensitive p24 assays allow the detection of low antigen concentrations, in the range of 0.2 through 100 pg ml−1 (Boni et al., 1997), while less sensitive assays allow detection above 1 ng ml−1 (NCI kit, VKP, CellBiolabs). Unfortunately, there is no p24 ELISA kit that combines a wide dynamic range with a high sensitivity. Such an assay has been developed and is described below. This assay relies on using beads coupled to a high affinity monoclonal antibody against HIV-1 p24 together with a non-overlapping monoclonal antibody coupled to phycoerythrine.
MicroPlex carboxymethylated microspheres region 42 (5.6μm in diameter, catalog number L100-C142-01, Luminex Corporation, Austin, TX) were coupled to a high affinity anti-p24 monoclonal antibody (catalog # 1103-clone 4F6, ImmunoDiagnostics, Inc., Woburn, MA). This region can be substituted with any other MicroPlex microspheres region. The coupling reaction was performed in a low protein-binding microcentrifuge tube (catalog # 1415-2500, USA Scientific, Ocala, FL). All centrifugations were performed at 8000×g for 2 min. Pelleted microspheres (12.5×10⁶) were resuspended in 160μl of 0.1M monobasic sodium phosphate pH 6.2, and were activated for 20 min by addition of 20μl of a freshly prepared 50 mg ml−1 solution of sulfo-N-hydroxysuccinimide (Pierce, Rockford, IL) in dH2O, and 20μl of 50 mg ml−1 solution of 1-ethyl-3-[3-dimethylaminopropyl]carbodiimide hydrochloride (EDC) in water. The activated microspheres were washed twice in PBS pH 7.4, pelleted and resuspended in 250μl of PBS pH 7.4. 100μl of 1 mg ml−1 solution of capture antibody diluted in PBS were added to the activated microspheres. The reaction volume was brought to a final volume of 1 ml with PBS pH 7.4 and the reaction was allowed to proceed for 2 h at RT, with gentle mixing on a thermomixer at 300 rpm. At the end of the coupling reaction, the microspheres were washed twice with 1ml of PBS, 0.1% BSA, 0.02% Tween-20, 0.05% azide, pH 7.4 (PBS–TBN) and resuspended in a volume of 1 ml of PBS–TBN. The microsphere concentration was determined by counting on an automatic hemacytometer (Cellometer AutoM10, Nexcelom Bioscience, Lawrence, MA). Once prepared, the microspheres are stable for extended periods of time, up to 3 years if properly stored and can be used in the cytometric assay described below.
All assay components were diluted in an assay buffer made of PBS–TBN supplemented with 0.1% normal mouse serum and 0.1% normal goat serum. The assay was performed in 96-well multiscreen filter plates (catalog # MSBVN1210, 1.2μm pore size, Millipore Corporation, Billerica, MA) pre-wetted with 100μl of PBS. The PBS was removed by vacuum suction using a vacuum manifold (catalog # MAVM0960R). 50μl of microsphere suspension at the concentration indicated in the text were added to each well of the pre-wetted plate. Samples and p24 standard (Alliance p24 Kit standard, PerkinElmer, Waltham, MA) were lysed by the addition of 10% volume of 10% Triton X 100 solution, and were diluted in assay buffer supplemented by 1% Triton × 100. 50μl of samples or standard dilution were added to the microspheres and were incubated for 1 h at 37 °C. The filter plates were washed twice with 200μl of PBS–0.02% Tween-20 by using the vacuum manifold. 100μl of the RD1-labeled anti-p24 KC57 antibody (catalog #6604667, Beckman Coulter, Miami, FL) diluted in assay buffer to the concentration of 0.5μg ml−1 were added to the beads and left for 1 h under agitation at RT. The plates were washed with 200μl of PBS–0.02% Tween-20 by vacuum application and the beads were finally resuspended in 150μl of assay buffer.
The beads were analyzed on a Luminex 100 controlled by the Bioplex manager software 4.1.1 (Bio-Rad, Hercules, CA) and at least 100 beads per well were analyzed. Fig. 1 illustrates the wide dynamic range and the high reproducibility of a typical assay run at 1200 beads per well (50μl of a 2.4×10⁴ beads ml−1 solution). The intra-assay variation gave CVs below 6.5% at all concentrations tested; the lower limit of detection of the assay illustrated in Fig. 1 was 0.43 pg ml−1 and the highest was 20,000 pg ml−1. The large dynamic range of the assay reflects the fact that the assay measures the fluorescence bound directly to each bead, as opposed to the measurement of a color resulting from an indirect and dynamic enzymatic reaction. The ability to measure individually the fluorescence bound to each microsphere renders the assay more accurate than assays that rely on a single measurement, as the calculations are based on the median of the data collected for 100 microspheres (or more), each behaving as an individual replicate. Hence, the inter assay variability is also low; four assays carried out over a period of a few days each in triplicate had interassay CVs between 14.77 and 4.14% (Fig. 2).
Fig. 1.
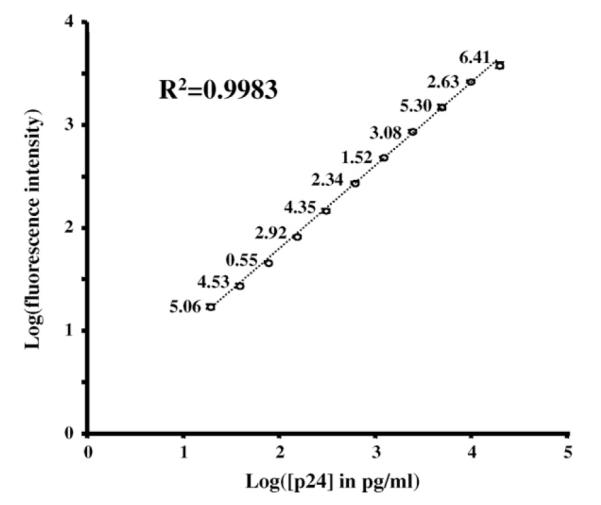
A typical p24 standard curve. The graph represents the individual points of a titration curve run in quadruplicate. The CV of the data is indicated above each data point. The coefficient of determination is calculated to fit a 4 parameter logistic regression.
Fig. 2.
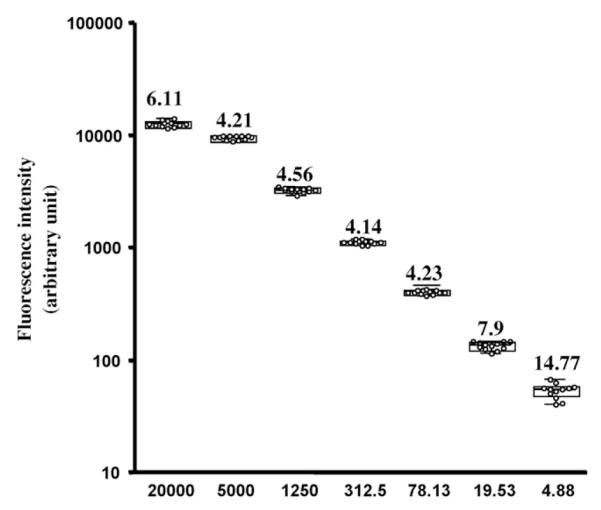
Inter assay variation.
The figure represents the inter assay variation calculated for 4 assays run in triplicates at different concentrations. For each concentration, all the data points (12 per concentration) are plotted together with the median, the interquartile box, and the range of the data. The number above each data point represents the CV of the results at the corresponding concentration.
The sensitivity of the assay can be modified by varying the number of beads used to capture p24: while a higher number of beads increases the upper limit of the assay range, decreasing the number of beads lowers the limit of detection by allowing the binding of more antigen per bead. An assay was carried out with four different bead concentrations, 4000, 2000, 1000 and 500 beads per well, each in triplicate. Statistical analysis (Prism 4, GraphPad software) of the four standard curves fitted by a logistic 4P regression revealed that all the fitted parameters were different at each bead concentration (P < 0.001) resulting in mid response (EC50) of the assay varying between 12,307 and 5,183 pg ml−1 for 4000 and 500 beads per assay, respectively.
Thus, by varying the quantity of beads used in the assay, the dynamic range of the dose response can be altered upwards or downwards. Compared to the dynamic range (6–12,500 pg ml−1) that has been reported for amplified ELISA monitored by a dedicated kinetic software (Giacomini et al., 1998), this cytometric assay offers a wider dynamic range while requiring smaller sample volume. In addition to its usefulness in the research laboratory, the cytometric p24 assay is able to detect HIV-1 p24 in recently infected patients. As shown in Table 1, the cytometric assay performed as well as the molecular detection assays on the three commercial seroconversion panels tested. The assay outperformed, in these three panels, all the assays approved by the United States Food and Drug Administration. These data suggest that, instead of nucleic acid detection, this cytometric assay could be used for the early diagnosis of HIV-1 infection as it has been suggested for the current HIV-1 p24 tests in the diagnosis of perinatal HIV-1 infection (Fiscus et al., 2007) and in resource poor settings (Fiscus et al., 2007; Respess et al., 2005; Tehe et al., 2006). Similar to what was done with the 4th generation ELISA for the diagnosis of HIV infection, which combines the detection of both anti-HIV antibodies and HIV antigens (Ly et al., 2007; Yeom et al., 2006), the cytometric assay described above could be combined with the evaluation of other HIV-1 antigens as it has been described in multiplexed detection of HIV antigens (Faucher et al., 2004).
Table 1.
Reactivity with seroconversion panels.
| Panel ID | Luminex assay | USDA licensed HIV tests |
European test |
|||||
|---|---|---|---|---|---|---|---|---|
| S/Coa | Anti-HIV EIAb S/Co |
HIV Agc S/Co |
PCRd Copy number |
Western blote Band pattern |
3rd Generation EIAf S/Co |
EIAg S/Co |
||
| PRB929 | PRB929-01 | 0.72 | 0.20 | 0.50 | NEG | No Bands | 0.20 | 0.10 |
| PRB929-02 | 0.81 | 0.20 | 0.50 | NEG | No Bands | 0.20 | 0.20 | |
| PRB929-03 | 1.36 | 0.20 | 0.90 | POS | No Bands | 0.30 | 0.20 | |
| PRB929-04 | 16.02 | 0.20 | 13.40 | POS | No Bands | 0.20 | 0.30 | |
| PRB929-05 | 132.44 | 0.90 | >22.7 | POS | No Bands | 0.70 | 0.20 | |
| PRB929-06 | 93.94 | >16.3 | >22.7 | POS | f24, f160 | 12.50 | 2.10 | |
| PRB929-07 | 9.96 | >16.3 | >22.7 | POS | 24, 120, 160 | >13.0 | 4.50 | |
| PRB950 | PRB950-01 | 0.55 | 0.20 | 0.50 | BLD | No Bands | 0.20 | 1.90 |
| PRB950-02 | 1.13 | 0.20 | 0.70 | 7×10⁴ | No Bands | 0.20 | 2.10 | |
| PRB950-03 | 6.04 | 0.20 | 3.30 | 5×10⁵ | No Bands | 0.20 | 2.20 | |
| PRB950-04 | 8.47 | >15.5 | 4.10 | 5×10⁵ | No Bands | 16.40 | 7.00 | |
| PRB917 | PRB917-01 | 0.70 | 0.20 | 0.40 | NEG | No Bands | 0.10 | 0.30 |
| PRB917-02 | 6.19 | 0.20 | 3.90 | POS | No Bands | 0.10 | 0.40 | |
| PRB917-03 | 41.46 | 0.30 | 21.60 | POS | No Bands | 0.10 | 0.40 | |
| PRB917-04 h | 6.60 | 12.70 | POS | No Bands | 0.20 | 1.00 | ||
| PRB917-05 | 1.87 | 10.20 | 2.40 | POS | 24.00 | 7.90 | 4.50 | |
| PRB917-06 | 1.55 | 10.80 | 1.60 | POS | 24.00 | 13.60 | 5.70 | |
| PRB917-07 h | 9.20 | 0.40 | POS | 24, f65, 160 | 30.40 | 7.90 | ||
Data obtained with the Luminex assay expressed as signal/cut-off (S/Co), where cut-off is defined as the mean background value + 3 standard deviations; a S/Co above 1 (in bold) is considered positive.
Data provided as S/Co by BBI/SeraCare using the Abbott Anti-HIV 1-2 enzymatic immunoassay.
Data provided as S/Co by BBI/SeraCare using the Abbott Anti-HIV1 antigen immunoassay.
Data provided as positive or negative values or number of copies per ml of serum using the Roche HIV-1 for panels PRB929 and PRB917 and the Roche amplicor assay for PRB 950.
Confirmatory western blots from Ortho/Cambridge, data interpreted using ASTPHLD/CDC criteria (MMWR, vol. 38, S-7, 1989). Faintly stained bands are indiacted by “f”.
Data provided as S/Co by BBI/SeraCare using the 3rd generation enzymatic immunoassay fromAbbott 3rd Generation Plus for panels PRB929 and PRB950 and Diagnostic Pasteur HIV 1/2 for panel PRB917.
Data provided as S/Co by BBI/SeraCare using the 3rd Generation enzymatic immunoassay from Biotest HIV 1/2 for panels PRB929 and PRB950 and Murex Wellcozyme HIV 1/2 for panel PRB 917.
Samples no longer available.
Because of its multiplexing ability, a single Luminex experimental procedure can simultaneously measure, up to a hundred different analytes in 50μl of sample. Today more than 55 assays related to the direct measurement of infectious agents or to pathogen-specific antibodies are commercially available (Rules Based Medicine, Inc., Austin TX), and multiplex assays are used for the diagnosis of infectious agents (Brunstein and Thomas, 2006; Khan et al., 2008).
However, if only p24 is to be measured, as reported in this manuscript, the cytometric assay described above can be analyzed on a conventional flow cytometer. In this case, all the quality controls that were automatically performed in the Luminex platform, have to be implemented manually. When using acquisition and analysis software such as CellQuest or FlowJo, in addition to the calibration of the cytometers, care should be taken to analyze only single events by choosing a gating strategy that eliminates the analysis of aggregated beads as they introduce errors in the data. This is usually achieved by drawing a tight gate around bead singlets defined in bivariate plots representing the height versus width of both the forward and side scatter parameters and using the median fluorescence value of the reporter fluorochrome, phycoerythrine, to perform the regression analysis. In this instance, the assay can be acquired on a single LASER cytometer capable of exciting efficiently phycoerythrine.
Although the investment in a Luminex instrument might be perceived as a luxury for the measurement of a single analyte, the multiplexing capability of this technology makes it extremely attractive as it saves time and allows the detection of many parameters at once.
Irrespective of its potential use in a clinical setting, the assay described above has a large dynamic range, a low cost around $22 per plate, 60% of which is for the filter plate and can be saved by using magnetic beads. This assay has been used successfully to detect HIV-1 p24 antigen in cell culture supernatants, in patient serum, and in culture of human cervicovaginal explants, which require a highly sensitive assay due to the low level of viral replication in this tissue. As it is the case with other filter plate based Luminex assays that detect, in cell lysates, phosphorylated intracellular signaling proteins (Zhou et al., 2007), the p24 cytometric assay can be adapted to detect intracellular p24 antigen in infected cells or tissues. Because of these traits and because it can be multiplexed with other measurements, therefore saving precious samples, the p24 cytometric assay offers a unique combination of cost, time and sample savings that were missing in the research community.
References
- Boni J, Opravil M, Omasik Z, Rothen M, Bisset L, Grob PJ, Luthy R, Schupbach J. Simple monitoring of antiretroviral therapy with a signal-amplification-boosted HIV-1 p24 antigen assay with heat-denatured plasma. AIDS. 1997;11:F47–52. doi: 10.1097/00002030-199706000-00001. [DOI] [PubMed] [Google Scholar]
- Brunstein J, Thomas E. Direct screening of clinical specimens for multiple respiratory pathogens using the Genaco respiratory panels 1 and 2. Diagn. Mol. Pathol. 2006;15:169–173. doi: 10.1097/01.pdm.0000210430.35340.53. [DOI] [PubMed] [Google Scholar]
- Faucher S, Martel A, Sherring A, Ding T, Malloch L, Kim JE, Bergeron M, Sandstrom P, Mandy FF. Protein bead array for the detection of HIV-1 antibodies from fresh plasma and dried-blood-spot specimens. Clin. Chem. 2004;50:1250–1253. doi: 10.1373/clinchem.2004.032995. [DOI] [PubMed] [Google Scholar]
- Fiscus SA, Cheng B, Crowe SM, Demeter L, Jennings C, Miller V, Respess R, Stevens W. HIV-1 viral load assays for resource-limited settings. PLoS Med. 2006;3:e417. doi: 10.1371/journal.pmed.0030417. [DOI] [PMC free article] [PubMed] [Google Scholar]
- Fiscus SA, Pilcher CD, Miller WC, Powers KA, Hoffman IF, Price M, Chilongozi DA, Mapanje C, Krysiak R, Gama S, Martinson FE, Cohen MS. Rapid, real-time detection of acute HIV infection in patients in Africa. J. Infect. Dis. 2007;195:416–424. doi: 10.1086/510755. [DOI] [PubMed] [Google Scholar]
- Giacomini M, McDermott JL, Giri AA, Martini I, Lillo FB, Varnier OE. A novel and innovative quantitative kinetic software for virological colorimetric assays. J. Virol. Methods. 1998;73:201–209. doi: 10.1016/s0166-0934(98)00059-7. [DOI] [PubMed] [Google Scholar]
- Khan IH, Ravindran R, Yee J, Ziman M, Lewinsohn DM, Gennaro ML, Flynn JL, Goulding CW, DeRiemer K, Lerche NW, Luciw PA. Profiling antibodies to Mycobacterium tuberculosis by multiplex microbead suspension arrays for serodiagnosis of tuberculosis. Clin. Vaccine Immunol. 2008;15:433–438. doi: 10.1128/CVI.00354-07. [DOI] [PMC free article] [PubMed] [Google Scholar]
- Ly TD, Ebel A, Faucher V, Fihman V, Laperche S. Could the new HIV combined p24 antigen and antibody assays replace p24 antigen specific assays? J. Virol. Methods. 2007;143:86–94. doi: 10.1016/j.jviromet.2007.02.013. [DOI] [PubMed] [Google Scholar]
- Maldarelli F, Palmer S, King MS, Wiegand A, Polis MA, Mican J, Kovacs JA, Davey RT, Rock-Kress D, Dewar R, Liu S, Metcalf JA, Rehm C, Brun SC, Hanna GJ, Kempf DJ, Coffin JM, Mellors JW. ART suppresses plasma HIV-1 RNA to a stable set point predicted by pretherapy viremia. PLoS Pathog. 2007;3:e46. doi: 10.1371/journal.ppat.0030046. [DOI] [PMC free article] [PubMed] [Google Scholar]
- Palmer S, Wiegand AP, Maldarelli F, Bazmi H, Mican JM, Polis M, Dewar RL, Planta A, Liu S, Metcalf JA, Mellors JW, Coffin JM. New real-time reverse transcriptase-initiated PCR assay with single-copy sensitivity for human immunodeficiency virus type 1 RNA in plasma. J. Clin. Microbiol. 2003;41:4531–4536. doi: 10.1128/JCM.41.10.4531-4536.2003. [DOI] [PMC free article] [PubMed] [Google Scholar]
- Respess RA, Cachafeiro A, Withum D, Fiscus SA, Newman D, Branson B, Varnier OE, Lewis K, Dondero TJ. Evaluation of an ultrasensitive p24 antigen assay as a potential alternative to human immunodeficiency virus type 1 RNA viral load assay in resource-limited settings. J. Clin. Microbiol. 2005;43:506–508. doi: 10.1128/JCM.43.1.506-508.2005. [DOI] [PMC free article] [PubMed] [Google Scholar]
- Sutthent R, Gaudart N, Chokpaibulkit K, Tanliang N, Kanoksinsombath C, Chaisilwatana P. p24 antigen detection assay modified with a booster step for diagnosis and monitoring of human immunodeficiency virus type 1 infection. J. Clin. Microbiol. 2003;41:1016–1022. doi: 10.1128/JCM.41.3.1016-1022.2003. [DOI] [PMC free article] [PubMed] [Google Scholar]
- Tehe A, Maurice C, Hanson DL, Borget MY, Abiola N, Maran M, Yavo D, Tomasik Z, Boni J, Schupbach J, Nkengasong JN. Quantification of HIV-1 p24 by a highly improved ELISA: an alternative to HIV-1 RNA based treatment monitoring in patients from Abidjan, Cote d’Ivoire. J. Clin. Virol. 2006;37:199–205. doi: 10.1016/j.jcv.2006.08.005. [DOI] [PubMed] [Google Scholar]
- Yeom JS, Jun G, Chang Y, Sohn MJ, Yoo S, Kim E, Ryu SH, Kang HJ, Kim YA, Ahn SY, Cha JE, Youn ST, Park JW. Evaluation of a new fourth generation enzyme-linked immunosorbent assay, the LG HIV Ag-Ab Plus, with a combined HIV p24 antigen and anti-HIV-1/2/O screening test. J. Virol. Methods. 2006;137:292–297. doi: 10.1016/j.jviromet.2006.07.002. [DOI] [PubMed] [Google Scholar]
- Zhou Z, Hamming OJ, Ank N, Paludan SR, Nielsen AL, Hartmann R. Type III interferon (IFN) induces a type I IFN-like response in a restricted subset of cells through signaling pathways involving both the Jak-STAT pathway and the mitogen-activated protein kinases. J. Virol. 2007;81:7749–7758. doi: 10.1128/JVI.02438-06. [DOI] [PMC free article] [PubMed] [Google Scholar]