

Abstract
Background
Mycobacterium tuberculosis is an unusual pathogen, persisting for years in infected persons despite an immune response. Erythropoietin-producing hepatoma (Eph) receptors are critical for tissue organization. One hallmark of tuberculosis is the presence of granulomas consisting of organized immune cells. The importance of granuloma structure makes it likely that Eph receptors play a role in immunity to tuberculosis.
Methods
We infected mice with low doses of M. tuberculosis by the aerosol method and examined the effects on ephA gene expression, pathology, composition of lymphocytes in the lungs (by flow cytometry), migration of CD4+ and CD8+ T cells, and numbers of cytokine-expressing cells.
Results
Mice infected with M. tuberculosis displayed higher expression of ephA1 and ephA2 as well as ephrinA1, which encodes the ligand for EphA1 and EphA2. Interestingly, ephA2−/− mice displayed greater pathology, greater accumulation of T cells and dendritic cells, and higher levels of proinflammatory cytokines than did normal C57BL/6 mice. Furthermore, T cells from ephA2−/− mice migrated more efficiently than did those from C57BL/6 mice.
Conclusions
These observations suggest that ephA-related genes may provide a mechanism that M. tuberculosis uses to circumvent the host response, given that accumulation of T cells appears to be due to the inhibition of immune cell migration by EphA2. Ultimately, the absence of ephA2 results in greater clearance of M. tuberculosis during the chronic phase of infection, suggesting that induction of ephA2 is important for the survival of M. tuberculosis during latency.
Mycobacterium tuberculosis is one of the most important human pathogens, causing nearly 2 million deaths and 9 million new infections annually [1–4]. Cell-mediated immunity constitutes a major component of the protective immune response against M. tuberculosis [5–7]. The immune response to M. tuberculosis is characterized by the formation of organized cellular aggregates called “granulomas” that develop through the influx of circulating immune cells, restricting the growth of M. tuberculosis [8, 9]. Recruitment of immune cells is a dynamic process in which CD4+ T cells, CD8+ T cells, macrophages, neutrophils, and B cells constitute the main cellular components [10–12]. The mechanisms of cellular infiltration are multifaceted and involve cytokines, chemokines, matrix metalloproteinases, and adhesion molecules that promote the formation of well-organized granulomas [13–16].
Erythropoietin-producing hepatoma (Eph) receptors are a family of receptor tyrosine kinases present in many eukaryotes [17, 18]. In vertebrates, 16 members have been identified within 2 subfamilies, EphA and EphB. Their cognate ligands, ephrins, are also membrane proteins. Eph receptors are involved in axon guidance, vascularization, tissue assembly, and cell adhesion and migration [18–21]. EphA receptors are involved in T cell function. For example, CD4+ T cells stimulated with EphrinA1 antibody, mimicking binding to EphA1 or EphA2 receptors, inhibit production of interleukin (IL)–2 and IL-4 [22]. EphA receptors are expressed on CD4+ and CD8+ T cells, dendritic cells (DCs), and Langherans cells [23, 24]. Maintenance of tissue borders involves EphA receptors acting as “switches” for attraction and repulsion [25–29], a mechanism likely to affect immunity [30, 31]. Because EphA receptors modulate T cell migration in response to chemokines [31], they may affect M. tuberculosis [32, 33].
Few studies have examined the involvement of Eph receptors during infection. Neisseria gonorrhea induces expression of ephA2 and ephA3 in epithelial cells [34], and M. tuberculosis induces ephA1 and ephA3 in monocytic cells [35, 36]. Despite these intriguing observations, the role played by EphA receptors in the pathogenesis of M. tuberculosis infection has not been examined. We analyzed the host response in normal C57BL/6 mice and ephA2-interrupted (ephA2−/−) mice after aerosol infection with low doses of M. tuberculosis. We found that the ephA1 and ephA2 genes as well as the ephrinA1 gene, which encodes the ligand for EphA1 and EphA2, were induced after infection, suggesting that they play a role during tuberculosis. Striking differences were observed in pathology, abundance of immune cells, and production of proinflammatory cytokines. T cells from ephA2−/− mice migrated more efficiently than did those from C57BL/6 mice, suggesting a mechanism by which induction of EphA receptors by M. tuberculosis can reduce the migration of immune cells to the site of infection. These observations provide insight into a critical aspect of the pathogenesis of M. tuberculosis infection, because Eph receptors are used by M. tuberculosis to modulate the host response.
Methods
Animal experiments
Five- to 8-week-old male and female ephA2 gene–disrupted mice (B6;129S6-Epha2tm1Jrui/J; stock no. 006028) and C57BL/6 mice were purchased from Jackson Laboratory. The ephA2 gene– disrupted mice were made by targeted disruption of exon 5 [19] in 129SV mice. The ephA2−/− homozygotes were backcrossed with C57BL/6 mice and maintained by breeding nonagouti siblings for >10 years. This breeding process ensures that mice are homozygous with the C57BL/6 background and contain the ephA2−/− mutation, because C57BL/6 genes will segregate with nonagouti genes. All animal experiments were approved by the institutional animal use committee and complied with established guidelines.
Bacterial culture and aerosol infection
M. tuberculosis Erdman cultures were grown at 37°C in Middlebrook 7H9 medium (Difco) supplemented with 10% albumin-dextrose complex and 0.25% Tween-80 (USB) to an optical density at 600 nm of ∼0.8–1. Bacterial viability was assessed by plating on selective Middlebrook 7H11 agar plates (Difco) supplemented with 10% oleic acid–albumin–dextrose complex (MOADC). Mice (n = 5 per group) were infected with M. tuberculosis by the aerosol method, using a Madison aerosol chamber delivering ∼100 bacilli [37].
Bacterial load determination
For each time point, lungs and spleens from infected mice were homogenized. Dilutions were plated on MOADC plates to enumerate colony-forming units.
Histopathology and morphometric analyses
Tissues were fixed in 10% formalin and embedded in paraffin, and 5-μm sections were stained with hematoxylin-eosin, as described elsewhere [38]. Sections were obtained from different portions of each organ and coded for masked examination, and granulomas were evaluated using a Nikon Eclipse E800 microscope. Acid-fast bacilli were detected by Ziehl-Nieelsen staining, as described elsewhere [39]. Morphometric analyses allowed quantification of the percentage of lung involved in granulomas. The ratio of areas of granulomatous to nongranulomatous tissue was determined on digitized images obtained using Image J software (version 1.41; National Institutes of Health). Masked quantification used the entire surface area of 3 separate random sections per mouse for 5 mice per group.
Lung cell suspensions
Total lung cell suspensions were prepared from infected mice (n = 4 per group), as described elsewhere [10, 11]. Lung cell viability was assessed by trypan blue exclusion [40]. More than 90% of all cells isolated were viable. Lung cell suspensions had comparable numbers of cells after preparation (∼5 × 10⁶ cells) before flow cytometry analysis for all mice.
Isolation of CD4+ and CD8+ T cells
Spleens from uninfected and infected mice were homogenized, and single-cell suspensions were prepared by passage through a nylon cell strainer (70 μm). CD4+ and CD8+ T cell populations were purified using magnetic cell sorting (Miltenyi Biotech). The purity of the CD4+ and CD8+ T cell preparations was verified to be >90% by flow cytometry.
Flow cytometry
Monoclonal antibodies specific for mouse CD4 (L3T4) and CD8 (Ly-2) were purchased from eBioscience, and monoclonal antibodies specific for CD3 (145-2C11), CD11b (M1/70), and CD11c (HL3) were purchased from BD Pharmingen, all as direct fluorochrome conjugates of fluorescein isothiocyanate, phycoerythrin (PE), PE–cyanine (Cy) 7, or PE-Cy5. Lung cell suspensions were incubated with Mouse Fc Block (BD Pharmingen), stained with specific antibodies, washed with phosphate-buffered saline plus 0.05% sodium azide, and fixed with 2% paraformaldehyde. Intracellular staining was performed to assess cytokine production. Lung cells were fixed with 4% paraformaldehyde and permeabilized with 0.5% saponin before being incubated with anti–interferon (IFN)–γ (XMG1.2), anti–tumor necrosis factor (TNF)–α (MP6-XT22), and anti–IL-4 (11B11) (eBiosciences) directly conjugated to PE. Fluorescence intensity was acquired for 10,000 events for each sample using a FACScalibur flow cytometer (BD Biosciences), and data were analyzed using FlowJo software (version 8.5; Treestar). Lymphocyte and macrophage/monocyte populations were gated using forward and side scatter profiles [10, 11].
Migration assays
Migration assays were performed using 96-well transwell plates (5 μm) [30]. Briefly, 3 × 10⁵ fluorescently labeled CD4+ or CD8+ T cells were layered on the top chamber, and medium with or without chemokine (C-C motif) ligand (CCL) 21 or monocyte chemotactic protein (MCP)–1 (100 ng/mL) was added to the bottom chamber. Wells containing medium with CCL21 or MCP-1 in both the top and bottom chambers were included as controls. Cells were allowed to migrate for 2 h at 37°C, collected, and counted by flow cytometry with CountBright absolute counting beads as an internal control (Invitrogen).
Total RNA extraction and real-time polymerase chain reaction (PCR) analysis
For each time point, cells were lysed using TRIzol reagent (Invitrogen). RNA samples were treated with RNase-free DNase I (Promega), followed by purification using the RNeasy Mini Kit (Qiagen). The quality of RNA was assessed by agarose gel electrophoresis, and concentration was estimated using a NanoDrop ND-1000 spectrophotometer (version 3.1.0; Thermo Fisher Scientific). Reverse-transcription reactions on total RNA were performed using the First Strand cDNA Synthesis Kit (Invitrogen) with random decamers. The PCRs were run on a 7500 Real-Time PCR System instrument (Applied Biosystems) [41], using the primer pairs ephaF3 (5′-CCAACTAGCTCCTGGTCAGC-3′; forward) and ephaR3 (5′-TGCAGCACAGGTTCTGATTC-3′; reverse) for ephA1 and mephA2F (5′-GTCAGATGTGGACTATGGCACCAACT-3′; forward) and mephA2R (5′-TGTGTATCGGAGACAGCGACAGCA-3′; reverse) for ephA2. The cycle threshold values were used to calculate the relative fold difference in ephA1 and ephA2 gene expression normalized against the expression of gapdh (glyceraldehyde-3-phosphate dehydrogenase), one of the most widely used housekeeping genes for transcript normalization. Experiments were repeated 3 times independently.
Statistical analysis
Statistical significance was determined by analysis of variance using Student's t test (2-tailed). Differences with P < .05 were considered statistically significant.
Results
Increases in ephA-related transcript levels in the lungs following M. tuberculosis infection
All data obtained in this study were derived from infecting normal C57BL/6 mice and ephA2−/− mice with low doses of M. tuberculosis by the aerosol method in 2 separate experiments. In both experiments, the number of colony-forming units received by the mouse strains was not significantly different: in experiment 1, ephA2−/− mice and C57BL/6 mice had a mean ± standard deviation of 77 ± 20 and 92 ± 27 cfu, respectively, on day 1; in experiment 2, ephA2−/− mice and C57BL/6 mice had 23 ± 6 and 24 ± 3 cfu, respectively, on day 1. Relative expression of ephA1, ephA2, and ephrinA1 (which encodes the ligand for EphA1 and EphA2) was determined by quantitative real-time PCR. Although expression was not significantly different between uninfected and infected mice on day 1 after infection, M. tuberculosis–infected mice expressed ephA1, ephA2, and ephrinA1 (figure 1) at 5–10-fold higher levels than did uninfected mice by 35 days after infection. As expected, we did not observe expression of the ephA2 gene in ephA2−/− mice. Interestingly, induction of ephA1 and ephrinA1 expression after M. tuberculosis infection occurred more rapidly in ephA2−/− mice than in C57BL/6 mice. It is possible that ephA-related genes are induced by the host as a mechanism to combat M. tuberculosis infection, by M. tuberculosis to harness natural host pathways in a manner that is beneficial to pathogenesis, or by a combination of these.
Figure 1.
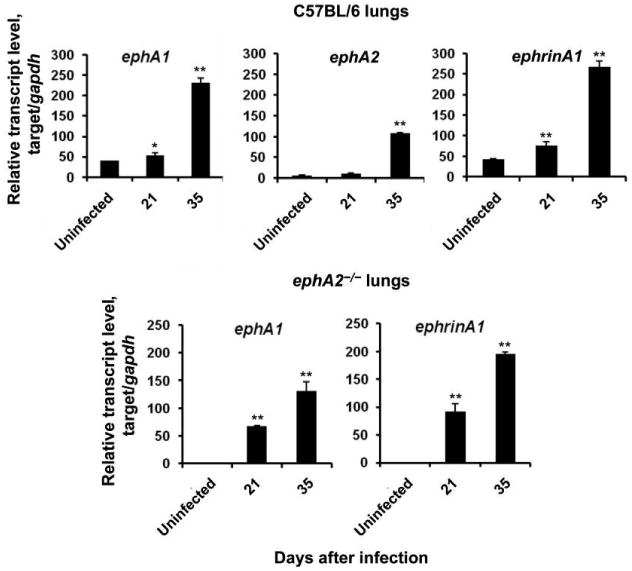
Expression of erythropoietin-producing hepatoma (Eph) A transcripts and their ligand, EphrinA1. Transcript levels of ephA1, ephA2, and ephrinA1 in the lungs of normal C57BL/6 mice and ephA2−/− mice were quantified by real-time polymerase chain reaction. Data are relative transcript levels normalized against the gapdh gene and represent the means ± standard deviations of values from 3 independent experiments. *P < .05; **P < .01.
Larger granulomas in ephA2−/− mice than in C57BL/6 mice after M. tuberculosis infection
Comparison of disease in C57BL/6 and ephA2−/− mice should provide insight into whether ephA-related gene induction is beneficial to the host or to M. tuberculosis. We examined the granulomatous response by both qualitative and quantitative analyses of hematoxylin-eosin–stained lung sections. Qualitatively, no obvious differences were observed at the histological level between C57BL/6 mice and ephA2−/− mice on days 14 and 21 after infection; both mouse strains displayed similar perivascular and peribronchiolar mixed cell infiltrates. However, on days 35 and 91 after infection, larger granulomas composed of dense mononuclear cell aggregates were observed in the lungs of ephA2−/− mice (figure 2A). On day 35 after infection, some lesions in ephA2−/− mice occupied up to 50% of the total lung section. In contrast, granulomas in C57BL/6 mice harbored more concentric lesions that were clearly demarcated from the surrounding normal lung parenchyma. In addition, granulomas in ephA2−/− mice contained a higher number of mononuclear cells on days 35 and 91 after infection (figure 2B). Although random foci of macrophage-like cells and foamy macrophages were present in both C57BL/6 mice and ephA2−/− mice, mononuclear cells comprised the majority of the lesions in ephA2−/− mice. Morphometric analyses revealed statistically significant (P = .009) differences in the percentage of total lung tissue involved in granuloma formation between ephA2−/− mice and C57BL/6 mice on day 91 after infection (figure 2C). These observations are suggestive of a more robust inflammatory response in the absence of ephA2.
Figure 2.
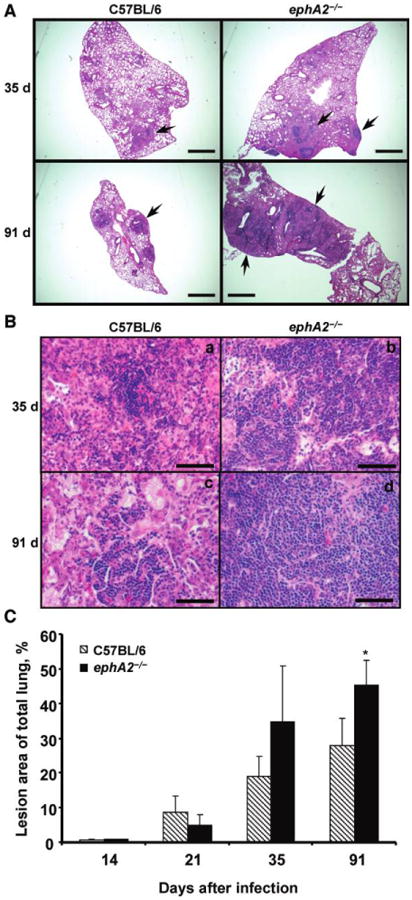
Larger granulomas and enhanced mononuclear cell accumulation in ephA2−/− mice than in normal C57BL/6 mice. A, Lung sections from C57BL/6 mice and ephA2−/− mice stained with hematoxylin-eosin. Shown are representative images from days 35 and 91 after infection. Granulomas are shown by the presence of darker cellular aggregates, indicated by the arrows. Scale bar, 500 μm. B, Enhanced mononuclear cell accumulation in granulomas from ephA2−/− mice compared with C57BL/6 mice, as shown by the preponderance of purple-staining nuclei throughout the tissue from ephA2−/− mice. Shown are representative images of hematoxylin-eosin–stained lung sections from days 35 and 91 after infection. Lesions in the ephA2−/− mice display larger aggregates of lymphocytes and monocytic cells. Scale bar, 50 μm. C, Morphometric analysis of granulomatous lesions in ephA2−/− mice and C57BL/6 mice infected with Mycobacterium tuberculosis. The area of lung involved in granuloma formation was measured, and percentages were calculated relative to the total surface area of the lung sections. The entire cross-section of the lung was quantified for each of 3 random sections for 5 mice. Data are the means ± standard deviations of values from all mice in the same group (n = 5). *P = .009.
Higher proportions of T cells and DCs in the lungs of ephA2−/− mice than C57BL/6 mice
We investigated the contribution of different immune cells in the lungs of infected mice by means of flow cytometry. We focused on CD4+ and CD8+ T cells, because these cells play a critical role in the protective response to M. tuberculosis [5–7]. Examination of the CD3+CD4+ T cell population revealed that these cells were more abundant in ephA2−/− mice than in C57BL/6 mice (P < .01) (figure 3A). This trend continued with time: there was a 3-fold difference in abundance between ephA2−/− mice (4.9%) and C57BL/6 mice (16.4%) on day 91 after infection (P < .001).The CD3+CD8+T cell population displayed differences later, with significantly higher levels in ephA2−/− mice than in C57BL/6 mice beginning on day 35 after infection (P < .01) (figure 3B) that were sustained on day 91 after infection (7.2% for ephA2−/− mice vs. 9.5% for C57BL/6 mice; P < 0.01). We characterized DC populations on the basis of their surface expression of CD11b and CD11c [10]. We found significantly higher percentages of DCs in ephA2−/− mice than in C57BL/6 mice on day 35 after infection (P < .01). This represents a 5-fold increase in the percentage of DCs relative to that on day 1 after infection in ephA2−/− mice (figure 3C). These observations suggest that differences in pathology after M. tuberculosis infection are likely to be due to changes in populations of immune cells in the lungs.
Figure 3.
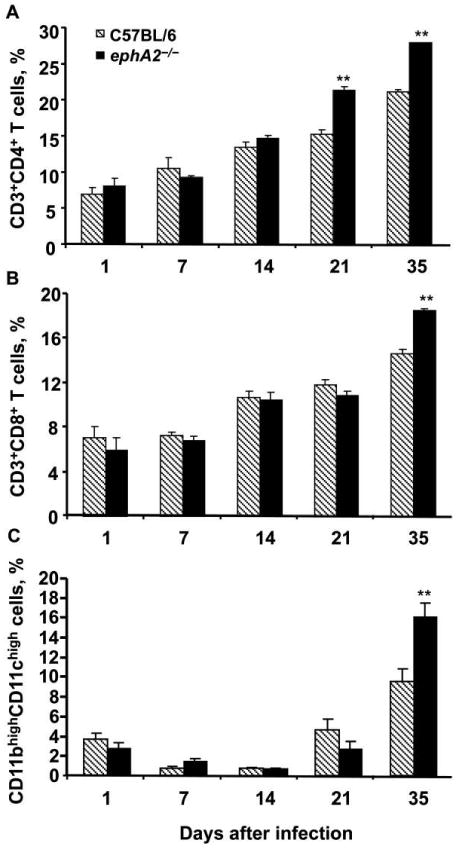
Greater abundance of CD4+ and CD8+ T cells as well as dendritic cells (DCs) in ephA2−/− mice than in normal C57BL/6 mice after infection with Mycobacterium tuberculosis. The percentages of total lymphocytic cells that were CD3+CD4+ (A) and CD3+CD8+ (B) T cells in the lungs of ephA2−/− mice and C57BL/6 mice were determined by flow cytometry using CD3, CD4, and CD8 surface markers. The percentage of the total macrophage and monocytic cell population that were DCs (C) was determined on the basis of their level of CD11b and CD11c surface expression. Data are the means ± standard deviations of values from all mice in the same group (n = 4). The key in panel A applies to all other panels. **P < .01.
More efficient migration of T cells from M. tuberculosis–infected ephA2−/− mice than of those from C57BL/6 mice
A possible mechanism that might lead to higher proportions T cells and DCs in the lungs of ephA2−/− mice after infection with M. tuberculosis would be increased migration of immune cells from peripheral sites. We tested this possibility by measuring the migration of CD4+ and CD8+ T cells obtained from the spleens of M. tuberculosis–infected mice in response to a chemokine gradient. T cell migration was measured using transwell assays in the presence of CCL21, a chemokine that is involved in monocyte and lymphocyte recruitment [33, 42] and that is induced during M. tuberculosis infection [43]. We observed statistically significantly higher levels of migration for CD4+ and CD8+ T cells from ephA2−/− mice in response to CCL21 than for those from C57BL/6 mice (P < .01) (figure 4). As expected, cells from both ephA2−/− mice and C57BL/6 mice migrated poorly in the absence of chemokine. Similarly, there was negligible migration when the chemokine was added to both the upper and lower chamber of the transwell, confirming that the T cells require a chemokine gradient for migration. These observations support the conclusion that the increased pathology and higher proportion of T cells found in ephA2−/− mice after M. tuberculosis infection result from the role played by the EphA2 receptor in modulating the migration of T cells.
Figure 4.
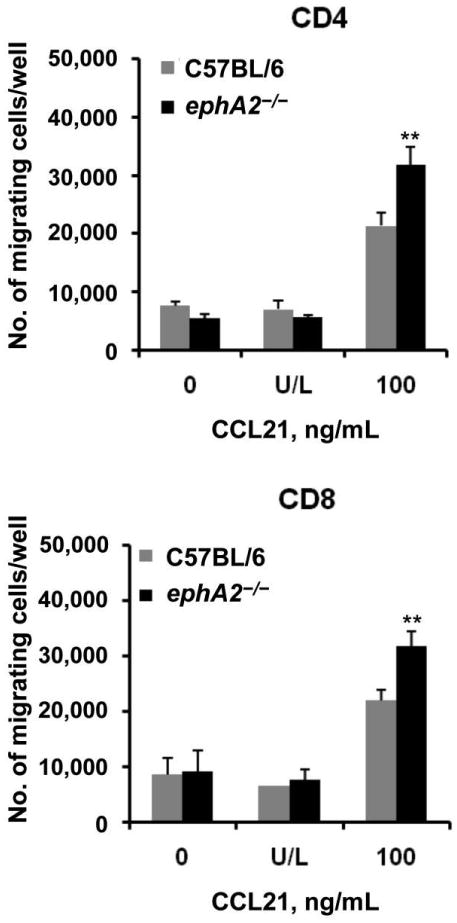
More efficient migration of CD4+ and CD8+ T cells from ephA2−/− mice than of those from normal C57BL/6 mice. The ability of CD4+ and CD8+ T cells isolated from the spleens of Mycobacterium tuberculosis–infected C57BL/6 mice and ephA2−/− mice to migrate through transwells was evaluated. Cells were either left unstimulated (0), stimulated with chemokine (C-C motif) ligand (CCL) 21 in both the upper and lower chamber (U/L), or stimulated with CCL21 only in the lower chamber (100). Data are the absolute no. of migrating cells per well and represent the means ± standard deviations of values from triplicate wells per experimental condition. **P < .01.
Cytokine production in M. tuberculosis–infected ephA2−/− mice
Changes in the proportion of immune cells—particularly T cells and DCs—in the lungs are likely to affect the production of cytokines. We examined the local type 1 T helper (Th1) and type 2 T helper (Th2) cytokine profiles in the lungs by intracellular staining of cell suspensions from C57BL/6 mice and ephA2−/− mice infected with M. tuberculosis. The number of IFN-γ–producing cells was statistically significantly higher in ephA2−/− mice than in C57BL/6 mice (figure 5). Similarly, the number of TNF-α–producing cells was >4-fold higher in ephA2−/− mice on day 21 after infection and up to 1.5-fold higher on day 35. Differences in IL-4 production were observed only on day 35 after infection, possibly the result of differences in the production of proinflammatory cytokines at earlier time points. These data indicate that the EphA2 receptor is involved in the modulation of the proinflammatory response to M. tuberculosis infection and suggest that this response induces anti-inflammatory cytokines, possibly to mitigate tissue damage that would result from a robust inflammatory response.
Figure 5.
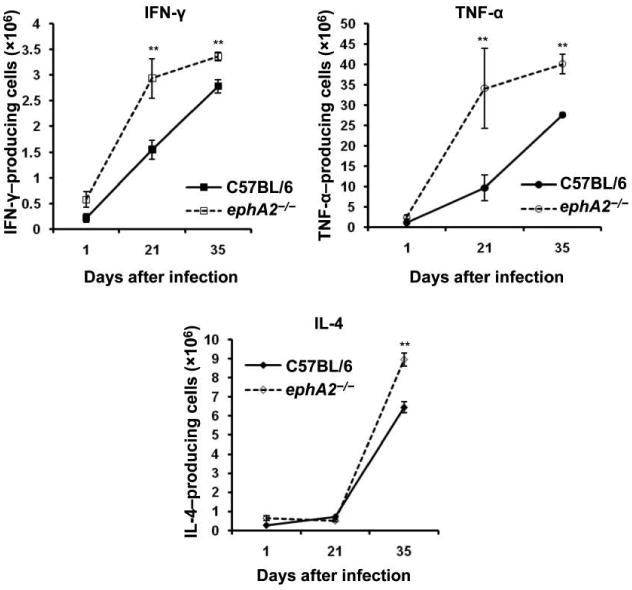
Cytokine production in the lungs during Mycobacterium tuberculosis infection. Cytokine levels were measured by intracellular staining and flow cytometry of lung cell suspensions. Data are the absolute no. of cytokine-producing cells per lung and represent the mean ± standard deviation of values from each mouse (n = 5) per group and per time point. IFN, interferon; IL, interleukin; TNF, tumor necrosis factor. **P < .01.
Loss of EphA2 improves control of M. tuberculosis infection during the chronic phase
Although the above-described observations provide insight into the mechanism responsible for the differences in pathology, it remains unclear how these changes affect disease. Because M. tuberculosis induces ephA-related gene expression in the lungs of mice and because the absence of ephA2 results in a more robust local inflammatory response, it seems likely that loss of ephA2 would negatively affect survival of the bacilli. Survival of M. tuberculosis in ephA2−/− mice and C57BL/6 mice was evaluated in 2 independent experiments (figure 6). Despite comparable growth during the acute phase of infection, M. tuberculosis was consistently cleared 3–5-fold more efficiently in ephA2−/− mice than in C57BL/6 mice during the chronic phase of infection, in both the lungs and the spleen (P < .01). Acid-fast staining confirmed the modestly lower numbers of bacilli in ephA2−/− mice than in C57BL/6 mice 5 weeks after infection (data not shown). The differences in persistence observed are not the result of differences in the initial inoculum, because comparable numbers of bacilli were present in the lungs on day 1 after infection in all mice. These data demonstrate that the absence of ephA2 allows modestly more efficient clearance of M. tuberculosis during the chronic phase of infection, compared with that in C57BL/6 mice, and suggest that induction of ephA-related genes is a mechanism used by M. tuberculosis to hijack host machinery to improve persistence.
Figure 6.
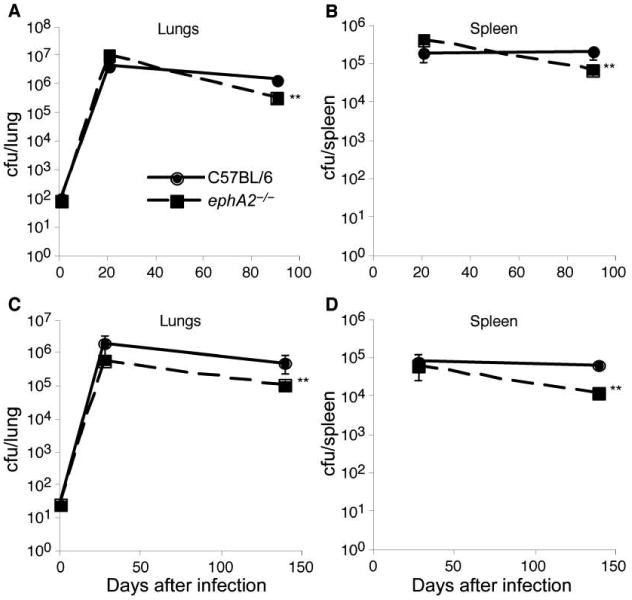
Better control of Mycobacterium tuberculosis infection by ephA2−/− mice than by normal C57BL/6 mice. M. tuberculosis colony-forming units in the lungs and spleens of C57BL/6 mice and ephA2−/− mice were determined in 2 independent experiments; panels A and B show the results of experiment 1, and panels C and D show the results of experiment 2. Data are the means ± standard deviations of values from 5 mice per group. The key in panel A applies to all other panels. **P < .01.
Discussion
This is the first study to demonstrate that EphA receptors play a role in the pathogenesis of M. tuberculosis infection. We have developed a working model to guide additional studies examining the role played by EphA receptors and their ligand, EphrinA1, in M. tuberculosis pathogenesis (figure 7). Our data indicate that EphA2 can modulate the immune response during M. tuberculosis infection by altering T cell recruitment, immune cell composition in the lungs, and cytokine production. In light of these observations, it is likely that M. tuberculosis induces the expression of Eph receptors and EphrinA1, which act in a coordinated fashion to reduce the migration of T cells and DCs to the site of infection, producing an environment that is conducive to bacterial persistence. In the absence of EphA2, as in our transgenic mouse model, T cells and DCs migrate to the site of infection more readily and produce an immune response that modestly improves bacterial clearance during the chronic phase of infection and that is beneficial to the host.
Figure 7.
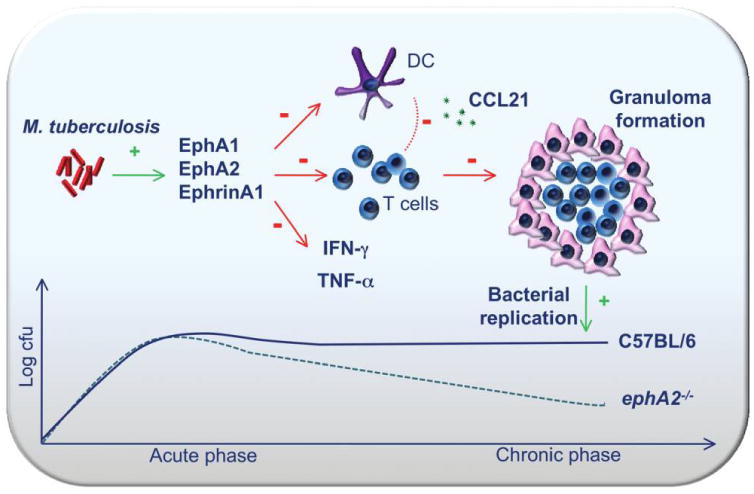
Model for the role played by erythropoietin-producing hepatoma (Eph) A receptors during Mycobacterium tuberculosis infection. In the absence of ephA2, there is increased accumulation of CD4+ and CD8+ T cells as well as dendritic cells (DCs) in the lungs. T cell recruitment is mediated through chemokine (C-C motif) ligand (CCL) 21, which is perhaps released by accumulating DCs. As a consequence of enhanced cellular infiltration, interferon (IFN)–γ and tumor necrosis factor (TNF)–α levels become elevated. Both of these events contribute to the development of larger granulomas and a reduced bacterial load during the chronic phase of M. tuberculosis infection.
We found that ephA1, ephA2, and ephrinA1 are induced after infection with M. tuberculosis. Because the absence of EphA2 results in improved clearance of M. tuberculosis during the chronic phase of infection, it is likely that induction of ephA-related genes is a virulence mechanism of M. tuberculosis. Our observations are consistent with those of previous studies describing induction of Eph receptor gene expression in monocytic cells by M. tuberculosis at 24–48 h after infection [35, 36], although the time points at which induction is observed in mice are much later (21–35 days), most likely because of the use of monocytic cells alone rather than the whole lung tissue used in the present study. The greater induction of ephA1 and ephrinA1 in ephA2−/− mice than in C57BL/6 mice suggests that sensitivity to stimulation is increased in the absence of EphA2. It is possible that EphA1 and EphA2 are at least partially functionally redundant, suggesting that a double ephA2/ephA1 mutant could display a more obvious phenotype. Further investigation of the role played by Eph receptors during infectious diseases and the interactions of these receptors with each other and different components of the immune system will provide insight into the mechanisms of the pathogenesis of M. tuberculosis infection. It would be interesting to examine bacterial mutants that affect survival during latency, because they may display more-pronounced differences in clearance between wild-type mice and ephA2−/− mice, providing insight into the mechanisms involved.
Our transwell migration assays demonstrated that CD4+ as well as CD8+ T cells from the spleens of ephA2−/− mice migrate more efficiently than do those from C57BL/6 mice. As a result, the total numbers of CD4+ T cells become higher in the lungs of ephA2−/− mice than of C57BL/6 mice. Furthermore, larger lesions are observed in ephA2−/− mice, making it likely that the enhanced mononuclear cell accumulation is due to dynamic changes in T cell migration. Previous studies have shown that CD4+ T cell migration is inhibited in response to a gradient of stromal cell–derived factor–1α and macrophage inflammatory protein (MIP)–3β chemokines after EphA receptor stimulation with EphrinA1 [19, 23]. That T cells respond to CCL21 suggests that a mechanism by which EphA2 alters migration occurs through this cytokine. Interestingly, MIP-3β is a ligand for the chemokine receptor CCR7, which also binds to CCL21 and is up-regulated in M. tuberculosis–activated human DCs [32, 33], and CCL21 is induced within granulomas in the lungs of M. tuberculosis–infected mice [43]. Because a lack of ephA2 enhances T cell chemotaxis in response to CCL21, it is likely that interactions between EphA2 and EphrinA1 negatively regulate the migration of murine T cells, similar to human T cells and endothelial cells [23, 31]. Therefore, it is likely that the absence of EphA2 alters transvasation of immune cells during M. tuberculosis infection. Although increased T cell recruitment could account for the formation of larger granulomas, we cannot rule out the possibility that local proliferation, efflux from the lungs, or cell death play a role. However, our observations support the hypothesis that one of the mechanisms by which EphA2 affects the host immune response to M. tuberculosis is through modulation of immune cell recruitment.
We also found that the absence of EphA2 leads to increased production of proinflammatory cytokines in the lungs. This suggests a regulatory role for EphA2 in balancing the immune response to M. tuberculosis. It is possible that the increased levels of IFN-γ and TNF-α are due to the increased number of CD4+ and CD8+ T cells. Under normal conditions, expression of EphA2 would help to control production of IFN-γ and TNF-α, preventing excess inflammation in the lungs. M. tuberculosis has the ability to subvert this host defense mechanism by inducing higher-than-normal levels of Eph receptors. However, in ephA2−/− mice, a more robust IFN-γ and TNF-α response occurs, ultimately leading to greater bacterial clearance. That increased IL-4 production occurs immediately after the increase in both IFN-γ and TNF-α levels suggests that IL-4 plays a regulatory role in reestablishing equilibrium. Interactions between EphA and EphrinA1 can suppress the production of IL-4 by human peripheral blood CD4+ T cells [22]. Therefore, a defect in EphA2 expression would most likely impair the regulation of anti-inflammatory cytokine production, skewing the protective immune response from a Th1 toward a Th2 immune response.
The present data indicate, for the first time, that EphA2 plays a role in the pathogenesis of M. tuberculosis infection in mice and has clear repercussions for the immunopathological outcome of tuberculosis. The absence of ephA2 affects the cellular immune response to low-dose aerosol infection with M. tuberculosis in the lungs. We have identified a novel mechanism by which EphA receptors affect T cell migration in M. tuberculosis–infected mice. As a consequence of T cell infiltration, IFN-γ and TNF-α production increase, promoting the development of larger granulomas and improving bacterial clearance. These observations provide the first insight into the physiological and pathological importance of this key class of receptors in infectious diseases. We have unveiled a novel component of pathogenesis through identification of the EphA2 receptor as a modulator of the immune response to M. tuberculosis.
Acknowledgments
We thank Drs. David McMurray and Ian Orme as well as their laboratories for valuable discussions and for lung homogenization and flow cytometry protocols.
Financial support: National Institute of Allergy and Infectious Diseases, National Institutes of Health (grant AI47866).
Footnotes
Potential conflicts of interest: none reported.
References
- 1.Dye C, Bassili A, Bierrenbach AL, et al. Measuring tuberculosis burden, trends, and the impact of control programmes. Lancet Infect Dis. 2008;8:233–43. doi: 10.1016/S1473-3099(07)70291-8. [DOI] [PubMed] [Google Scholar]
- 2.Dye C, Scheele S, Dolin P, Pathania V, Raviglione MC. Consensus statement. Global burden of tuberculosis: estimated incidence, prevalence, and mortality by country. WHO Global Surveillance and Monitoring Project. JAMA. 1999;282:677–86. doi: 10.1001/jama.282.7.677. [DOI] [PubMed] [Google Scholar]
- 3.Bloom BR, Murray CJL. Tuberculosis: commentary on a reemergent killer. Science. 1992;257:1055–64. doi: 10.1126/science.257.5073.1055. [DOI] [PubMed] [Google Scholar]
- 4.Dye C, Hosseini M, Watt C. Did we reach the 2005 targets for tuberculosis control? Bull World Health Organ. 2007;85:364–9. doi: 10.2471/06.037580. [DOI] [PMC free article] [PubMed] [Google Scholar]
- 5.Caruso AM, Serbina N, Klein E, Triebold K, Bloom BR, Flynn JL. Mice deficient in CD4 T cells have only transiently diminished levels of IFN-gamma, yet succumb to tuberculosis. J Immunol. 1999;162:5407–16. [PubMed] [Google Scholar]
- 6.Scanga CA, Mohan VP, Yu K, et al. Depletion of CD4+ T cells causes reactivation of murine persistent tuberculosis despite continued expression of interferon gamma and nitric oxide synthase 2. J Exp Med. 2000;192:347–58. doi: 10.1084/jem.192.3.347. [DOI] [PMC free article] [PubMed] [Google Scholar]
- 7.Tascon RE, Stavropoulos E, Lukacs KV, Colston MJ. Protection against Mycobacterium tuberculosis infection by CD8+ T cells requires the production of gamma interferon. Infect Immun. 1998;66:830–4. doi: 10.1128/iai.66.2.830-834.1998. [DOI] [PMC free article] [PubMed] [Google Scholar]
- 8.Lazarevic V, Nolt D, Flynn JL. Long-term control of Mycobacterium tuberculosis infection is mediated by dynamic immune responses. J Immunol. 2005;175:1107–17. doi: 10.4049/jimmunol.175.2.1107. [DOI] [PubMed] [Google Scholar]
- 9.Saunders BM, Britton WJ. Life and death in the granuloma: immunopathology of tuberculosis. Immunol Cell Biol. 2007;85:103–11. doi: 10.1038/sj.icb.7100027. [DOI] [PubMed] [Google Scholar]
- 10.Gonzalez-Juarrero M, Shim TS, Kipnis A, Junqueira-Kipnis AP, Orme IM. Dynamics of macrophage cell populations during murine pulmonary tuberculosis. J Immunol. 2003;171:3128–35. doi: 10.4049/jimmunol.171.6.3128. [DOI] [PubMed] [Google Scholar]
- 11.Gonzalez-Juarrero M, Turner OC, Turner J, Marietta P, Brooks JV, Orme IM. Temporal and spatial arrangement of lymphocytes within lung granulomas induced by aerosol infection with Mycobacterium tuberculosis. Infect Immun. 2001;69:1722–8. doi: 10.1128/IAI.69.3.1722-1728.2001. [DOI] [PMC free article] [PubMed] [Google Scholar]
- 12.Ordway D, Palanisamy G, Henao-Tamayo M, et al. The cellular immune response to Mycobacterium tuberculosis infection in the guinea pig. J Immunol. 2007;179:2532–41. doi: 10.4049/jimmunol.179.4.2532. [DOI] [PubMed] [Google Scholar]
- 13.Hu C, Mayadas-Norton T, Tanaka K, Chan J, Salgame P. Mycobacterium tuberculosis infection in complement receptor 3-deficient mice. J Immunol. 2000;165:2596–602. doi: 10.4049/jimmunol.165.5.2596. [DOI] [PubMed] [Google Scholar]
- 14.Ordway D, Higgins DM, Sanchez-Campillo J, et al. XCL1 (lymphotactin) chemokine produced by activated CD8 T cells during the chronic stage of infection with Mycobacterium tuberculosis negatively affects production of IFN-γ by CD4 T cells and participates in granuloma stability. J Leukoc Biol. 2007;82:1221–9. doi: 10.1189/jlb.0607426. [DOI] [PubMed] [Google Scholar]
- 15.Seiler P, Aichele P, Bandermann S, et al. Early granuloma formation after aerosol Mycobacterium tuberculosis infection is regulated by neutrophils via CXCR3-signaling chemokines. Eur J Immunol. 2003;33:2676–86. doi: 10.1002/eji.200323956. [DOI] [PubMed] [Google Scholar]
- 16.Taylor JL, Hattle JM, Dreitz SA, et al. Role for matrix metalloproteinase 9 in granuloma formation during pulmonary Mycobacterium tuberculosis infection. Infect Immun. 2006;74:6135–44. doi: 10.1128/IAI.02048-05. [DOI] [PMC free article] [PubMed] [Google Scholar]
- 17.Hirai H, Maru Y, Hagiwara K, Nishida J, Takaku F. A novel putative tyrosine kinase receptor encoded by the eph gene. Science. 1987;238:1717–20. doi: 10.1126/science.2825356. [DOI] [PubMed] [Google Scholar]
- 18.Nakamoto M. Eph receptors and ephrins. Int J Biochem Cell Biol. 2000;32:7–12. doi: 10.1016/s1357-2725(99)00096-5. [DOI] [PubMed] [Google Scholar]
- 19.Brantley-Sieders DM, Caughron J, Hicks D, Pozzi A, Ruiz JC, Chen J. EphA2 receptor tyrosine kinase regulates endothelial cell migration and vascular assembly through phosphoinositide 3-kinase-mediated Rac1 GTPase activation. J Cell Sci. 2004;117:2037–49. doi: 10.1242/jcs.01061. [DOI] [PubMed] [Google Scholar]
- 20.Cheng N, Brantley DM, Liu H, et al. Blockade of EphA receptor tyrosine kinase activation inhibits vascular endothelial cell growth factor-induced angiogenesis. Mol Cancer Res. 2002;1:2–11. [PubMed] [Google Scholar]
- 21.Coulthard MG, Lickliter JD, Subanesan N, et al. Characterization of the Epha1 receptor tyrosine kinase: expression in epithelial tissues. Growth Factors. 2001;18:303–17. doi: 10.3109/08977190109029118. [DOI] [PubMed] [Google Scholar]
- 22.Wohlfahrt JG, Karagiannidis C, Kunzmann S, et al. Ephrin-A1 suppresses Th2 cell activation and provides a regulatory link to lung epithelial cells. J Immunol. 2004;172:843–50. doi: 10.4049/jimmunol.172.2.843. [DOI] [PubMed] [Google Scholar]
- 23.Aasheim HC, Delabie J, Finne EF. Ephrin-A1 binding to CD4+ T lymphocytes stimulates migration and induces tyrosine phosphorylation of PYK2. Blood. 2005;105:2869–76. doi: 10.1182/blood-2004-08-2981. [DOI] [PubMed] [Google Scholar]
- 24.de Saint-Vis B, Bouchet C, Gautier G, Valladeau J, Caux C, Garrone P. Human dendritic cells express neuronal Eph receptor tyrosine kinases: role of EphA2 in regulating adhesion to fibronectin. Blood. 2003;102:4431–40. doi: 10.1182/blood-2003-02-0500. [DOI] [PubMed] [Google Scholar]
- 25.Eberhart J, Swartz ME, Koblar SA, Pasquale EB, Krull CE. EphA4 constitutes a population-specific guidance cue for motor neurons. Dev Biol. 2002;247:89–101. doi: 10.1006/dbio.2002.0695. [DOI] [PubMed] [Google Scholar]
- 26.Eberhart J, Barr J, O'Connell S, et al. Ephrin-A5 exerts positive or inhibitory effects on distinct subsets of EphA4-positive motor neurons. J Neurosci. 2004;24:1070–8. doi: 10.1523/JNEUROSCI.4719-03.2004. [DOI] [PMC free article] [PubMed] [Google Scholar]
- 27.Krull CE, Lansford R, Gale NW, et al. Interactions of Eph-related receptors and ligands confer rostrocaudal pattern to trunk neural crest migration. Curr Biol. 1997;7:571–80. doi: 10.1016/s0960-9822(06)00256-9. [DOI] [PubMed] [Google Scholar]
- 28.Kullander K, Mather NK, Diella F, Dottori M, Boyd AW, Klein R. Kinase-dependent and kinase-independent functions of EphA4 receptors in major axon tract formation in vivo. Neuron. 2001;29:73–84. doi: 10.1016/s0896-6273(01)00181-7. [DOI] [PubMed] [Google Scholar]
- 29.Eberhart J, Swartz M, Koblar SA, Pasquale EB, Tanaka H, Krull CE. Expression of EphA4, ephrin-A2 and ephrin-A5 during axon outgrowth to the hindlimb indicates potential roles in pathfinding. Dev Neurosci. 2000;22:237–50. doi: 10.1159/000017446. [DOI] [PubMed] [Google Scholar]
- 30.Hjorthaug HS, Aasheim HC. Ephrin-A1 stimulates migration of CD8+CCR7+ T lymphocytes. Eur J Immunol. 2007;37:2326–36. doi: 10.1002/eji.200737111. [DOI] [PubMed] [Google Scholar]
- 31.Sharfe N, Freywald A, Toro A, Dadi H, Roifman C. Ephrin stimulation modulates T cell chemotaxis. Eur J Immunol. 2002;32:3745–55. doi: 10.1002/1521-4141(200212)32:12<3745::AID-IMMU3745>3.0.CO;2-M. [DOI] [PubMed] [Google Scholar]
- 32.Lande R, Giacomini E, Grassi T, et al. IFN-alpha beta released by Mycobacterium tuberculosis-infected human dendritic cells induces the expression of CXCL10: selective recruitment of NK and activated T cells. J Immunol. 2003;170:1174–82. doi: 10.4049/jimmunol.170.3.1174. [DOI] [PubMed] [Google Scholar]
- 33.Marsland BJ, Battig P, Bauer M, et al. CCL19 and CCL21 induce a potent proinflammatory differentiation program in licensed dendritic cells. Immunity. 2005;22:493–505. doi: 10.1016/j.immuni.2005.02.010. [DOI] [PubMed] [Google Scholar]
- 34.Plant L, Asp V, Lovkvist L, Sundqvist J, Jonsson AB. Epithelial cell responses induced upon adherence of pathogenic Neisseria. Cell Microbiol. 2004;6:663–70. doi: 10.1111/j.1462-5822.2004.00393.x. [DOI] [PubMed] [Google Scholar]
- 35.McGarvey JA, Wagner D, Bermudez LE. Differential gene expression in mononuclear phagocytes infected with pathogenic and non-pathogenic mycobacteria. Clin Exp Immunol. 2004;136:490–500. doi: 10.1111/j.1365-2249.2004.02490.x. [DOI] [PMC free article] [PubMed] [Google Scholar]
- 36.Ragno S, Romano M, Howell S, Pappin DJ, Jenner PJ, Colston MJ. Changes in gene expression in macrophages infected with Mycobacterium tuberculosis: a combined transcriptomic and proteomic approach. Immunology. 2001;104:99–108. doi: 10.1046/j.0019-2805.2001.01274.x. [DOI] [PMC free article] [PubMed] [Google Scholar]
- 37.Yamamoto T, Lasco TM, Uchida K, et al. Mycobacterium bovis BCG vaccination modulates TNF-alpha production after pulmonary challenge with virulent Mycobacterium tuberculosis in guinea pigs. Tuberculosis (Edinb) 2007;87:155–65. doi: 10.1016/j.tube.2006.07.002. [DOI] [PubMed] [Google Scholar]
- 38.Cirillo SL, Bermudez LE, El-Etr SH, Duhamel GE, Cirillo JD. Legionella pneumophila entry gene rtxA is involved in virulence. Infect Immun. 2001;69:508–17. doi: 10.1128/IAI.69.1.508-517.2001. [DOI] [PMC free article] [PubMed] [Google Scholar]
- 39.El-Etr SH, Yan L, Cirillo JD. Fish monocytes as a model for mycobacterial host-pathogen interactions. Infect Immun. 2001;69:7310–7. doi: 10.1128/IAI.69.12.7310-7317.2001. [DOI] [PMC free article] [PubMed] [Google Scholar]
- 40.Subbian S, Mehta PK, Cirillo SL, Bermudez LE, Cirillo JD. A Mycobacterium marinum mel2 mutant is defective for growth in macrophages that produce reactive oxygen and reactive nitrogen species. Infect Immun. 2007;75:127–34. doi: 10.1128/IAI.01000-06. [DOI] [PMC free article] [PubMed] [Google Scholar]
- 41.Park B, Subbian S, El-Etr SH, Cirillo SL, Cirillo JD. Use of gene dosage effects for a whole-genome screen to identify Mycobacterium marinum macrophage infection loci. Infect Immun. 2008;76:3100–15. doi: 10.1128/IAI.00015-08. [DOI] [PMC free article] [PubMed] [Google Scholar]
- 42.Rhoades ER, Orme IM. Similar responses by macrophages from young and old mice infected with Mycobacterium tuberculosis. Mech Ageing Dev. 1998;106:145–53. doi: 10.1016/s0047-6374(98)00113-4. [DOI] [PubMed] [Google Scholar]
- 43.Schreiber T, Ehlers S, Aly S, et al. Selectin ligand-independent priming and maintenance of T cell immunity during airborne tuberculosis. J Immunol. 2006;176:1131–40. doi: 10.4049/jimmunol.176.2.1131. [DOI] [PubMed] [Google Scholar]