

Summary
Despite the histological similarity of ependymomas from throughout the neuroaxis, the disease likely comprises multiple independent entities, each with a distinct molecular pathogenesis. Transcriptional profiling of two large independent cohorts of ependymoma reveals the existence of two demographically, transcriptionally, genetically, and clinically distinct groups of posterior fossa (PF) ependymomas. Group A patients are younger, have laterally located tumors with a balanced genome, and are much more likely to exhibit recurrence, metastasis at recurrence, and death compared with Group B patients. Identification and optimization of immunohistochemical (IHC) markers for PF ependymoma subgroups allowed validation of our findings on a third independent cohort, using a human ependymoma tissue microarray, and provides a tool for prospective prognostication and stratification of PF ependymoma patients.
Introduction
Ependymoma is the third most common brain tumor in children, and remains incurable in up to 45% of patients (Korshunov et al., 2010; Merchant et al., 2009). It arises throughout the neuroaxis, including the supratentorial brain (comprising the cerebral hemispheres), the posterior fossa (encompassing the cerebellum and brainstem), and in the spinal cord including the filum terminale (Louis et al., 2007). Both adults and children are affected, with posterior fossa tumors occurring more commonly in children and supratentorial and spinal tumors dominating in adulthood (Kilday et al., 2009). Clinical behavior is highly variable, with subsets of patients experiencing a rapidly fatal clinical course and others harboring relatively slow-growing variants capable of recurring up to 20 years after primary treatment (Bouffet et al., 1998; Grill et al., 2001; Korshunov et al., 2010). Current best clinical management of ependymoma includes maximal safe surgical resection followed by adjuvant radiotherapy (Kilday et al., 2009). No chemotherapeutic regimen has demonstrated a clear overall survival benefit in clinical trials for ependymoma. As a result, current five-year survival rates range from 39% to 64%, with five-year event-free survival rates of 23% to 45% (Zacharoulis et al., 2007). Attempts to develop targeted therapies for ependymoma have been hampered by the relative paucity of cell lines, xeno-grafts, or animal models of the disease compared with other intracranial neoplasms.
In spite of histopathological similarities, ependymomas are very heterogeneous tumors with disparate mRNA expression profiles, supporting the hypothesis that the histological entity “ependymoma” in fact comprises a group of related diseases (Taylor et al., 2005; Johnson et al., 2010). The genetic landscape of ependymoma is also heterogeneous, with subsets of tumors exhibiting frequent gross numerical chromosomal alterations and others displaying only single focal aberrations, or even a balanced genome. A recurrent observation in several tumor cohorts is that up to 50% of posterior fossa cases have balanced genomic profiles (Johnson et al., 2010; Korshunov et al., 2010; Mendrzyk et al., 2006; Dyer et al., 2002; Carter et al., 2002). A molecular model for prognostication of pediatric and adult ependymomas was recently published based upon tumors with specific genomic aberrations, or the absence of copy number alterations (Korshunov et al., 2010).
Further addressing the genetic heterogeneity of ependymoma, Johnson et al. reported a comprehensive study cataloguing DNA copy-number alterations in subgroups of ependymoma defined by messenger RNA (mRNA) and microRNA (miRNA) profiles (Johnson et al., 2010). Remarkably, they generated a mouse model of supratentorial ependymoma and present supporting evidence that the cell-of-origin for supratentorial ependymoma resides in the radial glial lineage (Johnson et al., 2010; Taylor et al., 2005). Evidence for a molecular “driver” alteration and a cell-of-origin for posterior fossa ependymoma is still lacking. We have now applied genomic methodologies to three independent cohorts of human ependymomas to uncover the extent of intertumoral molecular heterogeneity and the nature of the clinically relevant subgroups of posterior fossa ependymoma.
Results
Consensus Clustering Identifies Three Principal Molecular Subgroups of Ependymoma
Gene expression profiles were generated from two non-overlapping cohorts of WHO grade II and III ependymomas. One-hundred-two samples were analyzed in Toronto on the Affymetrix Exon 1.0ST array (Santa Clara, CA), and 75 samples were analyzed in Heidelberg on the Agilent two-color 4×44K microarray (Santa Clara, CA). Based upon the median absolute deviation, the 1000 most varying genes in each dataset were used to perform consensus hierarchical clustering (HCL) from 2 to 10 subgroups (Figure 1A; see Figure S1A available online) (Monti et al., 2003). Despite varying the initial number of input genes, we consistently found three large and stable clusters in both independent datasets that were generated using distinct technologies (Figure 1B; Figures S1B and S1C). The Toronto cohort (n = 102) was divided into 3 subgroups of 31 (31%) largely supratentorial (ST), 39 (38%) largely posterior fossa (PF), and 32 (31%) spinal and posterior fossa (SP+PF) tumors, whereas the Heidelberg cohort (n = 75) was divided into 3 subgroups of 28 (37%) (ST), 18 (24%) (PF), and 29 (39%) (SP+PF) tumors (Table 1; Figures S1D–S1F).
Figure 1. Identification of Three Primary Molecular Classes of Ependymoma.

(A) Area under empirical cumulative distribution plots (k = 2 to k = 10), generated from consensus hierarchical clustering of 102 Toronto and 75 Heidelberg samples identifies strongest statistical support for the existence of three primary subgroups of ependymoma. (k denotes the number of clusters)
(B) Consensus HCL heatmaps displaying the three robust subgroups of ependymoma defined by gene expression.
(C) Consensus NMF of 102 Toronto and 75 Heidelberg samples at k = 3 demonstrates significant concordance with the consensus HCL subgroup classification. Significance of similarity was determined by a Rand index and permutation testing of the Toronto sample labels (see experimental procedures).
(D) Significance of HCL subgroup classifications in both datasets determined by pairwise comparisons between all clusters using SigClust.
(E) Silhouette analysis identifies “core” samples defined as tumors with positive silhouette values.
(F) Submap analysis demonstrates that the HCL-defined clusters identified in the Toronto cohort are nearly identical to the HCL-defined clusters defined in the Heidelberg cohort. Significance of similarity measured by FDR-corrected p value.
See also Figure S1.
Table 1. Overall Comparison of Three Ependymoma Subgroups and Group A and B in both Gene Expression Profiling Cohorts.
| Heidelberg Subgroups | Toronto Subgroups | Heidelberg PF tumors | Toronto PF tumors | Both Cohorts | PF Subgroups | ||||||||||
|---|---|---|---|---|---|---|---|---|---|---|---|---|---|---|---|
| ST | PF+SP | PF | ST | PF+SP | PF | Grp B | Grp A | Grp B | Grp A | ST | PF+ SP | PF | Grp B | Grp A | |
| Number of Patients | 28 | 29 | 18 | 31 | 32 | 39 | 20 | 18 | 13 | 34 | 59 | 61 | 57 | 33 | 52 |
| Age (years) | |||||||||||||||
| Median | 14 | 30 | 5.5 | 8 | 18 | 2 | 24 | 5.5 | 10 | 2 | 10 | 25 | 4 | 20 | 2.5 |
| >18 | 12 | 21 | 2 | 4 | 16 | 0 | 13 | 2 | 3 | 0 | 27% | 61% | 4% | 48% | 4% |
| 4-18 | 16 | 7 | 10 | 17 | 13 | 16 | 7 | 10 | 9 | 12 | 56% | 33% | 46% | 48% | 42% |
| <4 | 0 | 1 | 6 | 8 | 2 | 23 | 0 | 6 | 1 | 22 | 14% | 5% | 51% | 3% | 54% |
| Gender | |||||||||||||||
| Female | 15 | 14 | 7 | 15 | 11 | 15 | 9 | 7 | 5 | 13 | 51% | 41% | 39% | 42% | 38% |
| Male | 13 | 15 | 11 | 14 | 19 | 24 | 11 | 11 | 8 | 21 | 46% | 56% | 61% | 58% | 62% |
| Localization | |||||||||||||||
| Supratentorial | 25 | 1 | 0 | 24 | 5 | 2 | 0 | 0 | 0 | 0 | 82% | 10% | 4% | 0% | 0% |
| Posterior fossa | 1 | 20 | 18 | 4 | 14 | 36 | 20 | 18 | 13 | 34 | 8% | 56% | 95% | 100% | 100% |
| Spinal | 2 | 8 | 0 | 1 | 13 | 1 | 0 | 0 | 0 | 0 | 5% | 34% | 2% | 0% | 0% |
| Histologic grade | |||||||||||||||
| WHO°II | 8 | 17 | 8 | — | — | — | 9 | 8 | — | — | — | — | — | — | — |
| WHO°III | 20 | 12 | 10 | — | — | — | 11 | 10 | — | — | — | — | — | — | — |
| Level of resection | |||||||||||||||
| Complete | 15 | 13 | 8 | — | — | — | 13 | 8 | — | — | — | — | — | — | — |
| Incomplete | 11 | 8 | 10 | — | — | — | 7 | 10 | — | — | — | — | — | — | — |
| Radiotherapy | |||||||||||||||
| Yes | 22 | 16 | 9 | — | — | — | 16 | 9 | — | — | — | — | — | — | — |
| No | 4 | 5 | 9 | — | — | — | 4 | 9 | — | — | — | — | — | — | — |
| Metastasis at time of recurrence | |||||||||||||||
| Yes | 8 | 3 | 4 | — | — | — | 3 | 4 | — | — | — | — | — | — | — |
| No | 20 | 26 | 14 | — | — | — | 17 | 14 | — | — | — | — | — | — | — |
| Recurrence | |||||||||||||||
| Yes | 17 | 7 | 10 | — | — | — | 5 | 9 | — | — | — | — | — | — | — |
| No | 11 | 22 | 8 | — | — | — | 15 | 9 | — | — | — | — | — | — | — |
| Death | |||||||||||||||
| Yes | 11 | 1 | 6 | — | — | — | 1 | 6 | — | — | — | — | — | — | — |
| No | 17 | 28 | 12 | — | — | — | 19 | 12 | — | — | — | — | — | — | — |
| Survival probability (%) | |||||||||||||||
| 5 year PFS | 41 | 79 | 52 | — | — | — | 79 | 47 | — | — | — | — | — | — | — |
| 5 year OS | 72 | 96 | 69 | — | — | — | 95 | 69 | — | — | — | — | — | — | — |
In addition, we performed consensus clustering using non-negative matrix factorization (NMF) (Brunet et al., 2004) and determined that both HCL and NMF subgroup assignments were highly concordant (Figure 1C; Rand index: Toronto = 0.96, Heidelberg = 0.85, p < 0.0001). Using SigClust (Liu et al., 2008), we performed all pairwise comparisons between HCL-defined subgroups and determined that all three subgroups were statistically significant (Figure 1D). Silhouette analysis (Rousseeuw, 1987) demonstrated that 96% of samples in the Toronto and Heidelberg datasets had positive silhouettes and thus were representative of their cluster assignments (Figure 1E). As performed previously (Verhaak et al., 2010), samples with positive silhouettes were defined as “core samples,” and 7/177 (4%) samples exhibiting negative silhouettes were removed from subsequent analyses. Therefore, using both consensus HCL and NMF, we found 3 principal subgroups of ependymoma divided largely according to their anatomical location into ependymomas arising from: (1) The ST, (2) the PF, and (3) PF+SP tumors (Table 1; Figure S1E).
We next asked whether the same sets of genes defined the same three subgroups in both independent datasets. To this end, we identified common subtypes across the two datasets by Subclass mapping, and confirmed that the subgroups identified in both datasets were nearly identical (Figure 1F) (Hoshida et al., 2007). Furthermore, we demonstrated that the subgroups were derived from distinct anatomical locations, a finding largely consistent with our prior publication (Taylor et al., 2005). We conclude that there are three transcriptionally defined principal subgroups of ependymoma, and that a subset of posterior fossa ependymomas is more similar to spinal tumors.
Identification of Two Molecularly and Clinically Distinct Groups of Posterior Fossa Ependymoma
Principal component analysis with the same 1000 most varying genes in each dataset robustly demonstrates two distinct subgroups of PF ependymoma (Figure 2A). The group comprised purely of PF ependymomas was designated Group A, whereas PF tumors that clustered with spinal ependymomas in the previous analysis (PF+SP) were designated Group B tumors (Figures 1B and 1C). The 100 most influential genes discriminating the two groups were identified using the Goeman's global test (Goeman et al., 2004). Signature genes discriminating Group A from Group B were highly concordant across both datasets, as illustrated in Figure 2B.
Figure 2. Transcriptome Analysis Distinguishes Two Distinct Subgroups of Posterior Fossa Ependymoma.

(A) Graphical illustration of global differences between the transcriptomes of Group A and Group B PF ependymomas determined by principal component analysis. Individual tumor samples are represented as spheres, (red = Group A, blue = Group B) and ellipsoids display two standard deviations around each subgroup.
(B) Heatmap of the top 100 most discriminating genes between Group A and Group B ependymomas, in both datasets, as calculated by Goeman's Global Test statistic.
(C) Box plots demonstrating the association of Group A ependymomas with younger age at diagnosis, and Group B ependymomas with older age at diagnosis. Median age is also indicated. p-values were determined by a Mann-Whitney U test.
(D–G) Pie charts demonstrating an association of Heidelberg Group A ependymomas with lateral localization, cerebellar invasion, increased recurrence, and death within 5 years from diagnosis compared with Group B tumors. Statistical significance of PF location and incidences of recurrence and death were determined by Fisher's exact test.
(H) Kaplan-Meier survival curves demonstrating a worse progression-free and overall survival in Group A versus Group B ependymomas. Statistical significance was determined by a log-rank test.
See also Table S1 and Figure S2.
In the Toronto and Heidelberg datasets, both independently and combined, Group A tumors arose in younger patients (median age 2.5 years), whereas Group B tumors occurred predominantly in older patients (median age 20) (Table 1 and Figure 2C, p < 0.0001, Mann-Whitney U test). Anatomically, 67% of Group A tumors occurred laterally, where as 95% of Group B ependymomas occurred in the midline (Figure 2D, p < 0.0001, Fisher's exact test). Further, Group A tumors were more likely to show invasive growth into the cerebellum on neuropathological examination (Figure 2E, p = 0.04, Fisher's exact test). After subgroup analysis, detailed neuropathological re-examination of both Group A and Group B PF ependymomas did not reveal any histological differences. Further, the frequency of Grade II and III tumors was similar (Table 1). Patients with 5 years of follow-up, harboring Group A ependymomas, exhibited a significantly increased incidence of recurrence (Figure 2F, p = 0.0424, Fisher's exact test) and mortality (Figure 2G, p = 0.0164, Fisher's exact test). Five-year progression-free and overall survival rates were 47% and 69% for Group A tumors (Figure 2H, p = 0.017, log-rank test) and 79% and 95% for Group B tumors (Figure 2H, p = 0.0048, log-rank test). Detailed clinical information for Groups A and B tumors of the Toronto and Heidelberg cohort can be found in Table S1.
We next compared various clinical parameters within Groups A and B assessing the independence of age, level of resection, and radiotherapy on patient survival. Progression-free and overall survival of Group B patients was not prognostically significant when comparing age (above or below 18 years), use of radiotherapy, and level of resection (Figures S2A–S2C). For Group A tumors, no prognostic significance was observed related to age (Figure S2D; above or below 4 years). Group A patients who received radiotherapy demonstrated an increased progression-free survival; however, no improvement in overall survival was observed (Figure S2E). In contrast with Group B tumors, only Group A patients had an improved progression-free and overall survival where gross total resection was achieved (Figure S2F). Group A ependymomas occurring in the midline had an improved progression-free and overall survival compared with those occurring laterally (Figure S2G). We conclude that the two subgroups of PF ependymoma identified through transcriptional profiling are both molecularly and clinically distinct, and that their differences are highly clinically significant and relevant.
PF Ependymoma Subgroup-Specific Chromosomal Aberrations
We analyzed all samples from both cohorts, studied by gene expression profiling, for which sufficient amounts of DNA were available (n = 152), by array comparative genomic hybridization (aCGH) (Figure S3A). Genomic profiles of ependymoma samples from the Heidelberg cohort have been described previously (Korshunov et al., 2010). Group A and Group B ependymomas were identified as outlined here previously, yielding 75 tumors where both subgroup assignment and aCGH data were available. Group A tumors exhibited a largely balanced genomic profile, with an increased occurrence of chromosome 1q gain compared with Group B (Figures 3A and 3B; p = 0.0437, Fisher's exact test). Normal cell contamination in Group A is a less likely explanation for the balanced genomic landscape observed because the majority of samples were composed of tumor cells (≥80%) by hematoxylin and eosin staining (Figure S3B), and because chromosome 1q gains, when present, were found in the majority of cells as shown by fluorescence in situ hybridization (FISH) (Figure S3C). Finally, we compared the copy number intensities derived from the aCGH signals for chromosome 1q gain, 6q loss, and 9q gain, and demonstrated that chromosomal aberrations in Group A had similar intensities as aberrations in Group B (Figure S3D). This is in line with previous reports that a large proportion of PF ependymoma exhibit a balanced genomic profile (Johnson et al., 2010; Korshunov et al., 2010; Mendrzyk et al., 2006; Dyer et al., 2002; Carter et al., 2002). In contrast, Group B ependymomas exhibited numerous cytogenetic abnormalities involving whole chromosomes or chromosomal arms, including loss of chromosome 1, 2, 3, 6, 8, 10, 14q, 17q, and 22q, and gain of 4, 5q, 7, 9, 11, 12, 15q, 18, 20, and 21q (Figures 3A and 3B). Chromosomal aberrations also classified tumors into the recently described cytogenetic risk groups (Korshunov et al., 2010). Group A ependymomas included predominantly high-risk groups 2 (Figure 3A; p = 0.0001, Fisher's exact test) and 3 (p = 0.0423, Fisher's exact test), whereas the vast majority of Group B tumors were classified into the low-risk group 1 (p < 0.0001, Fisher's exact test). We conclude that PF Group A and Group B ependymomas have distinct somatic genetic events in addition to the transcriptional and clinical differences described before.
Figure 3. Identification of Subgroup-Specific Copy Number Alterations in the Posterior Fossa Ependymoma Genome.

(A) Copy number profiling of 75 PF ependymomas using 10K array-CGH identifies disparate genetic landscapes between Group A and Group B tumors. Toronto and Heidelberg copy number datasets have been combined and summarized in a heatmap. The heatmap also displays the association of tumors to cytogenetic risk groups 1, 2, and 3 (Korshunov et al., 2010). Statistically significant chromosomal aberrations (black boxes) are also displayed between both subgroups, calculated by Fisher's exact test.
(B) Median averaged frequencies of DNA copy-number alterations of 45 Group A and 30 PF Group B tumors plotted against their chromosomal position.
See also Figure S3.
Identification of Biological Pathways and Processes Discriminating PF Group A and PF Group B Ependymomas
We performed Gene Set Enrichment Analysis (Subramanian et al., 2005) to identify biological processes and signaling pathways distinguishing Group A from Group B ependymomas. Gene sets were compiled from the National Cancer Institute (NCI), Kyoto Encyclopedia of Genes and Genomes (KEGG), Protein Families (PFAM), Biocarta, and Gene Ontology (GO) pathway databases. Significant gene sets (FDR < 0.035, p < 0.01) were visualized as interaction networks with Cytoscape and Enrichment Map (Figure 4; see also Figures S4A and S4B and Table S2) (Merico et al., 2010). Group B ependymomas were defined by gene sets involved in ciliogenesis/microtubule assembly and mitochondria/oxidative metabolism. Group A ependymomas were characterized by numerous cancer-related networks, namely angiogenesis (HIF-1α signaling, VEGF signaling, cell migration), PDGF signaling, MAPK signaling, EGFR signaling, TGF-b signaling, integrin signaling, extracellular matrix assembly, tyrosine-receptor kinase signaling, and RAS/ small GTPase signaling. The clear difference in active biological pathways between Group A and Group B supports their distinct natures and suggests possible avenues for future subgroup-specific targeted therapies.
Figure 4. Gene Set Enrichment Analysis Delineates Biological Pathways and Processes that Define Two Distinct Variants of Posterior Fossa Ependymoma.

Gene Set Enrichment Analysis (GSEA) comparing Group A (red) against Group B (blue) PF ependymoma in the Toronto dataset, illustrating distinct pathways and biological processes between both subgroups (3.5% FDR, p = 0.01). Cytoscape and Enrichment Map were used for visualization of the GSEA results. Nodes represent enriched gene sets, which are grouped and annotated by their similarity according to related gene sets. Enrichment results were mapped as a network of gene sets (nodes). Node size is proportional to the total number of genes within each gene set. Proportion of shared genes between gene sets is represented as the thickness of the green line between nodes. This network map was manually curated removing general and uninformative sub-networks, resulting in a simplified network map shown in Figure 4. Fully detailed Toronto and Heidelberg network maps are illustrated in Figure S4, and GSEA results can be found in Table S2.
Validation of PF Ependymoma Subgroups
Proper validation of the two subgroups of PF ependymoma requires the use of an orthogonal technology applied to an additional and independent cohort of ependymomas. We selected immunohistochemistry (IHC) markers representative of each PF subgroup, and stained a TMA comprised of a completely non-overlapping cohort of 265 PF ependymomas. Using the Goeman's global test statistic (Goeman et al., 2004), subgroup markers were selected from the transcriptional data by first ranking genes according to their “influence score” in both the Toronto and Heidelberg datasets (Figure 5A; Figure S5A). The “influence score” measures the degree that each gene can distinguish between pre-defined classes or subgroups, in this case Groups A and B. We selected the genes that showed highest ranks in both datasets for Groups A and Group B. Laminin alpha-2 (LAMA2), which exhibited an increase in expression in Group A versus Group B, was selected as a marker of Group A (Figure 5B; p< 0.0001, unpaired t-test). Neural Epidermal Growth Factor Like-2 (NELL2), which exhibited an increase in expression in Group B versus Group A, was selected as a marker of Group B (Figure 5B; p < 0.0001, unpaired t-test). To assure future routine clinical applicability of our markers, we prioritized selection and optimization of commercially available antibodies to LAMA2 and NELL2 as markers of Group A and Group B PF ependymoma, respectively (Figure 5C). We next confirmed that the gene expression of LAMA2 and NELL2 in the Heidelberg gene expression profiling cohort were highly concordant with protein expression by IHC (Figure S5B). Ninety-four percent (17/18) of tumors classified as Group A were positive for LAMA2, and 100% (19/19) of tumors classified as Group B were also positive for NELL2. We proceeded to stain our TMA validation set consisting of 265 PF ependymomas; 32% stained positive for LAMA2 and negative for NELL2, 52% stained positive for NELL2 and negative for LAMA2, 8% stained positive for both markers, and 8% stained negative for both markers (Figure 5D). Detailed clinical information on tumors staining for LAMA2 or NELL2 in the validation cohort is summarized in Table S3.
Figure 5. Selection and Optimization of PF Ependymoma Group A- and Group B-Specific IHC Markers.
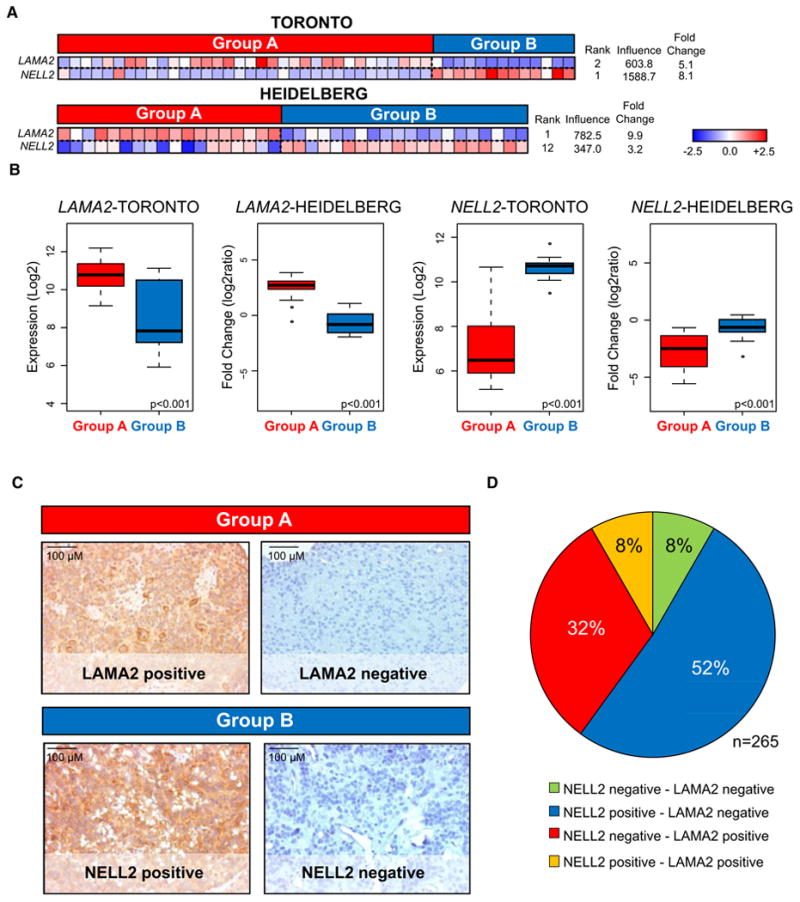
(A) Subgroup-specific expression patterns of selected markers, LAMA2 and NELL2, illustrated by heatmaps in both datasets. Candidate genes were identified using the Goeman's global test, which assigns a score to each gene based upon its degree of discrimination between defined classes: Group A and Group B.
(B) Box plots derived from mRNA expression data displaying overall differences between markers representing Group A (LAMA2) and Group B (NELL2) in the Toronto and Heidelberg cohorts. Comparisons were performed using an unpaired t-test.
(C) Representative immunohistochemistry (IHC) staining of LAMA2 and NELL2 on an ependymoma tissue microarray (TMA) composed of 265 PF ependymomas.
(D) Pie chart illustrating the distribution of TMA staining for NELL2 and LAMA2. Eight-four percent of posterior fossa ependymomas stain positive for a single marker.
See also Table S3 and Figure S5.
Using LAMA2 and NELL2 as markers of Groups A and B, respectively, we next attempted to validate the predominant pathways identified by GSEA within the TMA cohort. In Group B we focused on the most over-represented Group B signaling pathway: ciliogenesis and microtubule assembly. We selected Kinesin Family Member 27 (KIF27) as an established marker of cilia signaling in other brain neoplasms (Rink et al., 2009; Wilson et al., 2009) and demonstrated that 91% of NELL2+/LAMA2-tumors (hereafter Group B) stained positive, whereas 17% of NELL2-/LAMA2+ tumors (hereafter Group A) showed a pattern of positivity (Figures S5C and S5E). From our GSEA analysis, extracellular matrix signaling was the most significantly enriched Group A pathway. We therefore selected Tenascin-C (TNC), a type of matrix glycoprotein, which has been reported to be upregulated in pediatric ependymoma, as a marker of ECM signaling (Puget et al., 2009; Korshunov et al., 2002). Ninety-four percent of Group A tumors stained positive for TNC, and only 11% of Group B tumors showed positivity (Figures S5D and S5E). These IHC experiments provide a degree of validation for the predominant subgroup-specific pathways identified using GSEA.
Using FISH, we next attempted to validate the most prominent genomic alterations identified from the Toronto and Heidelberg aCGH dataset in the TMA cohort. We confirmed that Group B patients frequently harbored chromosome 6q loss, 9q gain, 15q gain, 18q gain, and 22q loss, whereas Group A patients were represented only by chromosome 1q gain (Figure 6A). Interestingly, Group A patients with chromosome 1q gain, a marker of poor outcome (Mendrzyk et al., 2006; Korshunov et al., 2010), exhibited no difference in survival outcome compared with Group A patients who did not possess this aberration (Figure S6C). Group A tumors were largely classified into cytogenetic moderate-risk group 2 and cytogenetic high-risk group 3 (Korshunov et al., 2010), whereas Group B tumors were predominantly cytogenetic low-risk group 1. This provides additional molecular evidence in a third independent cohort to support the distinction of Group A and B tumors as defined by LAMA2 and NELL2 immunopositivity, respectively.
Figure 6. Clinical and Cytogenetic Characteristics Distinguishing IHC-Defined Group A and B Subgroups in a Third Nonoverlapping Posterior Fossa Ependymoma Cohort.

(A) Comparing subgroup-specific cytogenetic aberrations and risk group classifications (Korshunov et al., 2010) between NELL2–/LAMA2+ and NELL2+/LAMA2– tumors of the TMA validation cohort. The heatmap illustrates the association of cytogenetic risk groups 2 and 3 with NELL2–/LAMA2+ tumors, and cytogenetic risk group 1 aberrations with NELL2+/LAMA2– tumors. Statistical significance was performed by Fisher's exact test (n = 155). NELL2+/LAMA2– tumors show a greater extent of genomic instability as expected from the increased genomic instability seen in Group B tumors in the discovery datasets. Conversely, NELL2–/LAMA2+ tumors exhibit a more balanced genomic profile, with chromosome 1q gain identified as the only significant chromosomal aberration.
(B-G) Comparing subgroup-specific demographic and clinical information in the validation cohort illustrated by:
(B) Box plots for age indicating that NELL2-/LAMA2+ tumors represent a significantly younger population than NELL2+/LAMA2— tumors;
(C and D) Bar graphs demonstrating that NELL2-/LAMA2+ tumors are over-represented by males and WHO Grade III tumors;
(E-G) Kaplan-Meier plots demonstrate that NELL2-/LAMA2+ tumors have an earlier time to metastasis and have a poorer progression-free and overall survival than NELL2+/LAMA2- tumors. Statistical significance of age was determined by a Mann-Whitney U test, gender and grade by a Fisher's exact test, and time to metastasis and survival by a log-rank test.
(H and I) Limiting to gross-totally resected cases, Kaplan-Meier curves demonstrating that NELL2-/LAMA2+ tumors have a significantly poorer survival than NELL2+/LAMA2- tumors. Statistical significance was determined by a log-rank test.
See also Table S4 and Figure S6.
We also observed numerous clinical disparities between Group A and B patients of the validation cohort consonant, with the differences observed in the gene expression cohorts (Table S4). Patients with Group A ependymomas were significantly younger (median age 4 versus 39 years) (Figure 6B; p < 0.0001, Mann-Whitney U test). Patients with Group A tumors were more commonly male (Figure 6C; p=0.0076, Fisher's exact test) and more frequently classified as WHO grade III ependymomas (Figure 6D; p < 0.0001, Fisher's exact test). Patients with Group A ependymomas had a higher incidence of metastases at the time of recurrence and had a significantly diminished prognosis compared with Group B patients (Figures 6E–6G; p < 0.0001, log-rank test). Progression-free and overall survival rates were of 24% and 48%, respectively, for Group A tumors and 92% and 98%, respectively, for Group B tumors (Figures 6F and 6G; p < 0.0001, log-rank test). When cases stained for both or none of the two markers, these tumors had no association with metastasis at time of recurrence and formed two intermediate patient survival groups (Figures 6E-6I). Further, 82% of tumors that fail to stain for either LAMA2 or NELL2 are WHO °III; in contrast tumors immunopositive for both markers are equally distributed (Figures S6A and S6B). We conclude that Group A tumors are clinically and molecularly distinct from Group B tumors, have a worse prognosis, and can be identified through routine IHC staining of formalin-fixed, paraffin-embedded sections for LAMA2 and NELL2.
A major determinant of long-term survival in ependymomas is the extent of surgical resection, and indeed extent of resection is an important independent variable on a Cox proportional hazard model for the entire current cohort of PF tumors that does not account for subgroups (Table S5 and Figure S6D) (Bouffet et al., 1998; Merchant et al., 2004). Because Group A ependymomas are more commonly located laterally in the cerebellopontine angle, we questioned whether the observed differences in outcome were secondary to a decreased incidence of gross total resection. However, we found that patients with Group B tumors, amenable to gross total resection, displayed a 5-year progression-free and overall survival rate of 91% and 100%, respectively, as opposed to patients with gross totally-resected Group A tumors, who exhibited worse progression-free and overall survival rates of 18% and 52%, respectively (Figures 6H and 6I; p < 0.0001, log-rank test). These data clearly suggest that the difference in prognosis between PF ependymoma subgroups is not solely based on a diminished incidence of gross total resection among patients with Group A tumors.
We next compared various clinical variables within Groups A and B. In the case of extent of resection, prognostic relevance was observed only in the progression-free survival of patients with Group A tumors (Figure S6E), whereas patients with Group B tumors exhibited no improvement in either progression-free or overall survival regardless of gross total resection status (Figure S6F). Further, Kaplan-Meier analyses illustrate that age and radiotherapy did not have significant prognostic value for patients when they were stratified into Group A or B (Figures S6G-S6J). However, a trend toward improvement in survival was observed specifically in Group B patients who received radiotherapy. Multivariate analysis using a Cox proportional hazard model that included gender, extent of resection, age, WHO grade, use of radiotherapy, NELL2 staining (Group B), and LAMA2 staining (Group A) revealed that our histological markers were the best independent predictors of both overall and progression-free survival (Table 2) in patients with PF ependymoma. In datasets that o not account for PF molecular subgroup, extent of resection is the most prognostic variable. After accounting for PF subgroup, extent of resection is no longer prognostic for overall survival and has a lower influence on progression-free survival prediction (Table 2) compared with an analysis that does not include subgroup assignment (Table S5). Although these data will need to be repeated and validated in the setting of a prospective clinical trial, the midline location, lack of cerebellar invasion, and older age at diagnosis in Group B tumors likely lead to a higher incidence of gross total resection, and some of the prognostic effects noted in prior publications for gross total resection are likely a surrogate marker for Group B, as opposed to the more difficult-to-resect Group A tumors, which are invasive and located laterally in the cerebellopontine angle of infants.
Table 2. Cox Proportional Hazards Models for Overall Survival and Progression-Free Survival of Posterior Fossa Ependymoma of TMA Validation Cohort.
| Variable | Hazard Ratio | 95% CI | P valuea |
|---|---|---|---|
| Overall Survival | |||
| Gender (male versus female) | 1.42 | 0.67-3.04 | 0.3591 |
| Resection (GTR versus STR) | 0.66 | 0.32-1.34 | 0.2470 |
| Age, years (4-18 versus <4) | 1.81 | 0.77-4.25 | 0.1746 |
| Histology (grade 3 versus grade 2) | 1.92 | 0.79-4.68 | 0.1486 |
| Age, years (>18 versus <4) | 0.44 | 0.16-1.24 | 0.1202 |
| Radiotherapy (yes versus no) | 0.29 | 0.11-0.77 | 0.0135 |
| NELL2 (positive versus negative) | 0.12 | 0.03-0.44 | 0.0012 |
| LAMA2 (positive versus negative) | 10.55 | 2.81-39.60 | 0.0005 |
| Progression-Free Survival | |||
| Gender (male versus female) | 1.17 | 0.74-1.85 | 0.5037 |
| Radiotherapy (yes versus no) | 0.80 | 0.44-1.47 | 0.4744 |
| Age, years (4-18 versus <4) | 0.68 | 0.34-1.35 | 0.2686 |
| Histology (grade 3 versus grade 2) | 1.42 | 0.79-2.57 | 0.2423 |
| Age, years (>18 versus <4) | 1.80 | 0.99-3.27 | 0.0535 |
| Resection (GTR versus STR) | 0.53 | 0.34-0.83 | 0.0061 |
| NELL2 (positive versus negative) | 0.32 | 0.17-0.61 | 0.0005 |
| LAMA2 (positive versus negative) | 8.45 | 4.08-17.49 | <0.0001 |
No. of patients with fossa posterior ependymoma = 265; CI, confidence interval.
Wald Test.
Discussion
Our data support the existence of two molecularly distinct groups of PF ependymoma that, although histologically similar, differ in their demographic, transcriptional, clinical, and outcome characteristics. The strength of this hypothesis is supported by our approach using two non-overlapping cohorts of PF ependymomas, studied in two geographic locations, with two distinct expression array technologies, and then subsequent validation using an orthogonal technology, on a third independent cohort of PF ependymomas. Our study of 583 ependymomas represents the largest cohort of ependymomas analyzed to date.
A prior publication studying a smaller cohort of ependymomas (29 total tumors) demonstrated that ependymomas from different regions of the nervous system (supratentorial, posterior fossa, and spine) had regionally-specific transcriptional profiles and somatic genetic events, suggesting that ependymomas from different regions of the nervous system were separate entities (Taylor et al., 2005). It is noteworthy that in this publication, all of the supratentorial tumors cluster together, as do all of the spinal ependymomas. However, the spinal tumors cluster between two groups of posterior fossa ependymomas, in keeping with the findings of the current manuscript where some PF ependymomas (Group B) are more similar to spinal ependymomas than they are to the other subgroup of PF ependymomas (Group A).
A recent publication described a mouse model of supratentorial ependymoma that was generated by transplanting neural stem cells harboring a combination of deletion of Ink4a/Arf−/− and/or overexpression of Ephb2 (Johnson et al., 2010). These mice developed supratentorial tumors that showed similar patterns of gene expression and cytogenetic events to 1 of 4 subgroups of supratentorial ependymoma identified from studying a total of 83 human ependymomas. The same study also indicated molecular heterogeneity within posterior fossa tumors, but this aspect was not a focus of the study and no correlation with clinical outcome was presented for the PF tumors. Inspection of the subgroups from Johnson et al. reveals a subgroup that includes both PF and spinal ependymomas, that is genomically unstable, that includes many adults, (Johnson et al., subgroup F) and therefore is similar to PF Group B in the current manuscript. The Johnson et al. study also describes three subgroups comprised almost exclusively of PF ependymomas (Johnson et al., subgroups G, H, and I), which show few cytogenetic aberrations other than gain of chromosome 1q, include a large number of infants, and are therefore similar to the Group A described in the current manuscript. In line with previous reports, we conclude that a subset of ependymomas, labeled in this study as Group A, exhibit a largely balanced chromosomal profile (Johnson et al., 2010; Korshunov et al., 2010; Mendrzyk et al., 2006; Dyer et al., 2002; Carter et al., 2002). The high degree of genomic instability in Group B and association with an improved prognosis is a paradoxical trend that has been observed in other neoplasms of the breast, stomach, and lung (Birkbak et al., 2011).
In our study, chromosome 22 loss was one of the most frequent genomic alterations, occurring often in Group B PF tumors and rarely in Group A tumors. Neurofibromin-2 (NF2), located at chromosome 22q12.2, is thought to be the candidate tumor suppressor gene of this region because patients with NF2 mutations develop numerous neuro-epithelial neoplasms including spinal ependymoma. However, NF2 mutations have been found exclusively in ependymomas of the spinal cord, highly suggesting the existence of another chromosome 22q tumor suppressor gene in the case of PF ependymoma (Ebert et al., 1999).
Examination of molecular pathways characterizing the two PF ependymoma subgroups revealed two diverse patterns of alteration, again suggesting the existence of two biologically distinct classes of posterior fossa ependymoma. In Group B ependymomas, only two pathways—ciliogenesis/microtubule assembly and mitochondrial/oxidative metabolism—were exclusively deregulated. A more heterogeneous picture of pathway alteration was seen in Group A tumors, including several canonical cancer-associated pathways. Among them were angiogenesis (HIF-1α signaling, VEGF pathway), PDGF signaling, MAPK signaling, EGFR signaling, TGF-β signaling, tyrosine-receptor kinase signaling, RAS signaling, and integrin/ECM signaling. Molecular research into the pathways driving Groups A and B may yield targets for subgroup-specific therapy. Because Group A patients have poor outcome, and because there are no currently known effective chemotherapeutic regimens in ependymoma, the therapeutic threshold would be very low in this underserved patient population. Also, the highly distinct Groups A and B signaling pathways may also be reflective of different cells of origin, in keeping with a mechanism that has recently been shown for supratentorial ependymoma (Johnson et al., 2010) and for Wnt subgroup medulloblastoma (Gibson et al., 2010). The transcriptional profiles of Groups A and B presented in this manuscript will serve as a resource to help guide future attempts to pinpoint possible alternative cells of origin that give rise to PF ependymoma.
The most highly differentially expressed genes in Groups A and B, in both the Toronto and Heidelberg datasets, revealed candidate marker genes for distinguishing the two groups, the most striking being upregulation of LAMA2 in Group A and NELL2 in Group B. Other markers of Group A included previously reported biomarkers of poor patient outcome including CHI3L1, TNC, VEGF, EGFR, ERRB4, BIRC5, and S100A6 (Figure S5A) (Rand et al., 2008; Korshunov et al., 2002; Mendrzyk et al., 2006; Gilbertson et al., 2002; Preusser et al., 2005). This evidence, in addition to the lack of prognostic significance for chromosome 1q gain in Group A patients, suggests that some previously reported markers of poor outcome may have been surrogate markers for Group A.
Because Group B ependymomas are much less likely to recur, metastasize, or result in the death of the patient, validation of our results in additional cohorts of patients would suggest that Group B patients could be treated less aggressively than Group A patients. Conversely, the poor outcome for Group A patients underlines the need for rapid development of adjuvant therapies for these patients.
We anticipate that analysis of additional cohorts of posterior fossa ependymoma will further support the existence of at least two divergent molecular variants that are demographically, genetically, transcriptionally, and clinically distinct. The antibodies described for LAMA2 and NELL2 are both commercially available and therefore should be widely available across the globe for validation of our results and eventually for use in prognostication and stratification of PF ependymoma patients. We would also suggest that future clinical trials should prospectively validate IHC staining for LAMA2 and NELL2 on formalin-fixed, paraffin-embedded tumor material. Importantly, to further improve our understanding of the molecular biology of these posterior fossa subgroups, prospective investigations into the cell-of-origin and genetic driver mutations are desperately needed, including modeling of PF ependymoma in the mouse. Finally, the distinct molecular characteristics of these two groups of PF ependymoma suggest that subgroup-specific targeted therapies against subgroup-specific deregulated pathways are needed in future treatments of these tumors.
Experimental Procedures
Patients and Tumor Samples
Clinical samples and data were used in accordance with research ethics board approval from both The Hospital of Sick Children (Toronto, Ontario) and DKFZ (Heidelberg, Germany). Informed consent was obtained from all patients in this study. Detailed patient and sample information for all three cohorts can be found in the supplemental experimental procedures, and also in Table S1 and Table S3.
Gene Expression Array Processing
One-hundred-two Toronto ependymoma samples were analyzed on the Affymetrix Human Exon 1.0 ST Gene Chip at the London Regional Genomics Centre (London, Ontario). Sample library preparation, hybridization, and quality control were performed according to Affymetrix recommended protocols. CEL files were imported into Affymetrix Expression Console (Version 1.1) and gene level analysis (CORE content) was performed. Arrays were quantile normalized (sketch) and summarized using PLIER with PM-GCBG background correction. Probesets were annotated according to the human genome build HG19 (GRCh37).
RNA isolated from 75 ependymomas of the Heidelberg cohort was processed and hybridized to the 4x44K feature Agilent Whole Human Genome Oligo Microarray according to the manufacturer's instructions. All hybridization experiments were investigated by labeling tumor sample against reference probes normal brain pool, and scanned in a two-color Agilent Scanner G25505B according to the manufacturer's specification. Array raw data were generated from scanned images using Feature Extraction 9.1 Software (Agilent). Pre-processing of the data and quality control were conducted with our in-house developed ChipYard framework for microarray data analysis (http://www.dkfz.de/genetics/ChipYard/) using R statistical software and Bioconductor (Gentleman et al., 2004) packages. Normalization of raw signals was performed using vsn (Huber et al., 2002).
Array-Comparative Genomic Hybridization
Array-CGH (Solinas-Toldo et al., 1997) at an average probe spacing of 0.4 Mb was carried out as previously described (Korshunov et al., 2010) for the Heidelberg and Toronto datasets. Microarray data analysis was performed as previously reported (Zielinski et al., 2005).
Statistical Analysis of Gene Expression–Based Subgroups
Missing values in the Agilent gene expression dataset were imputed using k-nearest neighbor algorithm (Reich et al., 2006). In both datasets, duplicate pro-besets were filtered to the highest variant probesets across all samples. ForHCL consensus clustering, datasets were reduced to 1000 probesets exhibiting the largest median absolute deviation (MAD). For NMF consensus clustering, data-sets were reduced to 5000 probesets exhibiting the largest MAD scores.
Identification of Gene Expression–Derived Subgroups
To detect robust sample clusters, we used hierarchical clustering with agglomerative average linkage as our method for consensus clustering (R package: ConsensusClusterPlus; Wilkerson and Hayes, 2010). Datasets were median-centered and the distance measure was computed as 1 minus the Pearson's correlation coefficient. Clustering was performed over 1000 iterations at a sub-sampling ratio of 0.8. SigClust was used to compute significance tests on the identified clusters in a pairwise fashion (R package: sigclust; Liu et al., 2008). Silhouette analysis was performed to identify “core” samples (R package: cluster; Rousseeuw, 1987). Only members with a positive silhouette value were retained for further analysis as highly representative samples of their subgroup assignment. Subclass mapping using the SubMap module (version 3), within GenePattern software, was performed to determine the commonality of the subtypes identified in the two datasets (Hoshida et al., 2007; Reich et al., 2006). Consensus NMF was used to assess the sample memberships at a 3-subgroup classification. NMF (R package: NMF version 0.5.02) was performed on each dataset for 1000 resampling iterations using the parameters described previously (Brunet et al., 2004). Sample memberships were then compared against the HCL analysis using a Rand index. The significance of the Rand index was assessed by permutation of the Toronto sample labels and computing the Rand index over 10,000 iterations to generate a null distribution of Rand index values.
Principal component analysis was performed within Partek Genomics Suite (Partek Inc., St. Louis, MO) to compare Group A and Group B posterior fossa subtypes with the same 1000 genes used for consensus HCL. Both groups were highlighted by their HCL cluster membership and encircled by ellipsoids measuring two standard deviations around the center of each subgroup.
Identification of Biological Pathways Distinguishing Group A from Group B Posterior Fossa Ependymomas
Gene Set Enrichment Analysis (Subramanian et al., 2005), as visualized in Cytoscape (version 2.7.0), and the Enrichment Map software (Merico et al., 2010), were used to identify the biological processes discriminating Group A from Group B ependymomas. Gene sets were compiled from NCI, KEGG, PFAM, Biocarta, and GO databases. Using the Toronto dataset, GSEA analysis was performed using gene-set permutations with a FDR cutoff of 3.5% and p-value cutoff of 0.01. The network map was manually curated removing general and uninformative sub-networks and nodes, resulting in a simplified network map shown in Figure 4. The complete network map for the Toronto dataset can be found in Figure S4A. Because of differences in microarray platforms, different GSEA parameters were needed to generate the network map comparing Group A and Group B in the dataset from Heidelberg (Figure S4B; FDR < 0.10, p < 0.01). GSEA results for both Toronto and Heidelberg datasets can be found in Table S2.
Selection of Candidate Genes and Gene Signatures
We computed the test statistic of Goeman's global test for logistic regression to derive the contributions made by each of the genes on discriminating between the two groups (Goeman et al., 2004). Individual transcripts were then ranked by their influence. Finally, we selected 100 candidate genes with highest ranks in both datasets as representative subgroup markers for Group A and Group B.
Statistical Analysis of Clinical Parameters
Estimation of survival time distribution was performed by the method of Kaplan and Meier. For comparisons of two or more survival curves, the log-rank test was used. Comparisons of binary and categorical patient characteristics between age groups were performed by use of a two-sided Fisher's exact test. Tumor removal was evaluated on the post-operative MRI as either gross total resection (no visible tumor) or subtotal resection (visible tumor remaining). To evaluate the status of recurrence, metastasis at recurrence, and mortality 5 years after diagnosis, we selected patients with a 5-year follow-up in the expression cohort. Wilcoxon rank-sum test was used to perform two-sample location tests for at least ordinal covariates. Multivariate Cox regression analysis was used to evaluate the impact of subgroup markers together with prognostically relevant clinical and histopathological factors. The result of a test was always judged as statistically significant when the corresponding two-sided p-value was less than 0.05. The prognostic value of clinical and molecular factors was assessed by their estimated hazard ratios including 95% confidence intervals. Box-and-whisker plots illustrate numerical data represented in numbers for five variables: minimum value, lower quartile, median, upper quartile, and maximum value.
Supplementary Material
Significance.
Despite current therapy for ependymoma, consisting of maximal safe resection and radiotherapy, mortality rates remain as high as 45%. Chemotherapeutic regimens have been proven largely ineffective in clinical trials. Development of targeted therapy requires an in-depth understanding of the pathogenesis of the disease, including the heterogeneity between tumors. We identify two molecularly and clinically distinct sets of PF ependymomas, and markers to differentiate them. Subgroup identification should influence the aggressiveness of current treatments for PF ependymoma patients and allow for the appropriate stratification of future clinical trials of PF ependymoma. A single targeted therapy is unlikely to be effective in the two highly disparate subgroups of PF ependymoma, and future investigations should not consider them as a single disease.
Acknowledgments
We thank Stephanie Riester, Stephanie Willrett and Anna Schöttler for their excellent technical assistance. We also thank Dr. Jill Mesirov and Dr. Pablo Tamayo for their bioinformatics assistance. Research in the Pfister laboratory is funded by the Sander-Stiftung, “Tour der Hoffnung,” and the Fritz-Lambert Preis to S.P. and A.K. M.D.T. is supported by a Clinician Scientist Phase II award from the Canadian Institutes of Health Research (CIHR). S.M. is supported by the CIHR Vanier Scholarship. Research in the Taylor laboratory is supported by the Pediatric Brain Tumor Foundation, the Canadian Institutes of Health Research, and the C.R. Younger Foundation. We thank Susan Archer for assistance with technical writing.
Footnotes
Accession Numbers: Gene expression and aCGH data for both Toronto (GSE27279) and Heidelberg (GSE27287) datasets can be found at the NCBI Gene Expression Omnibus repository.
Supplemental Information: Supplemental Information includes six figures, five tables, and Supplemental Experimental Procedures and can be found with this article online at doi:10.1016/j.ccr.2011.07.007.
Contributor Information
Michael D. Taylor, Email: mdtaylor@sickkids.ca.
Stefan M. Pfister, Email: s.pfister@dkfz.de.
References
- Birkbak NJ, Eklund AC, Li Q, McClelland SE, Endesfelder D, Tan P, Tan IB, Richardson AL, Szallasi Z, Swanton C. Paradoxical relationship between chromosomal instability and survival outcome in cancer. Cancer Res. 2011;71:3447–3452. doi: 10.1158/0008-5472.CAN-10-3667. [DOI] [PMC free article] [PubMed] [Google Scholar]
- Bouffet E, Perilongo G, Canete A, Massimino M. Intracranial ependymomas in children: a critical review of prognostic factors and a plea for cooperation. Med Pediatr Oncol. 1998;30:319–329. doi: 10.1002/(sici)1096-911x(199806)30:6<319::aid-mpo1>3.0.co;2-h. discussion 329–331. [DOI] [PubMed] [Google Scholar]
- Brunet JP, Tamayo P, Golub TR, Mesirov JP. Metagenes and molecular pattern discovery using matrix factorization. Proc Natl Acad Sci USA. 2004;101:4164–4169. doi: 10.1073/pnas.0308531101. [DOI] [PMC free article] [PubMed] [Google Scholar]
- Carter M, Nicholson J, Ross F, Crolla J, Allibone R, Balaji V, Perry R, Walker D, Gilbertson R, Ellison DW. Genetic abnormalities detected in ependymomas by comparative genomic hybridisation. Br J Cancer. 2002;86:929–939. doi: 10.1038/sj.bjc.6600180. [DOI] [PMC free article] [PubMed] [Google Scholar]
- Dyer S, Prebble E, Davison V, Davies P, Ramani P, Ellison D, Grundy R. Genomic imbalances in pediatric intracranial ependymomas define clinically relevant groups. Am J Pathol. 2002;161:2133–2141. doi: 10.1016/S0002-9440(10)64491-4. [DOI] [PMC free article] [PubMed] [Google Scholar]
- Ebert C, von Haken M, Meyer-Puttlitz B, Wiestler OD, Reifenberger G, Pietsch T, von Deimling A. Molecular genetic analysis of ependymal tumors NF2 mutations and chromosome 22q loss occur preferentially in intramedullary spinal ependymomas. Am J Pathol. 1999;155:627–632. doi: 10.1016/S0002-9440(10)65158-9. [DOI] [PMC free article] [PubMed] [Google Scholar]
- Gentleman RC, Carey VJ, Bates DM, Bolstad B, Dettling M, Dudoit S, Ellis B, Gautier L, Ge Y, Gentry J, et al. Bioconductor: open software development for computational biology and bioinformatics. Genome Biol. 2004;5:R80. doi: 10.1186/gb-2004-5-10-r80. [DOI] [PMC free article] [PubMed] [Google Scholar]
- Gibson P, Tong Y, Robinson G, Thompson MC, Currle DS, Eden C, Kranenburg TA, Hogg T, Poppleton H, Martin J, et al. Subtypes of medulloblastoma have distinct developmental origins. Nature. 2010;468:1095–1099. doi: 10.1038/nature09587. [DOI] [PMC free article] [PubMed] [Google Scholar]
- Gilbertson RJ, Bentley L, Hernan R, Junttila TT, Frank AJ, Haapasalo H, Connelly M, Wetmore C, Curran T, Elenius K, Ellison DW. ERBB receptor signaling promotes ependymoma cell proliferation and represents a potential novel therapeutic target for this disease. 2002 [PubMed] [Google Scholar]
- Goeman JJ, van de Geer SA, de Kort F, van Houwelingen HC. A global test for groups of genes: testing association with a clinical outcome. Bioinformatics. 2004;20:93–99. doi: 10.1093/bioinformatics/btg382. [DOI] [PubMed] [Google Scholar]
- Grill J, Le Deley MC, Gambarelli D, Raquin MA, Couanet D, Pierre-Kahn A, Habrand JL, Doz F, Frappaz D, Gentet JC, et al. French Society of Pediatric Oncology. Postoperative chemotherapy without irradiation for ependymoma in children under 5 years of age: a multicenter trial of the French Society of Pediatric Oncology. J Clin Oncol. 2001;19:1288–1296. doi: 10.1200/JCO.2001.19.5.1288. [DOI] [PubMed] [Google Scholar]
- Hoshida Y, Brunet JP, Tamayo P, Golub TR, Mesirov JP. Subclass mapping: identifying common subtypes in independent disease data sets. PLoS ONE. 2007;2:e1195. doi: 10.1371/journal.pone.0001195. [DOI] [PMC free article] [PubMed] [Google Scholar]
- Huber W, von Heydebreck A, Sültmann H, Poustka A, Vingron M. Variance stabilization applied to microarray data calibration and to the quantification of differential expression. Bioinformatics. 2002;18(Suppl 1):S96–S104. doi: 10.1093/bioinformatics/18.suppl_1.s96. [DOI] [PubMed] [Google Scholar]
- Johnson RA, Wright KD, Poppleton H, Mohankumar KM, Finkelstein D, Pounds SB, Rand V, Leary SE, White E, Eden C, et al. Cross-species genomics matches driver mutations and cell compartments to model ependymoma. Nature. 2010;466:632–636. doi: 10.1038/nature09173. [DOI] [PMC free article] [PubMed] [Google Scholar]
- Kilday JP, Rahman R, Dyer S, Ridley L, Lowe J, Coyle B, Grundy R. Pediatric ependymoma: biological perspectives. Mol Cancer Res. 2009;7:765–786. doi: 10.1158/1541-7786.MCR-08-0584. [DOI] [PubMed] [Google Scholar]
- Korshunov A, Golanov A, Timirgaz V. Immunohistochemical markers for prognosis of ependymal neoplasms. J Neurooncol. 2002;58:255–270. doi: 10.1023/a:1016222202230. [DOI] [PubMed] [Google Scholar]
- Korshunov A, Witt H, Hielscher T, Benner A, Remke M, Ryzhova M, Milde T, Bender S, Wittmann A, Schöttler A, et al. Molecular staging of intracranial ependymoma in children and adults. J Clin Oncol. 2010;28:3182–3190. doi: 10.1200/JCO.2009.27.3359. [DOI] [PubMed] [Google Scholar]
- Liu Y, Hayes DN, Nobel A, Marron J. Statistical significance of clustering for high-dimension low sample size data. J Am Stat Assoc. 2008;103:1281–1293. [Google Scholar]
- Louis DN, Ohgaki H, Wiestler OD, Cavenee WK, Burger PC, Jouvet A, Scheithauer BW, Kleihues P. The 2007 WHO classification of tumours of the central nervous system. Acta Neuropathol. 2007;114:97–109. doi: 10.1007/s00401-007-0243-4. [DOI] [PMC free article] [PubMed] [Google Scholar]
- Mendrzyk F, Korshunov A, Benner A, Toedt G, Pfister S, Radlwimmer B, Lichter P. Identification of gains on 1q and epidermal growth factor receptor overexpression as independent prognostic markers in intracranial ependymoma. Clin Cancer Res. 2006;12:2070–2079. doi: 10.1158/1078-0432.CCR-05-2363. [DOI] [PubMed] [Google Scholar]
- Merchant TE, Mulhern RK, Krasin MJ, Kun LE, Williams T, Li C, Xiong X, Khan RB, Lustig RH, Boop FA, Sanford RA. Preliminary results from a phase II trial of conformal radiation therapy and evaluation of radiation-related CNS effects for pediatric patients with localized ependymoma. J Clin Oncol. 2004;22:3156–3162. doi: 10.1200/JCO.2004.11.142. [DOI] [PubMed] [Google Scholar]
- Merchant TE, Li C, Xiong X, Kun LE, Boop FA, Sanford RA. Conformal radiotherapy after surgery for paediatric ependymoma: a prospective study. Lancet Oncol. 2009;10:258–266. doi: 10.1016/S1470-2045(08)70342-5. [DOI] [PMC free article] [PubMed] [Google Scholar]
- Merico D, Isserlin R, Stueker O, Emili A, Bader GD. Enrichment map: a network-based method for gene-set enrichment visualization and interpretation. PLoS ONE. 2010;5:e13984. doi: 10.1371/journal.pone.0013984. [DOI] [PMC free article] [PubMed] [Google Scholar]
- Monti S, Tamayo P, Mesirov J, Golub TR. Consensus Clustering: a resampling-based method for class discovery and visualization of gene expression microarray data. Mach Learn. 2003;52:91–118. [Google Scholar]
- Preusser M, Wolfsberger S, Haberler C, Breitschopf H, Czech T, Slavc I, Harris AL, Acker T, Budka H, Hainfellner JA. Vascularization and expression of hypoxia-related tissue factors in intracranial ependymoma and their impact on patient survival. Acta Neuropathol. 2005;109:211–216. doi: 10.1007/s00401-004-0938-8. [DOI] [PubMed] [Google Scholar]
- Puget S, Grill J, Valent A, Bieche I, Dantas-Barbosa C, Kauffmann A, Dessen P, Lacroix L, Geoerger B, Job B, et al. Candidate genes on chromosome 9q33-34 involved in the progression of childhood ependymomas. J Clin Oncol. 2009;27:1884–1892. doi: 10.1200/JCO.2007.15.4195. [DOI] [PubMed] [Google Scholar]
- Rand V, Prebble E, Ridley L, Howard M, Wei W, Brundler MA, Fee BE, Riggins GJ, Coyle B, Grundy RG Children's Cancer and Leukaemia Group Biological Studies Committee. Investigation of chromosome 1q reveals differential expression of members of the S100 family in clinical subgroups of intracranial paediatric ependymoma. Br J Cancer. 2008;99:1136–1143. doi: 10.1038/sj.bjc.6604651. [DOI] [PMC free article] [PubMed] [Google Scholar]
- Reich M, Liefeld T, Gould J, Lerner J, Tamayo P, Mesirov JP. GenePattern 2.0. Nat Genet. 2006;38:500–501. doi: 10.1038/ng0506-500. [DOI] [PubMed] [Google Scholar]
- Rink JC, Gurley KA, Elliott SA, Sánchez Alvarado A. Planarian Hh signaling regulates regeneration polarity and links Hh pathway evolution to cilia. Science. 2009;326:1406–1410. doi: 10.1126/science.1178712. [DOI] [PMC free article] [PubMed] [Google Scholar]
- Rousseeuw PJ. Silhouettes: A graphical aid to the interpretation and validation of cluster analysis. J Comput Appl Math. 1987;20:53–65. [Google Scholar]
- Solinas-Toldo S, Lampel S, Stilgenbauer S, Nickolenko J, Benner A, Döhner H, Cremer T, Lichter P. Matrix-based comparative genomic hybridization: biochips to screen for genomic imbalances. Genes Chromosomes Cancer. 1997;20:399–407. [PubMed] [Google Scholar]
- Subramanian A, Tamayo P, Mootha VK, Mukherjee S, Ebert BL, Gillette MA, Paulovich A, Pomeroy SL, Golub TR, Lander ES, Mesirov JP. Gene set enrichment analysis: a knowledge-based approach for interpreting genome-wide expression profiles. Proc Natl Acad Sci USA. 2005;102:15545–15550. doi: 10.1073/pnas.0506580102. [DOI] [PMC free article] [PubMed] [Google Scholar]
- Taylor MD, Poppleton H, Fuller C, Su X, Liu Y, Jensen P, Magdaleno S, Dalton J, Calabrese C, Board J, et al. Radial glia cells are candidate stem cells of ependymoma. Cancer Cell. 2005;8:323–335. doi: 10.1016/j.ccr.2005.09.001. [DOI] [PubMed] [Google Scholar]
- Verhaak RG, Hoadley KA, Purdom E, Wang V, Qi Y, Wilkerson MD, Miller CR, Ding L, Golub T, Mesirov JP, et al. Cancer Genome Atlas Research Network. Integrated genomic analysis identifies clinically relevant subtypes of glioblastoma characterized by abnormalities in PDGFRA, IDH1, EGFR, and NF1. Cancer Cell. 2010;17:98–110. doi: 10.1016/j.ccr.2009.12.020. [DOI] [PMC free article] [PubMed] [Google Scholar]
- Wilkerson MD, Hayes DN. ConsensusClusterPlus: a class discovery tool with confidence assessments and item tracking. Bioinformatics. 2010;26:1572–1573. doi: 10.1093/bioinformatics/btq170. [DOI] [PMC free article] [PubMed] [Google Scholar]
- Wilson CW, Nguyen CT, Chen MH, Yang JH, Gacayan R, Huang J, Chen JN, Chuang PT. Fused has evolved divergent roles in vertebrate Hedgehog signalling and motile ciliogenesis. Nature. 2009;459:98–102. doi: 10.1038/nature07883. [DOI] [PMC free article] [PubMed] [Google Scholar]
- Zacharoulis S, Levy A, Chi SN, Gardner S, Rosenblum M, Miller DC, Dunkel I, Diez B, Sposto R, Ji L, et al. Outcome for young children newly diagnosed with ependymoma, treated with intensive induction chemotherapy followed by myeloablative chemotherapy and autologous stem cell rescue. Pediatr Blood Cancer. 2007;49:34–40. doi: 10.1002/pbc.20935. [DOI] [PubMed] [Google Scholar]
- Zielinski B, Gratias S, Toedt G, Mendrzyk F, Stange DE, Radlwimmer B, Lohmann DR, Lichter P. Detection of chromosomal imbalances in retinoblastoma by matrix-based comparative genomic hybridization. Genes Chromosomes Cancer. 2005;43:294–301. doi: 10.1002/gcc.20186. [DOI] [PubMed] [Google Scholar]
Associated Data
This section collects any data citations, data availability statements, or supplementary materials included in this article.