

Abstract
The MitoPark mouse, in which the mitochondrial transcription factor Tfam is selectively removed in midbrain dopamine (DA) neurons, is a genetic model for Parkinson’s disease (PD) that replicates the slow and progressive development of key symptoms. To further validate this model, we have extended both behavioral and biochemical analyses in these animals. We found that vertical movements decline earlier and faster than horizontal movements, possibly modeling the early occurrence of axial, postural instability in PD. L-DOPA induces different locomotor responses depending on the age: in young MitoPark mice the L-DOPA-induced motor activation is small; middle-aged MitoPark mice respond in a dose-dependent manner to L-DOPA, whereas aged MitoPark mice display a double-peaked locomotor response to a high dose of L-DOPA that includes an intermittent period of very low motor activity, similar to the ‘on–off’ phenomenon in PD. To correlate behavior with biochemical data, we analyzed monoamine levels in three different brain areas that are highly innervated by the DA system: striatum, anterior cortex and olfactory bulb. DA levels declined earlier and faster in striatum than in cortex; only at the latest time-point analyzed, DA levels were found to be significantly lower than control levels in the olfactory bulb. Interestingly, the ratio between homovanillic acid (HVA) and DA differed between regions over time. In striatum and olfactory bulb, the ratio increased steeply indicating increased DA turnover. In contrast, the ratio decreased over time in cortex, revealing important differences between DA cells in substantia nigra and the ventral tegmental area.
Keywords: Cre-loxP system, HPLC, mitochondria, striatum, substantia nigra, tissue-specific knock-out mice
Evidences from different research fields point to the involvement of mitochondrial dysfunction in Parkinson’s disease (PD) (Bogaerts et al. 2008; Schapira 2008). To model severe mitochondrial dysfunction specifically in dopamine (DA) neurons, a mouse has been developed in which the mitochondrial transcription factor Tfam is selectively removed in DA neurons using the Cre-loxP system (Ekstrand et al. 2007).
Tfam is necessary for mitochondrial transcription and is also required for mtDNA maintenance in mammals; it stabilizes mitochondrial DNA, regulates mtDNA copy number in vivo and is essential for mitochondrial biogenesis (Larsson et al. 1998). Neurons devoid of Tfam develop progressive respiratory chain deficiency followed by cell death (Sorensen et al. 2001). To generate the animals termed MitoPark, knock-in mice expressing Cre recombinase, driven by the DA transporter (DAT) promoter, were crossed with mice in which the Tfam gene is flanked by loxP recombination sites. Tfam is thereby specifically deleted only in cells that express DAT, i.e. DA neurons in the midbrain. Although DAT expression is already initiated during embryonic development and induces Cre expression around embryonic day E16 (Coyle 1973; Fujita et al. 1993), the mitochondrial deficiency and cell loss does not become apparent until several months later. MitoPark mice appear normal until adolescence, at which time they begin to develop PD-like motor disabilities that slowly progress until 40–44 weeks of age when they are severely debilitated. To facilitate the use of this mouse model in PD research, we have finely mapped the progression of motor disabilities at five different ages, reflecting different stages of PD development and have correlated these to the progressive changes of monoamine and metabolite levels in the brain. We have also analyzed the locomotor responses to different doses of L-DOPA at four different ages, modeling increasing severity of disease. We found that this genetic PD model reflects cardinal symptoms of PD that include both behavioral and biochemical features that develop slowly with age. Moreover, the projection targets of the different areas of midbrain DA neurons manifest heterogeneous biochemical properties. This heterogeneity may reflect differences in midbrain DA neuron phenotype and parallels changes seen in human PD. In this way, the genetic model of PD provides a wide therapeutic window during which novel PD treatments can be tested.
Material and methods
Animals
Healthy littermates in which one or both Tfam genes were loxP-flanked (TfamloxP/loxP or Tfam−/loxP) served as controls and were compared to MitoPark (Dat-Cre +/- TfamloxP/loxP) mice of both sexes (n = 82 pairs of MitoPark and littermate controls) ranging in age from 6 to 41 weeks. The generation of MitoPark animals has been described in detail (Ekstrand et al. 2007). DNA for genotyping was prepared from ear punches according to the manufacturer’s instructions (QIAamp® DNA Mini Kit, QIAGEN, Hilden, Germany). For the Dat-cre genotype we used a multiplex polymerase chain reaction (PCR) setting with two pairs of primers: one forward (F-CCTTGTTTAGCAGGCCTTTATGC) and two reverse primers (R1-CATGAGGGTGGAGTTGGTCAG and R2-CGCGAACATCTTCAGGTTCT) to separate heterozygous Dat-cre mice, which have two bands at 474 and 311 base pairs, respectively, from wild-type mice showing only the lower band. Thirty-eight cycles were run at 95°C for 30 seconds, 58°C for 30 seconds and 72°C for 45 seconds. The PCR products were separated using electrophoresis on 1% agarose gels and were visualized with UV after ethidium bromide staining. Genotyping for TfamloxP/loxP was carried out as previously described (Ekstrand & Larsson 2002). The two mouse strains (Dat-cre and TfamloxP/loxP mice) are backcrossed to the Bl/6 background for at least 13 and 8 generations, respectively. In addition, to avoid genetic drift both strains were backcrossed to Bl/6 at least once in 10 generations.
Mice were housed up to eight per cage in a light-controlled room (12 h light/dark cycle, lights on at 6:00 am) at 21°C and 60% humidity with food and water ad lib. Experiments were approved by the local Animal Ethics Board of Stockholm (Sweden).
Behavioral studies
Horizontal and vertical locomotor activities were recorded with the VersaMax animal activity monitoring system (AccuScan Instruments, Columbus, OH, USA). Activity cages (40 × 40 cm and 30 cm high) with 80 ml of wooden shavings on the floor were placed into the analyzers, where horizontal movements are monitored via a grid of infrared light beams equally spaced at 2.5 cm. Sensors 7.5 cm above the floor monitor vertical activity. Data from each beam are collected 50 times per second and integrated over time. For each age (6, 12, 24, 32 and 40 weeks), seven to eight littermate pairs consisting of one MitoPark and one wild-type mouse were analyzed. In each group at least three pairs were males to obtain a balanced sex distribution.
Mice were habituated to the dimly lit, low-noise, and ventilated experimental room for approximately 50 min before initiating experiments during the light phase of the light/dark cycle, between 9 am and 2 pm. Animals were placed randomly in one of eight experimental cages and their spontaneous locomotor activities were recorded for 60 min. To analyze L-DOPA-induced activity we used a commonly used PD medication (Madopark quick, Roche AB, Sweden), a combination of 100 mg L-DOPA and 25 mg benserazide per 0.5 g tablet, which was grinded to a powder and dissolved in saline for parental use (B. Braun, Apoteksbolaget, Sweden). Following homogenization, pH was adjusted to 7.2 and aliquots were frozen at −20°C until use. After 60 min of habituation, mice were injected i.p. with saline, 4 or 20 mg/kg L-DOPA + benserazide in a volume of 10 ml/kg and drug-induced locomotor behavior was recorded for 180 min. Data from the three parameters measured in the locomotor activity chambers (horizontal activity, vertical activity and total distance traveled) and weight differences were analyzed using two-way analysis of variance (ANOVA) with a significance level set at P < 0.05 (GraphPad Prism 4), followed by Bonferroni post tests.
In control experiments we have treated mice with pure L-DOPA/benserazide (20/4 mg/kg, Sigma-Aldrich, Sweden) injected i.p. in a volume of 10 ml/kg to verify that the behavioral changes described are not related to other components of the Madopark formulation, which is optimized for oral uptake. Eight pairs of 30-week-old MitoPark and control mice have been used for these experiments.
Biochemical measurements
Monoamines and their major metabolites in brain tissue were determined by high-performance liquid chromatography with electrochemical detection as described elsewhere (Yoshitake et al. 2004). For each age group analyzed, six to nine pairs of MitoPark mice and littermate controls (at least three pairs per group were males) were sacrificed by decapitation and brains were rapidly removed and chilled in 4°C saline. Olfactory bulbs, striatum and frontal cortex were dissected and frozen on dry ice. Until analysis, brain samples were stored at −70°C when they were weighed and homogenized in 100 μl of 0.1 M perchloric acid followed by centrifugation and filtering through a 0.2 × 10⁻¹ m filter (Super Acrodisc 13, Gelman Sciences, MI, USA).
Typically, 10 μl samples were injected onto the chromatographic column. The liquid chromatograph consisted of an on-line degasser LC-27A, a LC-10AD pump (Shimadzu, Tokyo, Japan), a refrigerated microsampler, and an electrochemical detector (ECD-300, Eicom, Kyoto, Japan). The mobile phase was a mixture of methanol and 0.1 M citric acid buffer (pH 3.5) (16:84, v/v) containing 200 mg/l octanesulfonic acid sodium salt and 5 mg/l EDTA-2Na pumped at a flow rate of 0.45 ml/min. The chromatograms were integrated using a computerized data acquisition system (CSW 32, DataApex, Prague, Czech Republic). Levels of DA, dihydroxyphenylacetic acid (DOPAC), HVA, serotonin (5-HT), 5-hydroxyindole acetic acid (5-HIAA), and norepinephrine and its major metabolite, 3-methoxy-4-hydroxyphenylglycol (MHPG), were measured. Data from all HPLC measurements were analyzed with two-way ANOVA (genotype × age) with a significance level set at P < 0.05 (GraphPad Prism 4) followed by Bonferroni post tests.
Results
The weight of both male and female MitoPark mice remained similar to that of their control littermates until around 20 weeks of age, when MitoPark mice began to lose weight, despite being provided with moistened food pellets on the floor of the cage (Fig. 1). At 24 weeks of age, the weight difference between MitoPark mice and their littermate controls reached significance and MitoPark mice continued to lose weight, until they weigh only 50% of control littermates at 40 weeks of age. There was a significant age × genotype interaction for weight in male (F4,48 = 20.51, P < 0.001) and female (F4,54 = 31.41, P < 0.001) mice.
Figure 1. Changes in weight, spontaneous vertical activity, horizontal activity and total distance traveled of MitoPark mice as a percentage of control littermates at five different ages.

Bars represent mean beam breaks from six to eight animals per group and error bars indicate SEM. Data were analyzed with two-way ANOVA followed by Bonferroni post test and statistically significant differences to aged matched controls are indicated as follows: *, P < 0.05; **, P < 0.01; ***, P < 0.001.
Behavior analyzes
Spontaneous locomotor activity
The spontaneous horizontal and vertical movements of MitoPark were recorded at different ages and compared with control littermates (Fig. 1). Horizontal activity was quantified in two different manners, as numbers of beam breaks and as total distance traveled by an animal during the 60-minute recording. At 6 weeks, MitoPark mice displayed higher activity scores at both horizontal and vertical movements and they traveled longer distances than control mice. This modest, but consistent hyperactivity of MitoPark mice was reversed to bradykinesia as early as 6 weeks later (12-week-old animals), at which time MitoPark mice displayed roughly half the vertical activity and 75% the horizontal activity of littermate control mice. The rate of decline in their activity slowed down and at 24 weeks of age the spontaneous locomotor activity of MitoPark mice had dropped to around 25% of vertical movements and 50% of horizontal movements compared to control mice. At the two last time-points tested, 32 and 40 weeks, the spontaneous activity of MitoPark mice further declined reaching as low as 25% of the horizontal activity of control mice and 10% of the vertical activity. There was a highly significant age × genotype interaction for spontaneous horizontal activity (F4,65 = 8.85, P < 0.0001), spontaneous total distance traveled (F4,65 = 10.16, P < 0.0001) and spontaneous vertical activity (F4,65 = 7.41, P < 0.0001).
L-DOPA-induced locomotor activity
L-DOPA-induced locomotor activities in MitoPark and control mice at different ages were evaluated. The widely prescribed PD treatment, Madopark Quick, a tablet that contains both L-DOPA and benserazide, an inhibitor of the peripheral DA decarboxylase in a proportion of four parts to one was chosen to more closely parallel L-DOPA treatment in PD. To characterize the temporal pattern of drug-induced locomotor activity, we first monitored locomotor behavior for up to 8 h after injection (data not shown). We determined that between 3 and 4 h after treatment with L-DOPA, its effects on locomotor activity could no longer be detected, a finding that is in line with the reported half-life of L-DOPA in serum (Huebert et al. 1983). Therefore, all further experiments were limited to an observation/recording time of 300 min, or 4 h after injection. Figure 2 shows representative patterns of L-DOPA-induced horizontal activity displayed by individual MitoPark mice and the apparent lack of response in control mice at four different ages. Eight-week-old MitoPark mice responded with a very moderate increase in locomotion to both 4 and 20 mg L-DOPA/kg (Fig. 2). At 16 weeks of age, MitoPark mice displayed a larger response to 20 mg/kg L-DOPA and at 24 weeks of age, both 4 and 20 mg/kg of L-DOPA induced rapid increases in horizontal activity in MitoPark mice, an effect that lasted longer using the higher dose tested (Fig. 2). In 32-week-old MitoPark mice, the low dose (4 mg/kg L-DOPA) induced an even longer and more elevated locomotor response than in younger animals (Fig. 2). The high L-DOPA dose induced a two-peaked activity pattern; the first peak, occurring only a few minutes after injection, declined rapidly by 10–15 min and was followed by a second, even higher and wider, peak around 90 min after injection that lasted about 45 min.
Figure 2. Representative locomotor responses to two different L-DOPA doses in MitoPark and control mice at four different ages: 8 weeks, 16 weeks, 24 weeks and 32 weeks.
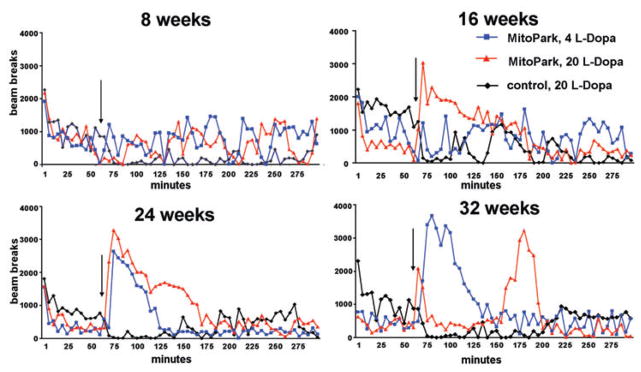
L-DOPA was injected after 60 min (arrow) of habituation to the activity cages and horizontal activity was monitored for another 4 h.
In control experiments we show that pure L-DOPA/benserazide induces very similar locomotor patterns in 30-week-old MitoPark mice (Fig. S1A).
At all four ages, control mice reacted paradoxically with reduced movements following treatment with L-DOPA (only treatment with 20 mg/kg shown in Fig. 2). The reduced horizontal and vertical activities lasted for around 60 min and were more prominent in older animals of both sexes. This hypo-locomotion of control mice was reproduced with pure L-DOPA/benserazide, indicating that the behavior change is not induced by the other components of Madopark, which are added to benefit the uptake from the gastrointestinal tract (Fig. S1B).
Figure 3 summarizes the group findings for both horizontal and vertical activities during the first 60 min after treatment with both doses of L-DOPA, representing six to eight MitoPark mice per age group. At 8 weeks of age, MitoPark mice were most active during the recording of their spontaneous activity and did react very modestly to L-DOPA. Older mice reacted to 4 mg/kg L-DOPA with increasingly more horizontal activity. Rearing (vertical activity) also increased in MitoPark mice of all tested ages, but was more pronounced in 24-week-old animals than in either younger or older MitoPark mice. Treated with a high dose of L-DOPA, 16- and 24-week-old MitoPark mice reacted with markedly increased horizontal and vertical activities with particularly high scores for vertical movements at 12 weeks of age. Aged (32 weeks old) MitoPark mice exhibited reduced horizontal locomotor activity during the first 60 min following treatment with the high L-DOPA dose compared with the younger mice of the same genotype because of the sharp decline of activity shortly after the injection (compare also with Fig. 2). There was a significant age × genotype interaction for drug-induced horizontal activity (F6,82 = 25.94, P < 0.0001) and for drug-induced vertical activity (F6,82 = 14.87, P < 0.0001).
Figure 3. Mean horizontal and, respective, vertical activities during 60 min following treatment with 4 or 20 mg/kg of L-DOPA of MitoPark mice at four different ages.
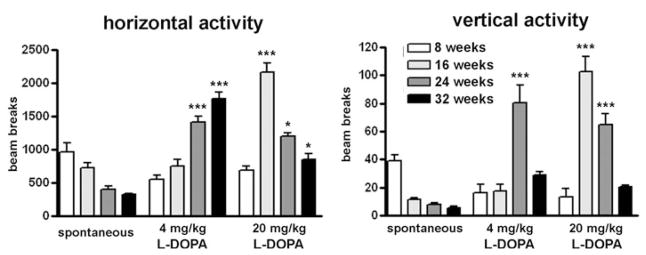
The drug-induced activity is compared with their spontaneous locomotor activity 60 min before the injection. Bars represent mean beam breaks from six to eight animals per group and error bars indicate SEM. Data were analyzed with two-way ANOVA followed by Bonferroni post test and statistically significant differences to the spontaneous activity are indicated as follows: *, P < 0.05; **, P < 0.01; ***, P < 0.001.
Biochemical measurements
Monoamine and monoamine metabolite levels were measured in three distinct brain regions. Differences between MitoPark mice and littermate controls were detected earliest in striatum (Fig. 4), where DA levels were significantly lower beginning at 12 weeks of age (age × genotype interaction: F4,59 = 6.98, P = 0.0001). In addition, DOPAC and HVA levels were significantly lower in striatum beginning at 24 weeks of age (age × genotype interactions F4,54 = 13.28, P < 0.0001; and F4,54 = 9.24, P < 0.0001respectively). The ratio between HVA and DA levels markedly increased with age starting at 12 weeks of age and reaching a fivefold increase in DA turnover in the oldest MitoPark mice (age × genotype interaction F4,55 = 5.7, P = 0.0006). Norepinephrine, its main metabolite MHPG (data not shown), serotonin and its metabolite 5HIAA (data not shown) did not significantly differ from control levels at any age, although norepinephrine levels slowly increased to 125% of control levels.
Figure 4. Monoamine levels in striatum of MitoPark mice compared with control littermates at five different ages.
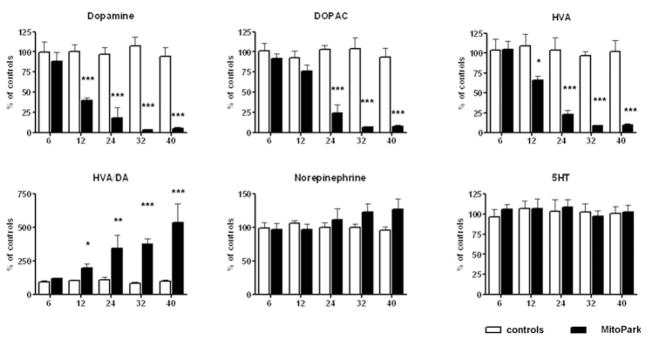
Bars represent mean monoamine levels from six to nine animals per group and error bars indicate SEM. Data were tested with two-way ANOVA followed by Bonferroni post test and statistically significant differences to aged matched controls are indicated as follows: *, P < 0.05; **, P < 0.01, ***, P < 0.001.
In frontal cortex (Fig. 5), DA levels decreased at a slower rate than in striatum, and did not reach a significant difference to control littermate levels until 24 weeks of age (age × genotype interaction F4,53 = 4.25, P = 0.0046). Interestingly, the levels of the metabolite, DOPAC and particularly HVA, decreased faster than DA starting at 12 weeks of age for HVA and 24 weeks for DOPAC (age × genotype interaction F4,58 = 3.6, P < 0.0116 and F4,58 = 6.9, P = 0.0001). This development led to significantly decreased HVA/DA ratio compared with control littermates starting at 12 weeks of age (age × genotype interaction F4,62 = 3.1, P < 0.013), thereby indicating a reduced turnover of DA in the frontal cortex. Both norepinephrine and serotonin levels slightly increased in aged MitoPark mice, but did not significantly differ from controls at any age.
Figure 5. Monoamine levels in anterior cortex cerebri of MitoPark mice at five different ages compared with their wild-type littermates.
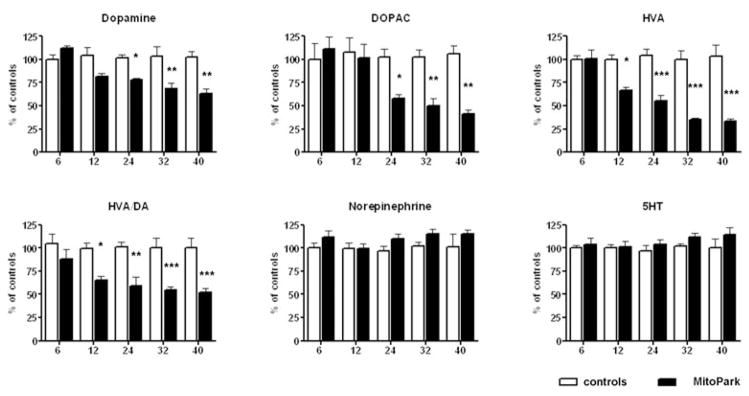
Bars represent mean monoamine levels from six to nine animals per group and error bars indicate SEM. Data were tested with two-way ANOVA followed by Bonferroni post test and statistically significant differences to aged matched controls are indicated as follows: *, P < 0.05; **, P < 0.01, ***, P < 0.001.
In the third brain region analyzed, the olfactory bulb (Fig. 6), only DA levels significantly decreased in 40-week-old MitoPark mice compared with control littermates (age × genotype interaction F4,48 = 2.78, P = 0.037). Similar to the striatum, the ratio between HVA and DA gradually increased with age, but this difference did not reach significance. The levels of DOPAC, norepinephrine and serotonin, as well as 5HIAA and MHPG, in MitoPark mice did not differ significantly from control animals (data not shown).
Figure 6. Monoamine levels in the olfactory bulb of MitoPark mice at five different ages compared with their wild-type littermates.

Bars represent mean monoamine levels from six to nine animals per group and error bars indicate SEM. Data were tested with two-way ANOVA followed by Bonferroni post test and statistically significant differences to aged matched controls are indicated as follows: *, P < 0.05.
We conclude that striatum, which receives DA input from the pars compacta of the substantia nigra, is the region, in which DA loss occurs first. In addition, the DA loss is most prominent in striatum and declines the fastest in MitoPark mice, a finding that correlates with what is observed in PD patients. The VTA projection areas show changes that are more modest and develop slower.
Discussion
We report here a detailed analysis of the progressive locomotor deficits and DA loss in the MitoPark mouse, a genetic model for PD, with the aim to evaluate the model’s usefulness in the search and assessment of new and better drugs with fewer side effects for the treatment of PD.
Young MitoPark mice, at six to eight weeks of age, show no or minor disturbances in their spontaneous behavior compared with control littermates; only a slight hyperactivity is apparent. At this young age MitoPark mice show a weak locomotor response to either low or high doses of L-DOPA. The monoamine levels are not significantly different between MitoPark and control mice at this early age in all three brain regions analyzed.
An interesting difference between MitoPark and control mice is that control mice are hypokinetic and apparently fall asleep in a dose-dependent manner following L-DOPA treatment in all ages tested, whereas MitoPark mice do not exhibit this drug-induced behavior. This hypokinesia is more pronounced in vertical activity (Fig. S1B) and during the active time of the mice, between 6 and 11 pm (data not shown). We speculate that in the absence of postsynaptic receptor super-sensitivity in control animals, L-DOPA stimulates presynaptic autoreceptors, resulting in reduced DA release and DA neuron discharge.
At 12 weeks of age, vertical movements are significantly reduced in MitoPark mice, together with significantly reduced DA levels in striatum, but not in cortex or olfactory bulb. Interestingly, the strong reduction of vertical activity (less than 50% of wild-type activity) corresponds well to the magnitude of the loss of striatal DA. The fact that horizontal activity is only reduced by 25% is in line with the observations in human PD patients, that a loss of function of axial balance is an early detectable sign, while the typical decrease in locomotion develops somewhat later. The differential effect on vertical vs. horizontal activity also correlates well with observations by Whishaw and colleagues in studies of rats after 6OHDA treatment (Martens et al. 1996; Miklyaeva et al. 1994, 1995, 1997; Muir & Whishaw 1999).
The HVA/DA ratio is at least doubled in the striatum of 12-week-old MitoPark mice, indicating its enhanced DA turnover, whereas in cortex the HVA/DA ratio is instead reduced, indicating a reduced DA turnover. The pronounced hypoactivity and reduced striatal DA levels observed in 12-week-old MitoPark mice model the earliest phase of PD, when patients turn to neurologists with first clinical symptoms. At this age, MitoPark mice respond in a robust manner to a high dose of L-DOPA, particularly with an enhancement of horizontal activity, but respond only modestly to a low L-DOPA dose, again correlating with the L-DOPA diagnostic test used clinically.
At 24 weeks of age, MitoPark mice exhibit severe hypokinesia with less than half of the horizontal movements and only 20% of the vertical activity of control mice. By this age, the striatal DA levels were reduced to 10% of normal levels, DA metabolites were under 20% and the HVA/DA ratio increased about threefold compared to the controls. In contrast, cortical DA, DOPAC, HVA levels and the HVA/DA ratio reduced by only 30–40%. In animals at this age, the response to L-DOPA is pronounced even if the dose is low, particularly for the L-DOPA-induced vertical activity. The MitoPark mice, around 24 weeks of age, thereby model clinical features of PD patients who have had the disease for several years and who respond well to L-DOPA treatment.
At 32 weeks of age, MitoPark mice display symptoms similar to advanced PD with respect to their spontaneous and L-DOPA-induced locomotor behavior: without treatment they are severely bradykinetic, while a low dose of L-DOPA (4 mg/kg) induces a fourfold increase of horizontal movement. It should be noted that this low dose has no effect in 8–16-week-old MitoPark mice. In 32-week-old MitoPark mice, the high L-DOPA dose (20 mg/kg) induces a doubly-peaked activity pattern; after a brief increase in horizontal movement immediately after injection, MitoPark mice display a period of 60–90 min with very little locomotion, followed by a second more extended peak of activity lasting between 45 and 60 min. During the period of reduced locomotor activity MitoPark mice move in a typical, and abnormal way, often interrupted by freezing and stereotypic movements. A similar double-peak locomotor activity has been described in the 6-OHDA rat model, where the rotational behavior following apomorphine treatment has a double-peak pattern that is dependent on the apomorphine dose (Ungerstedt 1971). Besides the severely reduced DA and DA metabolite levels in striatum (less than 5% of control levels), 32-week-old MitoPark mice have significantly lower DA, DOPAC and HVA levels in frontal cortex (less than 50% of control levels).
The differential biochemical changes seen in the MitoPark animals may reflect regional differences in the phenotype of midbrain DA neurons and also correlate well with that seen in PD. It is thought that the DA neurons in pars compacta of the substantia nigra projecting to striatum have higher DAT expression than those in the VTA. Moreover, it is believed that there is a subpopulation of VTA neurons with little or no DAT expression; the mesocortical projection is postulated to have lower DAT levels than the mesolimbic (i.e. olfactory tubercle) projection (Chiodo et al. 1984; Haber et al. 1995; Lammel et al. 2008). Since the DAT promoter drives cre expression in the MitoPark mice, this may be partially responsible for a greater effect on the nigrostriatal pathway. Interestingly, parallel changes are seen in human PD where DA neurons in the pars compacta degenerate earlier and more extensively than those in the VTA (German et al. 1989, 1992; Javoy-Agid et al. 1981).
Despite the marked changes already at 32 weeks of age, MitoPark mice survive another 8–10 weeks without a significant increase in mortality to reach an age of 40–42 weeks. At this time they need to be sacrificed because of their poor condition, mostly because of weight loss despite being provided with moist food on the floor of the cage. During the last 2 months, between 32 and 40 weeks of age, the locomotor deficits including the decline of rearing and horizontal movements continue, but there are otherwise no major changes in behavior.
Compared with the two other rodent models predominantly used in preclinical PD research, the rat 6-OHDA model and the mouse MPTP-model, MitoPark mice offer the major advantage of higher reproducibility compared with toxin-induced models (Terzioglu & Galter 2008). Furthermore, MitoPark mice display a very slow progression of the symptoms, more similarly reflecting the disease progression in PD patients vs. the acute ablation of the DA system manifested in most lesion models. In addition, the slow progression of symptoms in MitoPark mice offers the opportunity to study the effects of chronic treatments for prolonged periods of time (i.e. several months) under conditions of a slow and gradual aggravation of symptoms in line with the situation in PD patients.
In conclusion, MitoPark mice can be used to model different stages of PD, ranging from preclinical to advanced, stages that may allow for the evaluation of treatments during different stages.
Supplementary Material
Acknowledgments
This study was supported by the Swedish Research Council, the Swedish Brain Foundation and Hållstens Forskningsstiftelse, The Swedish Parkinson Foundation, Swedish Brain Power, the Michael J. Fox Foundation and Karolinska Institutet Funds.
Footnotes
Conflict of interest statement: N- G. L. and L. O. are co-owners of a company owning commercial rights to the MitoPark mice.
Additional Supporting Information may be found in the online version of this article:
Figure S1: Control experiment with pure L-DOPA/benserazide treatment (20/4 mg/kg, Sigma-Aldrich, Sweden). (a) The mean horizontal locomotor activity of six MitoPark mice treated (arrow) with the pure drug combination at the age of 30 weeks; locomotor activity of two MitoPark mice treated with saline is shown as dashed line. (b) Mean horizontal and vertical activities of eight control littermate mice during the first hour after treatment with saline (four mice) or pure L-DOPA/benserazide cocktail (four mice). Locomotor results were tested with Student’s t-test and statistically significant differences are indicated as follows: *, P < 0.05; ***, P < 0.001.
As a service to our authors and readers, this journal provides supporting information supplied by the authors. Such materials are peer-reviewed and may be re-organized for online delivery, but are not copy-edited or typeset. Technical support issues arising from supporting information (other than missing files) should be addressed to the authors.
References
- Bogaerts V, Theuns J, Van Broeckhoven C. Genetic findings in Parkinson’s disease and translation into treatment: a leading role for mitochondria? Genes Brain Behav. 2008;7:129–151. doi: 10.1111/j.1601-183X.2007.00342.x. [DOI] [PMC free article] [PubMed] [Google Scholar]
- Chiodo LA, Bannon MJ, Grace AA, Roth RH, Bunney BS. Evidence for the absence of impulse-regulating somato-dendritic and synthesis-modulating nerve terminal autoreceptors on subpopulations of mesocortical DA neurons. Neuroscience. 1984;12:1–16. doi: 10.1016/0306-4522(84)90133-7. [DOI] [PubMed] [Google Scholar]
- Coyle JT. The development of catecholaminergic neurons of the central nervous system. Neurosci Res. 1973;5:35–52. doi: 10.1016/b978-0-12-512505-5.50008-2. [DOI] [PubMed] [Google Scholar]
- Ekstrand M, Larsson NG. Breeding and genotyping of Tfam conditional knockout mice. Methods Mol Biol. 2002;197:391–400. doi: 10.1385/1-59259-284-8:391. [DOI] [PubMed] [Google Scholar]
- Ekstrand M, Terzioglu M, Galter D, Zhu S, Hofstetter C, Lindqvist E, Thams S, Bergstrand A, Hansson FS, Trifunovic A, Hoffer B, Cullheim S, Mohammed AH, Olson L, Larsson NG. Progressive parkinsonism in mice with respiratory-chain-deficient DA neurons. Proc Natl Acad Sci U S A. 2007;104:1325–1330. doi: 10.1073/pnas.0605208103. [DOI] [PMC free article] [PubMed] [Google Scholar]
- Fujita M, Shimada S, Nishimura T, Uhl GR, Tohyama M. Ontogeny of DA transporter mRNA expression in the rat brain. Brain Res Mol Brain Res. 1993;19:222–226. doi: 10.1016/0169-328x(93)90031-j. [DOI] [PubMed] [Google Scholar]
- German DC, Manaye K, Smith WK, Woodward DJ, Saper CB. Midbrain DArgic cell loss in Parkinson’s disease: computer visualization. Ann Neurol. 1989;26:507–514. doi: 10.1002/ana.410260403. [DOI] [PubMed] [Google Scholar]
- German DC, Manaye KF, Sonsalla PK, Brooks BA. Midbrain DArgic cell loss in Parkinson’s disease and MPTP-induced parkinsonism: sparing of calbindin-D28k-containing cells. Ann N Y Acad Sci. 1992;648:42–62. doi: 10.1111/j.1749-6632.1992.tb24523.x. [DOI] [PubMed] [Google Scholar]
- Haber SN, Ryoo H, Cox C, Lu W. Subsets of midbrain DArgic neurons in monkeys are distinguished by different levels of mRNA for the DA transporter: comparison with the mRNA for the D2 receptor, tyrosine hydroxylase and calbindin immunoreactivity. J Comp Neurol. 1995;362:400–410. doi: 10.1002/cne.903620308. [DOI] [PubMed] [Google Scholar]
- Huebert ND, Palfreyman MG, Haegele KD. A comparison of the effects of reversible and irreversible inhibitors of aromatic L-amino acid decarboxylase on the half-life and other pharmacokinetic parameters of oral L-3,4-dihydroxyphenylalanine. Drug Metab Dispos. 1983;11:195–200. [PubMed] [Google Scholar]
- Javoy-Agid F, Ploska A, Agid Y. Microtopography of tyrosine hydroxylase, glutamic acid decarboxylase, and choline acetyltransferase in the substantia nigra and ventral tegmental area of control and Parkinsonian brains. J Neurochem. 1981;37:1218–1227. doi: 10.1111/j.1471-4159.1981.tb04672.x. [DOI] [PubMed] [Google Scholar]
- Lammel S, Hetzel A, Hackel O, Jones I, Liss B, Roeper J. Unique properties of mesoprefrontal neurons within a dual mesocorticolimbic DA system. Neuron. 2008;57:760–773. doi: 10.1016/j.neuron.2008.01.022. [DOI] [PubMed] [Google Scholar]
- Larsson NG, Wang J, Wilhelmsson H, Oldfors A, Rustin P, Lewandoski M, Barsh GS, Clayton DA. Mitochondrial transcription factor A is necessary for mtDNA maintenance and embryogenesis in mice. Nat Genet. 1998;18:231–236. doi: 10.1038/ng0398-231. [DOI] [PubMed] [Google Scholar]
- Martens DJ, Whishaw IQ, Miklyaeva EI, Pellis SM. Spatio-temporal impairments in limb and body movements during righting in an hemiparkinsonian rat analogue: relevance to axial apraxia in humans. Brain Res. 1996;733:253–262. doi: 10.1016/0006-8993(96)00547-1. [DOI] [PubMed] [Google Scholar]
- Miklyaeva EI, Castaneda E, Whishaw IQ. Skilled reaching deficits in unilateral DA-depleted rats: impairments in movement and posture and compensatory adjustments. J Neurosci. 1994;14:7148–7158. doi: 10.1523/JNEUROSCI.14-11-07148.1994. [DOI] [PMC free article] [PubMed] [Google Scholar]
- Miklyaeva EI, Martens DJ, Whishaw IQ. Impairments and compensatory adjustments in spontaneous movement after unilateral DA depletion in rats. Brain Res. 1995;681:23–40. doi: 10.1016/0006-8993(95)00277-w. [DOI] [PubMed] [Google Scholar]
- Miklyaeva EI, Woodward NC, Nikiforov EG, Tompkins GJ, Klassen F, Ioffe ME, Whishaw IQ. The ground reaction forces of postural adjustments during skilled reaching in unilateral DA-depleted hemiparkinson rats. Behav Brain Res. 1997;88:143–152. doi: 10.1016/s0166-4328(97)00043-0. [DOI] [PubMed] [Google Scholar]
- Muir GD, Whishaw IQ. Ground reaction forces in locomoting hemi-parkinsonian rats: a definitive test for impairments and compensations. Exp Brain Res. 1999;126:307–314. doi: 10.1007/s002210050739. [DOI] [PubMed] [Google Scholar]
- Schapira AH. Mitochondria in the aetiology and pathogenesis of Parkinson’s disease. Lancet Neurol. 2008;7:97–109. doi: 10.1016/S1474-4422(07)70327-7. [DOI] [PubMed] [Google Scholar]
- Sorensen L, Ekstrand M, Silva JP, Lindqvist E, Xu B, Rustin P, Olson L, Larsson NG. Late-onset cortico-hippocampal neurodepletion attributable to catastrophic failure of oxidative phosphorylation in MILON mice. J Neurosci. 2001;21:8082–8090. doi: 10.1523/JNEUROSCI.21-20-08082.2001. [DOI] [PMC free article] [PubMed] [Google Scholar]
- Terzioglu M, Galter D. Parkinson’s disease: genetic versus toxin-induced rodent models. FEBS J. 2008;275:1384–1391. doi: 10.1111/j.1742-4658.2008.06302.x. [DOI] [PubMed] [Google Scholar]
- Ungerstedt U. Postsynaptic supersensitivity after 6-hydroxy-DA induced degeneration of the nigro-striatal DA system. Acta Physiol Scand Suppl. 1971;367:69–93. doi: 10.1111/j.1365-201x.1971.tb11000.x. [DOI] [PubMed] [Google Scholar]
- Yoshitake T, Iizuka R, Yoshitake S, Weikop P, Muller WE, Ogren SO, Kehr J. Hypericum perforatum L preferentially increases extracellular DA levels in the rat prefrontal cortex. Br J Pharmacol. 2004;142:414–418. doi: 10.1038/sj.bjp.0705822. [DOI] [PMC free article] [PubMed] [Google Scholar]
Associated Data
This section collects any data citations, data availability statements, or supplementary materials included in this article.