

Abstract
Transition between epithelial and mesenchymal states is a feature of both normal development and tumor progression. We report that expression of chloride channel accessory protein hCLCA2 is a characteristic of epithelial differentiation in the immortalized MCF10A and HMLE models, while induction of EMT by cell dilution, TGFbeta, or mesenchymal transcription factors sharply reduces hCLCA2 levels. Attenuation of hCLCA2 expression by lentiviral shRNA caused cell overgrowth and focus formation, enhanced migration and invasion, and increased mammosphere formation in methylcellulose. These changes were accompanied by downregulation of E-cadherin and upregulation of mesenchymal markers such as vimentin and fibronectin. Moreover, hCLCA2 expression is greatly downregulated in breast cancer cells with a mesenchymal or claudin-low profile. These observations suggest that loss of hCLCA2 may promote metastasis. We find that higher-than-median expression of hCLCA2 is associated with a one-third lower rate of metastasis over an 18 year period among breast cancer patients compared to lower-than-median (n=344, unfiltered for subtype). Thus, hCLCA2 is required for epithelial differentiation, and its loss during tumor progression contributes to metastasis. Overexpression of hCLCA2 has been reported to inhibit cell proliferation and is accompanied by increases in chloride current at the plasma membrane and reduced intracellular pH (pHi). We found that knockdown cells have sharply reduced chloride current and higher pHi, both characteristics of tumor cells. These results suggest a mechanism for the effects on differentiation. Loss of hCLCA2 may allow escape from pHi homeostatic mechanisms, permitting the higher intracellular and lower extracellular pH that are characteristic of aggressive tumor cells.
Keywords: hCLCA2, epithelial to mesenchymal transition, differentiation, breast, metastasis, HMLE, chloride
Introduction
Recent studies have revealed that epithelial tissues are formed from stem cells that have mesenchymal properties (Elenbaas, Spirio et al. 2001; Liao, Zhang et al. 2007; Mani, Guo et al. 2008). Reactivation of certain mesenchymal transcription factors can reverse epithelial differentiation both in vitro and in vivo, and confer invasiveness, growth factor-independence, and resistance to anoikis and various toxins (Cano, Pérez-Moreno et al. 2000; Thiery 2002; Mani, Guo et al. 2008). Tumor cells frequently exploit this reversibility to escape the confines of the primary tissue.
The structures and pathways that confer functionality on differentiated tissues may play essential roles in maintaining the differentiated state and suppressing neoplasia. For example, loss of E- and R-cadherins is associated with breast cancer progression, and knockdown of these adherens junction proteins causes epithelial to mesenchymal transtion, EMT, in immortalized cells and metastatic behavior in transformed cells (Onder, Gupta et al. 2008; Agiostratidou, Li et al. 2009). These events are mediated by a network of transcription factors such as Snail, Twist, Slug, Goosecoid, and beta catenin-TCF that regulate, or are regulated by, these structural proteins (Polyak and Weinberg 2009).
The chloride channel accessory protein hCLCA2 is frequently downregulated in breast tumors and tumor cell lines (Gruber and Pauli 1999; Li, Cowell et al. 2004). We recently demonstrated that this gene is induced by p53 in response to a variety of stresses, including DNA damage (Walia, Ding et al. 2009). In that study, we showed that ectopic expression of hCLCA2 arrested proliferation of normal cells and induced apoptosis in cancer cell lines, while knockdown of hCLCA2 produced faster growth and increased resistance to doxorubicin. Apoptosis in breast cancer cells was preceded by an increase in chloride current and a reduction in intracellular pH (pHi).
Several studies indicate the importance of chloride and potassium ion current regulation in EMT and invasiveness. The potassium-chloride cotransporter KCC-3 is upregulated in invasive cervical carcinoma (Hsu, Chen et al. 2007). Cells overexpressing KCC-3 downregulate E-cadherin and undergo EMT-like changes, while a channel inhibitor reverses these changes. Similarly, in glioma, chloride and potassium channels localize to invadopodia and regulate their function (Sontheimer 2008).
In this study, we sought to determine the relationship between hCLCA2 expression and epithelial differentiation. We found that not only is it a marker of differentiated cells and required for full expression of the epithelial phenotype, but it is repressed by mesenchymal transcription factors. In addition, its loss correlates with increased risk of metastasis. These results suggest that loss of hCLCA2 expression is another advantage conferred upon tumor cells by transition to a mesenchymal phenotype.
Results
hCLCA2 is a marker of epithelial differentiation in breast
Previous studies showed that hCLCA2 is expressed in normal mammary epithelium but is frequently lost in breast cancer (Gruber and Pauli 1999; Li, Cowell et al. 2004). To confirm these conclusions, we searched publicly available data from genomic transcriptional profiling studies of breast tissue and cell lines (GEO, Oncomine, and NextBio). From a profile of genes differentially expressed between myoepithelial and luminal cell layers of the breast, we found that hCLCA2 mRNA is approximately eightfold more abundant in the myoepithelial layer (Grigoriadis, Mackay et al. 2006). Data from cell culture systems that model mammary development also indicate that hCLCA2 is upregulated during differentiation. For example, primary HMEC allowed to form acini in Matrigel have fivefold higher levels of hCLCA2 than cells cultured in monolayer (Dontu et al., Table S7 (Dontu, Abdallah et al. 2003)). Similarly, MCF10A cultured on permeable membranes that support normal apico-basal polarization and other aspects of differentiation have an eightfold higher level of hCLCA2 than monolayers (Marshall, Pai et al. 2009). A gene co-expression analysis using the Oncomine Clusters software revealed that hCLCA2 expression co-varies with epithelial markers such as claudins 1 and 8, E-cadherin, tetraspannins 1 and 7, and gap junctional proteins.
We further analyzed the hCLCA2 gene expression pattern using a comprehensive transcriptional profile of breast cancer cell lines (Charafe-Jauffret, Ginestier et al. 2006). Results indicated that hCLCA2 is highly expressed in immortalized cell lines such as 184B5, MCF10A, and HME-1 but generally downregulated in breast cancer cell lines (Figure 1A). We noted that downregulation was most dramatic in cell lines classed as mesenchymal, such as Hs578T, MDA-MB-157, SKBR-7, and MDA-MB-231, typically by more than 100-fold. We confirmed these results by RT-qPCR (Figure 1B) and immunoblot (Supplementary Figure 1). These mesenchymal cell lines share an expression profile with a newly identified breast cancer subtype termed claudin-low. This subtype is associated with stem-cell and mesenchymal properties, triple-negative phenotype, and resistance to chemotherapy (Prat, Parker et al. 2010).
Figure 1.

Downregulation of hCLCA2 in breast cancer cell lines. A, transcriptional profile data extracted from an Affymetrix cDNA microarray study of breast cancer cell lines (Charafe-Jauffret, Ginestier et al. 2006). B, RT-qPCR data confirming that mesenchymal cell lines have lowest expression. C, expression profile of cancer cell lines derived by genetic modification in vitro.
Two in vitro models of HMEC transformation also display loss of hCLCA2 with acquisition of malignant properties. The HMLE cell line was immortalized from primary cells by transduction with hTERT and the SV40 early region encoding large (LT) and small T (ST) antigens (Elenbaas, Spirio et al. 2001). HMLE is non-tumorigenic and displays high levels of hCLCA2 (Figure 1C). However, transduction of activated H-RasV12 into HMLE (HMLER) leads to an approximately twentyfold reduction in hCLCA2 expression, accompanied by enhanced mammosphere formation and tumorigenicity (Figure 1C; (Elenbaas, Spirio et al. 2001; Mani, Guo et al. 2008)).
A second in vitro progression model, the Rao series, was generated by transducing hTERT into mammary epithelial cells isolated from mammoplasties to create Rao-1 (Rao, Bryant et al. 2003). The activated H-RAS61L allele was then tranduced to create Rao-2, which remains anchorage-dependent, non-tumorigenic, and epithelioid. Rao-3 is an anchorage-independent derivative that arose spontaneously from Rao-2 and forms spindle cell tumors in mouse (Rao, Alper et al. 2006). Transcriptional profiling shows Rao-3 to be of the claudin-low subtype (C. Perou, personal communication)(Prat, Parker et al. 2010). Like the autochthonous claudin-low cell lines, Rao-3 shows precipitous downregulation of hCLCA2, while Rao-2 shows upregulation relative to Rao-1 (Figure 1C; see Discussion). Together, these data imply that hCLCA2 expression is an epithelial characteristic that is lost when cells acquire a more mesenchymal phenotype.
hCLCA2 expression in epithelial cells is conditional
High expression in immortalized cells presented a conundrum because ectopically expressed hCLCA2 is growth-inhibitory, causing G1 arrest in immortalized cells and apoptosis in tumor cells (Walia, Ding et al. 2009). We considered that the cell lines tested in Figure 1 were confluent, G1-arrested monolayers at the time of RNA extraction. MCF10A cells undergo cell cycle arrest and accumulate in G0/G1 phase upon reaching confluency (Enerback, Porter et al. 2002). Therefore we hypothesized that hCLCA2 expression in immortal cells is conditional, induced only in contact-inhibited, non-dividing cells.
To test this concept, cells were seeded at various densities and allowed to recover for 24h before analysis. We found that rapidly growing cells seeded at 10% density had 50-fold lower expression of hCLCA2 mRNA than cells seeded at 90% confluency, and this difference increased to 150-fold if cells were confluent for 6 days (Figure 2A–B). At the protein level, the difference was 17-fold (Figure 2C).
Figure 2.

Expression of hCLCA2 is induced at high cell density. Cells were seeded at 10% or 90% confluency and incubated for 24h or 6 days past confluency before measuring expression levels of hCLCA2 mRNA or protein relative to internal standards. A, phase-contrast images. Scale bar indicates 500 µm. B, quantification of hCLCA2 mRNA by RT-qPCR. P <0.05. C, quantification of protein induction by immunoblot. The fold increase in hCLCA2 is indicated after normalization to actin internal control.
hCLCA2 is downregulated in EMT
We noted that sparsely seeded cells acquired a fibroblast-like morphology, while confluent cells formed a cobblestone pattern (Figure 2A). It was recently reported that mammary epithelial cells such as MCF10A undergo EMT upon dilution to low cell density, switching from E-cadherin to N-cadherin, vimentin, and other mesenchymal markers (Sarrio, Rodriguez-Pinilla et al. 2008). This suggested that repression of hCLCA2 in low-density cells might be due to EMT. We investigated further using HMLE, which are known to form cobblestone-like islands that exhibit an epithelial phenotype surrounded by cells that are mesenchymal in expression profile and behavior (Figure 3A (Mani, Guo et al. 2008; Walia and Elble 2010)). We recently showed that the islands are very resistant to trypsinization while mesenchymal cells detach readily, allowing the two subpopulations to be separated by differential adhesion to substrate (Walia and Elble 2010).
Figure 3.
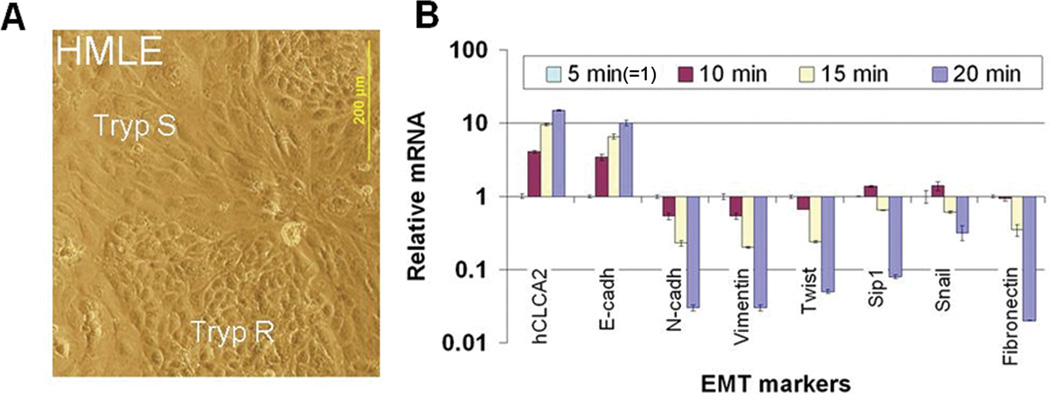
hCLCA2 expression correlates with epithelial differentiation. HMLE cells were separated into epithelioid and mesenchymal subpopulations by differential trypsinization and subjected to RT-qPCR. A, micrograph showing typical cobblestone-like epithelial islands surrounded by elongated mesenchymal cells. B, transcriptional profile by RT-qPCR showing that hCLCA2 expression peaks in the most trypsin-resistant fraction, correlating directly with E-cadherin but inversely with mesenchymal markers. Expression in the 5 min pool was normalized as 1.
We found that in cells fractionated by this method, hCLCA2 expression correlated directly with epithelial marker E-cadherin and inversely with mesenchymal markers (Figure 3B). Thus, cells detached by 5 min trypsinization (normalized as 1) had ~15-fold lower levels of hCLCA2 and tenfold lower levels of E-cadherin mRNA compared to cells requiring 20 min trypsinization (Figure 3B). On the other hand, the 5 min fraction showed elevated expression of mesenchymal markers fibronectin by ~50-fold, N-cadherin by ~33.3-fold, Vimentin by ~33.3-fold, Twist by ~20-fold and Sip-1 by ~12.5-fold (Figure 3B). Together, these results indicate that hCLCA2, like E-cadherin, is a marker of epithelial differentiation that is lost when cells transition to a mesenchymal phenotype.
EMT-inducing transcription factors and TGF-beta repress expression of hCLCA2
EMT is known to be regulated by transcription factors such as Snail, Twist, and Goosecoid that repress epithelial genes such as E-cadherin and activate those for mesenchymal proteins. Ectopic expression of these transcription factors causes EMT in multiple cell types (Mani, Guo et al. 2008). Because of the correspondence between expression of hCLCA2 and that of E-cadherin, we tested whether Snail could repress hCLCA2. Ectopic expression of Snail in MCF10CA1d cells repressed E-cadherin by 2.5-fold and hCLCA2 by tenfold (Figure 4A–B). Similarly, transduction of HMLE with Snail, Twist, or Goosecoid repressed hCLCA2 by ~4.9-, 5.3-, or 8.0-fold, respectively (Figure 4C). Moreover, induction of EMT with TGFbeta resulted in a fourfold reduction of hCLCA2 in HMLE and 13-fold reduction in MCF10A (Figure C–D). EMT can also be induced in HMLE by the suppression of regulatory proteins such as E-cadherin by RNA interference (Onder, Gupta et al. 2008). Knockdown of E-cadherin reduced hCLCA2 mRNA levels by ~90% (Onder et al., supplementary table 1 (Onder, Gupta et al. 2008)). Thus, hCLCA2 is downregulated when EMT is induced by a variety of methods in several independently immortalized cell lines. These results suggest that loss of hCLCA2 expression in post-EMT tumor cell lines is due to activation of mesenchymal transcription factors.
Figure 4.

Repression of hCLCA2 by mesenchymal transcription factors and TGF beta. A, immunoblot showing repression of both hCLCA2 and E-cadherin in MCF10A infected with an adenovirus encoding Snail. Relative expression levels are indicated after normalization to actin. B, repression of hCLCA2 in HMLE transduced with lentiviruses encoding Snail, Twist, Goosecoid, or TGF beta. C, repression of hCLCA2 in MCF10A treated with 2.5 ng/ml TGF beta relative to untreated control (=1). B and C show RT-qPCR data.
hCLCA2 knockdown imparts a migratory and invasive phenotype to differentiated epithelial cells
Expression of certain epithelial proteins may be required to maintain epithelial differentiation (Tanaka, Shirkoohi et al. 2006; Onder, Gupta et al. 2008). To determine whether hCLCA2 plays an active role in maintaining epithelial differentiation, we knocked down its expression using the hybrid shRNA-miR lentiviral systems GIPZ and doxycycline-regulated TRIPZ (OpenBiosystems). We noticed frequent “hummingbird figures” in the knockdown cells, suggesting a migratory phenotype, and loss of E-cadherin from cell-cell junctions (Supplementary Figure 2). We therefore performed a wound assay. hCLCA2 knockdown accelerated wound closure of MCF10A cell monolayers over a four day time-course (Figure 5A). To test invasiveness, we seeded cells on Matrigel-coated membranes in Boyden chemotaxis chambers. hCLCA2 knockdown cells were about 4.5-fold more invasive than control cells (Figure 5B). Transcriptional profiling of several markers of EMT revealed a steep reduction in E-cadherin but surprisingly modest effects on mesenchymal markers (Figure 5C). We obtained similar results using two different shRNA inserts and two different vectors (data not shown). In contrast, immunoblots showed induction of both fibronectin and vimentin, suggesting post-transcriptional regulation of these proteins in these cells (Figure 5D). On the other hand, E-cadherin was repressed in accordance with the mRNA profile.
Figure 5.

Knockdown of hCLCA2 imparts a migratory and invasive phenotype to MCF10A. A, wound assays conducted with MCF10A cells transduced with GIPZ bearing hCLCA2 shRNA or control insert. B, Matrigel invasion assay in a Boyden chamber. N = 3, p <= 0.0006489. C, transcriptional profile of EMT markers in cells expressing shRNA1 in a doxycycline-dependent manner from TRIPZ vector. Doxycycline had no effect on vector-transduced controls. D, expression of EMT marker proteins in cell lysates. Relative expression levels are indicated normalized to actin.
To confirm these results in a cell line immortalized by different methods, we knocked down hCLCA2 in HMLE using the TRIPZ lentivirus. Addition of doxycycline greatly accelerated wound closure in knockdown cells but not in controls expressing ineffective shRNA or in parental HMLE (Figure 6A, B). Knockdown cells were also more invasive through Matrigel in a Boyden chamber assay (Supp. Figure 3). Control cells plated at low density were polygonal and readily formed clusters, whereas knockdown cells had a spindle-shaped mesenchymal morphology and did not cluster (Supplementary Figure 4). In addition, we observed that the knockdown cells grew to a higher density (Figure 6C and Supp. Figure 5), formed frequent foci and free-floating spheroids (Figure 6D and Supp. Figure 6), and produced more mammospheres in methylcellulose than did controls (Figure 6E). Transcriptional profiling of these cells showed steep downregulation of E-cadherin and upregulation of mesenchymal markers except for fibronectin (Figure 6F). Immunoblot analysis revealed pronounced downregulation of E-cadherin and upregulation of both vimentin and fibronectin, suggesting that fibronectin is regulated posttranscriptionally (Figure 6F, G). These results demonstrate that hCLCA2 contributes to epithelial differentiation and illustrate how its loss would be advantageous to tumor cells.
Figure 6.


Knockdown of hCLCA2 in HMLE promotes the loss of epithelial differentiation. HMLE cells were transduced with TRIPZ lentivirus expressing hCLCA2 shRNA1 in a doxycycline-dependent manner. Control cells contained a non-silencing control treated with doxycycline (first panel) or untreated. A, wound assays in presence or absence of doxycycline. B, quantification of wound closure. C, cell number 4 days after seeding at 100% confluency. D, focus formation. E, increased mammosphere formation by hCLCA2 knockdown cells. F, transcriptional profile of EMT markers. G, immunoblots of whole-cell lysates. P values for sh1, minus vs. plus doxycycline, for B, C, D, and E respectively were 0.000431, 0.006891, 0.0002145, and 0.001748; n = 3.
Higher hCLCA2 expression correlates with lower breast cancer metastasis
To determine whether hCLCA2 expression levels were predictive of metastasis, we interrogated a data bank that allowed comparison of primary tumor transcriptional profiles with the incidence of metastasis over an 18 year period in 344 breast cancer patients. We found that the incidence of metastasis in patients having lower-than-median expression was 40.1% after 18 years, while in patients with higher-than-median expression, the incidence was only 26.7% (Figure 7). Thus, higher expression of hCLCA2 reduced the rate of metastasis by 33.4% (p=0.0043, n=344). These data support the hypothesis that hCLCA2 loss is an indicator of malignancy, but it was not possible to distinguish whether hCLCA2 loss was a better predictor of metastasis for any particular breast cancer subtypes.
Figure 7.

Effect of hCLCA2 expression level on metastasis-free survival in breast cancer patients. Transcriptional profiles of primary breast tumors were analyzed for hCLCA2 expression and related to metastasis incidence over an 18 year period. Data are presented as a Kaplan-Meier plot of metastasis-free survival (proportion vs. time) of 344 patients with high (blue line) or low (red line) expression level of the gene "CLCA2". Chi-square p-value = 0.00428.
Knockdown of hCLCA2 reduces chloride current and increases pHi
CLCA proteins are thought to stimulate chloride current at the plasma membrane by modulating an unidentified chloride channel (Hamann, Gibson et al. 2009). To address the mechanism by which hCLCA2 influences epithelial differentiation, we measured the transmembrane chloride current in knockdown cells and controls after stimulating with calcium and ionomycin. We found that knockdown cells had dramatically lower chloride current than controls (Figure 8A).
The activity of certain chloride channels plays a role in regulation of pHi, which in turn affects many aspects of cell physiology (Kunzelmann 2005). Tumor cells typically have an alkaline pHi due to metabolic changes concomitant with tumor progression (Pouyssegur, Dayan et al. 2006). In previous work, we had found that ectopic expression of hCLCA2 stimulated chloride current and reduced pHi (Walia, Ding et al. 2009). Here we observed that knockdown cells had higher pHi than controls, 8.0 versus 7.6, respectively (Figure 8B). These results suggest that downregulation of hCLCA2 during tumor progression allows metabolic changes advantageous to tumor cells.
Discussion
A number of structural and other proteins that characterize epithelial cells have turned out unexpectedly to be required for maintenance of the epithelial phenotype. In this study, we show that hCLCA2, a protein previously shown to be a p53-inducible growth inhibitor, is associated with terminal differentiation of mammary epithelial cells but is downregulated when such cells transit to a mesenchymal phenotype. This downregulation is mediated by the same factors that were shown in other studies to drive EMT in immortalized epithelial cells and whose expression is upregulated in post-EMT metastatic cell lines. This suggests that the precipitous loss of hCLCA2 in metastatic breast cancer is due to activation of the mesenchymal program. By attenuating expression of hCLCA2, we show that hCLCA2 is not passive in this process but is required for full expression of the epithelial phenotype. The changes we observed with knockdown, such as enhanced migration, focus formation, and changes in the transcriptional program, all suggest that loss of hCLCA2 abets tumor progression. This conclusion is reinforced by the finding that low expression corresponds to a higher risk of metastasis in breast cancer patients.
We found that ectopic expression of Snail represses expression of hCLCA2 in parallel with E-cadherin. Snail is one of a network of transcription factors, also including Slug, Twist and Zeb, that orchestrate EMT by repressing expression of genes required for epithelial differentiation such as E-cadherin and other cell-cell junctional proteins. These factors bind to the sequence CANNTG, termed the E-box, three iterations of which are found in the E-cadherin promoter (Hajra, Chen et al. 2002). They respond to distinct environmental cues, and all have been shown to regulate E-cadherin by direct binding to its promoter (Moustakas and Heldin 2007). We identified eight E-boxes within 800bp of the transcriptional start of hCLCA2, including two near the established binding sites for p53 (VW and RCE, unpublished data). Further studies will establish whether binding of Snail or sister proteins to these sites mediates transcriptional repression of hCLCA2 in EMT.
In breast cancer cell lines, hCLCA2 was generally downregulated relative to immortalized cells, but there were exceptions. For example, luminal-B MDA-MB-175 cells and basal HCC1937 cells had higher hCLCA2 expression than the other cancer cell lines. We speculate that these cell lines may have mutations in hCLCA2 or its responsive pathways that allow them to tolerate higher hCLCA2 levels, much as described for tumor suppressor p53. For example, p53 is only mutated in about 20% of all breast cancers (Pharoah, Day et al. 1999). In the rest, alterations in the upstream and downstream proteins of the p53 pathway disable its tumor suppressor activity (Gasco, Shami et al. 2002). Further genetic studies of such cell lines may provide insight into pathways of growth inhibition by hCLCA2 and explain why its loss is not a stronger predictor of metastasis in breast cancer. In melanoma, by comparison, the transition between nonmetastatic and metastatic disease is accompanied by a 162-fold reduction in hCLCA2 levels (Riker, Enkemann et al. 2008).
In vitro models of tumor progression have yielded many insights into the genetic changes required for tumor survival and metastasis. Ectopic expression of hTERT in primary cells was used to generate the immortal cell lines HMEC-Tert and Rao-1, and additional changes were made by viral transduction. We observed here that ectopic expression of activated H-Ras61L alone was insufficient to downregulate hCLCA2 in the Rao-1 immortalized line but upregulated it instead. In contrast, ectopic expression of H-RasV12 in HMLE steeply downregulated hCLCA2. This cell line expresses SV40 LT, which binds and inactivates p53. We speculate that expression of H-Ras61L in Rao-1 induces Arf, which binds Mdm2 and stabilizes p53, thereby upregulating p53-inducible hCLCA2 (Lin and Lowe 2001; Walia, Ding et al. 2009). Presumably this induction does not occur in HMLE transduced by H-RasV12, HMLER, because p53 is inactivated by LT in those cells. Ras has been shown to promote EMT by activating Snail, Slug, and Rac (Polyak and Weinberg 2009). Moderate activation of Snail could account for the downregulation of hCLCA2 in HMLER, but full EMT in HMLER requires ectopic expression of mesenchymal transcription factors (Mani, Guo et al. 2008). Presumably, these pathways have been activated by spontaneous mutation in Rao-3. The results presented here suggest that attenuation of hCLCA2 causes the loss of some epithelial properties but alone is insufficient to produce a complete transition to a mesenchymal phenotype.
The varied effects of hCLCA2 knockdown support this view. Attenuation of hCLCA2 induced EMT more effectively in HMLE than in MCF10A (Figures 5 and 6). This may be due to the means by which HMLE was generated. These cells were immortalized by transduction of hTERT and SV40 LT and ST. LT inactivates p53 and Rb while ST inactivates protein phosphatase 2A, causing an increase in PI3K/AKT and other mitogenic activities (Sablina, Hector et al. 2010). Recent studies demonstrate that mutation of p53 potentiates EMT by several avenues, directing cells away from luminal and toward basal or mesenchymal character, especially if Rb is also mutated (D'Assoro, Leontovich et al. 2010; Jiang, Deng et al. 2010; Kogan-Sakin, Tabach et al. 2011). High activity of AKT also promotes EMT, by inactivating an inhibitor of Snail, GSK3beta, and by stabilizing NFkB, a transactivator of Twist (Thiery and Sleeman 2006). Therefore, HMLE may be primed for EMT in a way that MCF10A is not, and the effect of hCLCA2 loss on EMT may depend on genetic background.
Triple-negative breast cancer has long been associated with poor prognosis and a basal transcription profile. However a distinct triple-negative subtype has recently been recognized with a mesenchymal transcription profile, the claudin-low subtype (Hennessy, Gonzalez-Angulo et al. 2009; Taube, Herschkowitz et al. 2010). This subtype is enriched in cancer stem cells and associated with chemoresistance and other mesenchymal properties (Creighton, Chang et al. 2010). The finding that claudin-low cell lines, whether autochthonous or selected in vitro, display dramatic downregulation of hCLCA2 supports the conclusion that hCLCA2 expression signifies epithelial differentiation and is downregulated with EMT.
The observation that knockdown of hCLCA2 leads to an increase in pHi may be significant to the altered phenotype. It has long been known that tumor cells have higher pHi than normal cells due to enhanced growth factor signaling, glycolytic metabolism, and other factors. Ligation of growth factor receptors increases pHi by 0.2 units, partly due to activation of ERK, which in turn phosphorylates and activates NHE1 (Moolenaar, Tsien et al. 1983; Hesketh, Moore et al. 1985; Malo, Li et al. 2007). An alkaline cytosol may protect tumor cells from apoptosis because the optimal pH for caspases and apoptotic endonucleases is acidic (Barry and Eastman 1992; Furlong, Ascaso et al. 1997). Furthermore, translocation of Bax to the mitochondrial membrane is enhanced eightfold by acidic pHi, and anti-apoptotic Bcl-2 activity is enhanced at alkaline pHi (Antonsson, Conti et al. 1997). Moreover, artificially increasing pHi of 3T3 cells by transduction of a H+-ATPase confers serum- and anchorage-independence and tumorigenicity in mice (Perona and Serrano 1988). Thus, the enhanced ability of knockdown cells to form mammospheres may be partly attributable to their alkaline pH. Regulation of pHi by hCLCA2 may occur via its modulation of a chloride channel such as CFTR that is known to regulate pHi (Poulsen, Fischer et al. 1994; Barriere, Poujeol et al. 2001). Alternatively, the growth-inhibitory activity of hCLCA2 may arise from some yet undiscovered function of the molecule.
The results presented here are consistent with our prior studies of the hCLCA2 mouse ortholog mClca5. Like hCLCA2, mClca5 expression in normal cells was found to be dependent on cell density. Moreover, metastatic, mesenchymal tumor cell lines such as 4T1 had greatly reduced expression and were very sensitive to ectopic expression of mClca5. Surviving colonies with stable expression had reacquired a cobblestone growth pattern (Beckley, Pauli et al. 2004). Conclusive evidence of the role of hCLCA2 in mammary differentiation and tumor suppression depends on the outcome of gene deletion studies now in progress.
Materials and Methods
Cell lines and cell culture
Breast cell lines MCF-10A, MCF-7, T47D, BT-549, MDA-MB-231, MDA-MB-435, and Hs578T were obtained from ATCC and grown in the media specified. HMLE and HMLER were a kind gift from Robert Weinberg (MIT) and were grown as described (Mani, Guo et al. 2008). Rao-1, -2, and -3 were cultured as described by Cheng (Cheng, Ding et al. 2006). We thank Paul Wade (NIEHS) for the generous gift of adenovirus expressing Snail (Dhasarathy, Kajita et al. 2007). Knockdown of hCLCA2 was performed as described (Walia et al 2009). Lentiviral transductants were selected for at least two weeks in 1 µg/ml puromycin.
Bioinformatics
Oncomine1 (Compendia Bioscience, Ann Arbor, MI), Gene Expression Omnibus2 (NCBI), and NextBio3 were used to analyze hCLCA2 gene expression patterns. To determine the effect of hCLCA2 on patient survival, the microarray expression data and the relevant annotation for the patient data used in this study were downloaded from the GEO repository2. The accession numbers are GSE5327 (Minn, Gupta et al. 2007) and GSE2034 (Wang, Klijn et al. 2005). A total of 344 Affymetrix CEL files (each per patient sample) were processed and normalized all at once using the RMA method implemented by "affy" R package version 1.26.1 (Gautier, Cope et al. 2004). If multiple probes exist for the same gene, the average values were used to represent the expression levels of that gene. The gene expression levels for all samples were then scaled through z-score transformation. An estimate of the survival curve for censored data was computed using the Kaplan-Meier method implemented by “survival” R package version 2.35–8 by Therneau and Lumley4. All analyses were performed using the R version 2.11.1, a language and environment for statistical computing (R Development Core Team5).
RNA analysis
Cells were grown to confluency except where noted, and RNA was extracted and analyzed as described (Beckley, Pauli et al. 2004; Walia, Ding et al. 2009; Walia and Elble 2010). Primer sequences are available upon request.
Western blot analysis
Levels of hCLCA2 were measured by immunoprecipitation and western blotting as described using antibody TVE20 (Elble, Walia et al. 2006). For the cell density experiment, cleared lysates were prepared from 10-cm dishes containing cells at 10% (10 dishes), 90% (3 dishes) and 100% (2 dishes) confluency. Total protein concentration in lysates was measured by the BCA assay (BioRad) and 1 mg of total protein was used for immunoprecipitation. For whole cell lysates, 50 ug protein was loaded per lane. Antibodies were from Cell Signaling except beta actin (W. Halfter via the Developmental Studies Hybridoma Bank, University of Iowa). The size marker was Dual color (Bio-Rad). Protein expression was quantified on an Odyssey instrument (Licor).
Differential trypsinization
HMLE cells were grown and differentially trypsinized as described (Walia and Elble 2010). Cells collected after 5, 10, 15 and 20 min were lyzed in Trizol for RNA extraction followed by RT-qPCR as described.
Migration and invasion assays
To quantify migration, a wound was made in the cell monolayer using a sterile 1 ml pipet tip. Migration of cells into the wound was observed after 24h and 48h intervals. Photomicrographs of four different fields were compared and quantified. Invasion was measured by seeding 105 cells onto modified Boyden chamber inserts containing Matrigel-coated membranes (pore size 8µm, BD Biosciences, Franklin Lakes, NJ, USA). After 24h, the inserts were stained and cells present on the lower side of the membrane were quantified manually by counting four different fields at 150× magnification.
Mammosphere assay
The mammosphere culture assay was performed as described (Mani, Guo et al. 2008; Walia and Elble 2010). Single cell suspensions were prepared in MEGM containing 1% methylcellulose (MC) and FBS as indicated. Mammospheres were photographed to determine their diameters.
Electrophysiology and pH measurements
HMLE cells grown on poly-D-lysine-coated coverslips were used for recording chloride currents. For whole-cell patch-clamp recordings, the bath solution contained (in mM): 140 NaCl, 5 KCl, 10 HEPES, 1 MgCl2, 1 CaCl2, pH adjusted to 7.35 with NaOH and the pipette solution contained (in mM): 140 CsCl, 5 KCl, 10 HEPES, 2 MgCl2, 10 EGTA, 2 K2ATP, 0.5 GTP, pH adjusted to 7.35 with CsOH. Ionomycin (4 µM) was applied extracellularly. All the experiments were performed using voltage ramps and voltage steps from −100 mV to 100 mV. Currents were recorded using an Axopatch 200B integrating patch-clamp amplifier (Axon Instruments Inc., Union City, CA). Data were digitized (VR-10B; InstruTech, Great Neck, NY) and stored in the computer using Lab View interface (National Instruments, Austin, TX). For analysis, data were filtered at 2.5 kHz (−3 dB frequency with an eight-pole low-pass Bessel filter; LPF-8; Warner Instruments, Hamden, CT) and digitized at 5 kHz. Cell capacitance was measured manually using the readout in the Axopatch 200B amplifier. All the currents were subtracted from the control currents before application of ionomycin. Current and current density were plotted and the amplitudes were measured using Origin 6.1 (OriginLab Corporation, Northampton, MA). Intracellular pH was measured essentially as described (Walia, Ding et al. 2009).
Supplementary Material
Supplementary Figure 1. Immunoblot showing hCLCA2 expression in MCF10A but not breast cancer cell lines. Cell lysates were prepared from confluent 10 cm dishes, hCLCA2 was immunoprecipitated, and the blot was probed with anti-hCLCA2 antibody.
Supplementary Figure 2. Morphological change and loss of E-cadherin in knockdown cells. Immunofluorescence detection of E-cadherin (E-Cad) and phase-contrast (PC) images. Bar, 100µm. Doxycycline had no effect on control cells transduced with TRIPZ negative control vector.
Supplementary Figure 3. Matrigel transwell invasion assay of HMLE-TRIPZ-sh1 cells in presence or absence of doxycycline inducer. Cells were fixed and counted six hours after seeding.
Supplementary Figure 4. Morphology of HMLE-TRIPZ-sh1 cells in the presence or absence of doxycycline. Single-cell suspensions were seeded at low density. After 24h, cells were fixed and stained with crystal violet, and images were collected at 150× (top) or 300× (bottom) original magnification.
Supplementary Figure 5. Effect of hCLCA2 knockdown on HMLE growth characteristics. Upper panels, micrographs of cells seeded at the same density and grown for 7 days. Lower panel, growth rate and density at plateau. P values for days 4, 10, and 13 were 0.007164, 0.003693, and 0.005042, respectively.
Supplementary Figure 6. Micrographs showing focus formation in hCLCA2 knockdown cells. HMLE-TRIPZ-sh1 cells were grown for 7 days after reaching confluency in the presence (B, C) or absence (A) of doxycycline induction. A and B, phase-contrast. C, RFP fluorescent image of spheroid dislodged from adherent monolayer. Bar, 200 µm.
Supplementary Figure 7. hCLCA2 knockdown cells have reduced Cl− conductance and increased pHi. A, left, HMLE-TRIPZ-sh1 cells were patch-clamped, and whole cell Cl− current was recorded after ionomycin treatment to stimulate calcium-activated chloride conductance. NC1, cells transduced with TRIPZ -NC control vector and induced with doxycycline. NC2, cells transduced with TRIPZ -sh1 uninduced. Sh1, cells transduced with TRIPZ-sh1 and induced with doxycycline. Right panel, average of two to four recordings. (* p < 0.01, n = 10.) B, intracellular pH of HMLE bearing GIPZ-sh1 or control. P = 0.00484.
Acknowledgements
This work was supported by the following grants: NIH grant 1R15CA151094-01 and Excellence in Academic Medicine grants 56252 and 56253 to RCE; and NIH grants DK065742 and DA028017 to LP.
Footnotes
Conflict of Interest
The authors declare no conflict of interest.
References
- Agiostratidou G, Li M, et al. Loss of retinal cadherin facilitates mammary tumor progression and metastasis. Cancer Res. 2009;69(12):5030–5038. doi: 10.1158/0008-5472.CAN-08-4007. [DOI] [PMC free article] [PubMed] [Google Scholar]
- Antonsson B, Conti F, et al. Inhibition of Bax channel-forming activity by Bcl-2. Science. 1997;277(5324):370–372. doi: 10.1126/science.277.5324.370. [DOI] [PubMed] [Google Scholar]
- Barriere H, Poujeol C, et al. CFTR modulates programmed cell death by decreasing intracellular pH in Chinese hamster lung fibroblasts. Am. J. Physiol Cell Physiol. 2001;281(3):C810–C824. doi: 10.1152/ajpcell.2001.281.3.C810. [DOI] [PubMed] [Google Scholar]
- Barry MA, Eastman A. Endonuclease activation during apoptosis: the role of cytosolic Ca2+ and pH. Biochem. Biophys. Res. Commun. 1992;186(2):782–789. doi: 10.1016/0006-291x(92)90814-2. [DOI] [PubMed] [Google Scholar]
- Beckley JR, Pauli BU, et al. Re-expression of detachment-inducible chloride channel mCLCA5 suppresses growth of metastatic breast cancer cells. J. Biol. Chem. 2004;279(40):41634–41641. doi: 10.1074/jbc.M408334200. [DOI] [PubMed] [Google Scholar]
- Cano A, Pérez-Moreno M, et al. The transcription factor snail controls epithelial-mesenchymal transitions by repressing E-cadherin expression. Nat Cell Biol. 2000;2(2):76–83. doi: 10.1038/35000025. [DOI] [PubMed] [Google Scholar]
- Charafe-Jauffret E, Ginestier C, et al. Gene expression profiling of breast cell lines identifies potential new basal markers. Oncogene. 2006;25(15):2273–2284. doi: 10.1038/sj.onc.1209254. [DOI] [PubMed] [Google Scholar]
- Cheng J, Ding M, et al. Loss of RAB25 expression in breast cancer. Int J Cancer. 2006;118(12):2957–2964. doi: 10.1002/ijc.21739. [DOI] [PubMed] [Google Scholar]
- Creighton C, Chang J, et al. Epithelial-mesenchymal transition (EMT) in tumor-initiating cells and its clinical implications in breast cancer. J Mammary Gland Biol Neoplasia. 2010;15(2):253–260. doi: 10.1007/s10911-010-9173-1. [DOI] [PubMed] [Google Scholar]
- D'Assoro AB, Leontovich A, et al. Abrogation of p53 function leads to metastatic transcriptome networks that typify tumor progression in human breast cancer xenografts. Int J Oncol. 2010;37(5):1167–1176. doi: 10.3892/ijo_00000768. [DOI] [PMC free article] [PubMed] [Google Scholar]
- Dhasarathy A, Kajita M, et al. The transcription factor snail mediates epithelial to mesenchymal transitions by repression of estrogen receptor-alpha. Mol Endocrinol. 2007;21(12):2907–2918. doi: 10.1210/me.2007-0293. [DOI] [PMC free article] [PubMed] [Google Scholar]
- Dontu G, Abdallah W, et al. In vitro propagation and transcriptional profiling of human mammary stem/progenitor cells. Genes Dev. 2003;17(10):1253–1270. doi: 10.1101/gad.1061803. [DOI] [PMC free article] [PubMed] [Google Scholar]
- Elble RC, Walia V, et al. The putative chloride channel hCLCA2 has a single C-terminal transmembrane segment. J. Biol. Chem. 2006;281(40):29448–29454. doi: 10.1074/jbc.M605919200. [DOI] [PubMed] [Google Scholar]
- Elenbaas B, Spirio L, et al. Human breast cancer cells generated by oncogenic transformation of primary mammary epithelial cells. Genes Dev. 2001;15(1):50–65. doi: 10.1101/gad.828901. [DOI] [PMC free article] [PubMed] [Google Scholar]
- Enerback C, Porter DA, et al. Psoriasin expression in mammary epithelial cells in vitro and in vivo. Cancer Res. 2002;62(1):43–47. [PubMed] [Google Scholar]
- Furlong I, Ascaso R, et al. Intracellular acidification induces apoptosis by stimulating ICE-like protease activity. J Cell Sci. 1997;110(Pt 5):653–661. doi: 10.1242/jcs.110.5.653. [DOI] [PubMed] [Google Scholar]
- Gasco M, Shami S, et al. The p53 pathway in breast cancer. Breast Cancer Res. 2002;4(2):70–76. doi: 10.1186/bcr426. [DOI] [PMC free article] [PubMed] [Google Scholar]
- Gautier L, Cope L, et al. affy--analysis of Affymetrix GeneChip data at the probe level. Bioinformatics. 2004;20(3):307–315. doi: 10.1093/bioinformatics/btg405. [DOI] [PubMed] [Google Scholar]
- Grigoriadis A, Mackay A, et al. Establishment of the epithelial-specific transcriptome of normal and malignant human breast cells based on MPSS and array expression data. Breast Cancer Res. 2006;8(5):R56. doi: 10.1186/bcr1604. [DOI] [PMC free article] [PubMed] [Google Scholar]
- Gruber AD, Pauli BU. Tumorigenicity of human breast cancer is associated with loss of the Ca2+-activated chloride channel CLCA2. Cancer Res. 1999;59(21):5488–5491. [PubMed] [Google Scholar]
- Hajra KM, Chen DY, et al. The SLUG zinc-finger protein represses E-cadherin in breast cancer. Cancer Res. 2002;62(6):1613–1618. [PubMed] [Google Scholar]
- Hamann M, Gibson A, et al. Human ClCa1 modulates anionic conduction of calcium-dependent chloride currents. J Physiol. 2009;587(Pt 10):2255–2274. doi: 10.1113/jphysiol.2009.170159. [DOI] [PMC free article] [PubMed] [Google Scholar]
- Hennessy B, Gonzalez-Angulo A, et al. Characterization of a naturally occurring breast cancer subset enriched in epithelial-to-mesenchymal transition and stem cell characteristics. Cancer Res. 2009;69(10):4116–4124. doi: 10.1158/0008-5472.CAN-08-3441. [DOI] [PMC free article] [PubMed] [Google Scholar]
- Hesketh T, Moore J, et al. A common sequence of calcium and pH signals in the mitogenic stimulation of eukaryotic cells. Nature. 1985;313(6002):481–484. doi: 10.1038/313481a0. [DOI] [PubMed] [Google Scholar]
- Hsu Y, Chen Y, et al. KCl cotransporter-3 down-regulates E-cadherin/beta-catenin complex to promote epithelial-mesenchymal transition. Cancer Res. 2007;67(22):11064–11073. doi: 10.1158/0008-5472.CAN-07-2443. [DOI] [PubMed] [Google Scholar]
- Jiang Z, Deng T, et al. Rb deletion in mouse mammary progenitors induces luminal-B or basal-like/EMT tumor subtypes depending on p53 status. J Clin Invest. 2010;120(9):3296–3309. doi: 10.1172/JCI41490. [DOI] [PMC free article] [PubMed] [Google Scholar]
- Kogan-Sakin I, Tabach Y, et al. Mutant p53(R175H) upregulates Twist1 expression and promotes epithelial-mesenchymal transition in immortalized prostate cells. Cell Death Differ. 2011;18(2):271–281. doi: 10.1038/cdd.2010.94. [DOI] [PMC free article] [PubMed] [Google Scholar]
- Kunzelmann K. Ion channels and cancer. J Membr Biol. 2005;205(3):159–173. doi: 10.1007/s00232-005-0781-4. [DOI] [PubMed] [Google Scholar]
- Li X, Cowell JK, et al. CLCA2 tumour suppressor gene in 1p31 is epigenetically regulated in breast cancer. Oncogene. 2004;23(7):1474–1480. doi: 10.1038/sj.onc.1207249. [DOI] [PubMed] [Google Scholar]
- Liao M, Zhang C, et al. Enrichment of a population of mammary gland cells that form mammospheres and have in vivo repopulating activity. Cancer Res. 2007;67(17):8131–8138. doi: 10.1158/0008-5472.CAN-06-4493. [DOI] [PubMed] [Google Scholar]
- Lin A, Lowe S. Oncogenic ras activates the ARF-p53 pathway to suppress epithelial cell transformation. Proc Natl Acad Sci U S A. 2001;98(9):5025–5030. doi: 10.1073/pnas.091100298. [DOI] [PMC free article] [PubMed] [Google Scholar]
- Malo M, Li L, et al. Mitogen-activated protein kinase-dependent activation of the Na+/H+ exchanger is mediated through phosphorylation of amino acids Ser770 and Ser771. J Biol Chem. 2007;282(9):6292–6299. doi: 10.1074/jbc.M611073200. [DOI] [PubMed] [Google Scholar]
- Mani S, Guo W, et al. The epithelial-mesenchymal transition generates cells with properties of stem cells. Cell. 2008;133(4):704–715. doi: 10.1016/j.cell.2008.03.027. [DOI] [PMC free article] [PubMed] [Google Scholar]
- Marshall A, Pai V, et al. In vitro multipotent differentiation and barrier function of a human mammary epithelium. Cell Tissue Res. 2009;335(2):383–395. doi: 10.1007/s00441-008-0719-0. [DOI] [PubMed] [Google Scholar]
- Minn A, Gupta G, et al. Lung metastasis genes couple breast tumor size and metastatic spread. Proc Natl Acad Sci U S A. 2007;104(16):6740–6745. doi: 10.1073/pnas.0701138104. [DOI] [PMC free article] [PubMed] [Google Scholar]
- Moolenaar W, Tsien R, et al. Na+/H+ exchange and cytoplasmic pH in the action of growth factors in human fibroblasts. Nature. 1983;304(5927):645–648. doi: 10.1038/304645a0. [DOI] [PubMed] [Google Scholar]
- Moustakas A, Heldin CH. Signaling networks guiding epithelial-mesenchymal transitions during embryogenesis and cancer progression. Cancer Sci. 2007;98(10):1512–1520. doi: 10.1111/j.1349-7006.2007.00550.x. [DOI] [PMC free article] [PubMed] [Google Scholar]
- Onder T, Gupta P, et al. Loss of E-cadherin promotes metastasis via multiple downstream transcriptional pathways. Cancer Res. 2008;68(10):3645–3654. doi: 10.1158/0008-5472.CAN-07-2938. [DOI] [PubMed] [Google Scholar]
- Perona R, Serrano R. Increased pH and tumorigenicity of fibroblasts expressing a yeast proton pump. Nature. 1988;334(6181):438–440. doi: 10.1038/334438a0. [DOI] [PubMed] [Google Scholar]
- Pharoah P, Day N, et al. Somatic mutations in the p53 gene and prognosis in breast cancer: a meta-analysis. Br J Cancer. 1999;80(12):1968–1973. doi: 10.1038/sj.bjc.6690628. [DOI] [PMC free article] [PubMed] [Google Scholar]
- Polyak K, Weinberg R. Transitions between epithelial and mesenchymal states: acquisition of malignant and stem cell traits. Nat Rev Cancer. 2009;9(4):265–273. doi: 10.1038/nrc2620. [DOI] [PubMed] [Google Scholar]
- Poulsen JH, Fischer H, et al. Bicarbonate conductance and pH regulatory capability of cystic fibrosis transmembrane conductance regulator. Proc. Natl. Acad. Sci. U. S. A. 1994;91(12):5340–5344. doi: 10.1073/pnas.91.12.5340. [DOI] [PMC free article] [PubMed] [Google Scholar]
- Pouyssegur J, Dayan F, et al. Hypoxia signalling in cancer and approaches to enforce tumour regression. Nature. 2006;441(7092):437–443. doi: 10.1038/nature04871. [DOI] [PubMed] [Google Scholar]
- Prat A, Parker J, et al. Phenotypic and molecular characterization of the claudin-low intrinsic subtype of breast cancer. Breast Cancer Res. 2010;12(5):R68. doi: 10.1186/bcr2635. [DOI] [PMC free article] [PubMed] [Google Scholar]
- Rao K, Alper O, et al. Cytogenetic characterization and H-ras associated transformation of immortalized human mammary epithelial cells. Cancer Cell Int. 2006;6:15. doi: 10.1186/1475-2867-6-15. [DOI] [PMC free article] [PubMed] [Google Scholar]
- Rao K, Bryant E, et al. Production of spindle cell carcinoma by transduction of H-Ras 61L into immortalized human mammary epithelial cells. Cancer Lett. 2003;201(1):79–88. doi: 10.1016/s0304-3835(03)00423-3. [DOI] [PubMed] [Google Scholar]
- Riker A, Enkemann S, et al. The gene expression profiles of primary and metastatic melanoma yields a transition point of tumor progression and metastasis. BMC Med Genomics. 2008;1:13. doi: 10.1186/1755-8794-1-13. [DOI] [PMC free article] [PubMed] [Google Scholar]
- Sablina AA, Hector M, et al. Identification of PP2A complexes and pathways involved in cell transformation. Cancer Res. 2010;70(24):10474–10484. doi: 10.1158/0008-5472.CAN-10-2855. [DOI] [PMC free article] [PubMed] [Google Scholar]
- Sarrio D, Rodriguez-Pinilla SM, et al. Epithelial-mesenchymal transition in breast cancer relates to the basal-like phenotype. Cancer Res. 2008;68(4):989–997. doi: 10.1158/0008-5472.CAN-07-2017. [DOI] [PubMed] [Google Scholar]
- Sontheimer H. An unexpected role for ion channels in brain tumor metastasis. Exp Biol Med (Maywood) 2008;233(7):779–791. doi: 10.3181/0711-MR-308. [DOI] [PMC free article] [PubMed] [Google Scholar]
- Tanaka H, Shirkoohi R, et al. siRNA gelsolin knockdown induces epithelial-mesenchymal transition with a cadherin switch in human mammary epithelial cells. Int J Cancer. 2006;118(7):1680–1691. doi: 10.1002/ijc.21559. [DOI] [PubMed] [Google Scholar]
- Taube J, Herschkowitz J, et al. Core epithelial-to-mesenchymal transition interactome gene-expression signature is associated with claudin-low and metaplastic breast cancer subtypes. Proc Natl Acad Sci U S A. 2010;107(35):15449–15454. doi: 10.1073/pnas.1004900107. [DOI] [PMC free article] [PubMed] [Google Scholar]
- Thiery JP. Epithelial-mesenchymal transitions in tumour progression. Nat. Rev. Cancer. 2002;2(6):442–454. doi: 10.1038/nrc822. [DOI] [PubMed] [Google Scholar]
- Thiery JP, Sleeman JP. Complex networks orchestrate epithelial-mesenchymal transitions. Nat. Rev. Mol. Cell Biol. 2006;7(2):131–142. doi: 10.1038/nrm1835. [DOI] [PubMed] [Google Scholar]
- Walia V, Ding M, et al. hCLCA2 Is a p53-Inducible Inhibitor of Breast Cancer Cell Proliferation. Cancer Res. 2009;69(16):6624–6632. doi: 10.1158/0008-5472.CAN-08-4101. [DOI] [PMC free article] [PubMed] [Google Scholar]
- Walia V, Elble R. Enrichment for breast cancer cells with stem/progenitor properties by differential adhesion. Stem Cells Dev. 2010 doi: 10.1089/scd.2009.0430. [DOI] [PubMed] [Google Scholar]
- Wang Y, Klijn J, et al. Gene-expression profiles to predict distant metastasis of lymph-node-negative primary breast cancer. Lancet. 2005;365(9460):671–679. doi: 10.1016/S0140-6736(05)17947-1. [DOI] [PubMed] [Google Scholar]
Associated Data
This section collects any data citations, data availability statements, or supplementary materials included in this article.
Supplementary Materials
Supplementary Figure 1. Immunoblot showing hCLCA2 expression in MCF10A but not breast cancer cell lines. Cell lysates were prepared from confluent 10 cm dishes, hCLCA2 was immunoprecipitated, and the blot was probed with anti-hCLCA2 antibody.
Supplementary Figure 2. Morphological change and loss of E-cadherin in knockdown cells. Immunofluorescence detection of E-cadherin (E-Cad) and phase-contrast (PC) images. Bar, 100µm. Doxycycline had no effect on control cells transduced with TRIPZ negative control vector.
Supplementary Figure 3. Matrigel transwell invasion assay of HMLE-TRIPZ-sh1 cells in presence or absence of doxycycline inducer. Cells were fixed and counted six hours after seeding.
Supplementary Figure 4. Morphology of HMLE-TRIPZ-sh1 cells in the presence or absence of doxycycline. Single-cell suspensions were seeded at low density. After 24h, cells were fixed and stained with crystal violet, and images were collected at 150× (top) or 300× (bottom) original magnification.
Supplementary Figure 5. Effect of hCLCA2 knockdown on HMLE growth characteristics. Upper panels, micrographs of cells seeded at the same density and grown for 7 days. Lower panel, growth rate and density at plateau. P values for days 4, 10, and 13 were 0.007164, 0.003693, and 0.005042, respectively.
Supplementary Figure 6. Micrographs showing focus formation in hCLCA2 knockdown cells. HMLE-TRIPZ-sh1 cells were grown for 7 days after reaching confluency in the presence (B, C) or absence (A) of doxycycline induction. A and B, phase-contrast. C, RFP fluorescent image of spheroid dislodged from adherent monolayer. Bar, 200 µm.
Supplementary Figure 7. hCLCA2 knockdown cells have reduced Cl− conductance and increased pHi. A, left, HMLE-TRIPZ-sh1 cells were patch-clamped, and whole cell Cl− current was recorded after ionomycin treatment to stimulate calcium-activated chloride conductance. NC1, cells transduced with TRIPZ -NC control vector and induced with doxycycline. NC2, cells transduced with TRIPZ -sh1 uninduced. Sh1, cells transduced with TRIPZ-sh1 and induced with doxycycline. Right panel, average of two to four recordings. (* p < 0.01, n = 10.) B, intracellular pH of HMLE bearing GIPZ-sh1 or control. P = 0.00484.