Abstract
Glioblastoma multiforme is a primary brain tumor known for its rapid proliferation, diffuse invasion, and prominent neovasculature and necrosis. This study explores the in vivo link between these characteristics and hypoxia by comparing the relative spatial geometry of developing vasculature inferred from gadolinium-enhanced T1-weighted MRI (T1Gd), edematous tumor extent revealed on T2-weighted MRI (T2), and hypoxia assessed by 18F-fluoromisonidazole PET (18F-FMISO). Given the role of hypoxia in upregulating angiogenic factors, we hypothesized that the distribution of hypoxia seen on 18F-FMISO is correlated spatially and quantitatively with the amount of leaky neovasculature seen on T1Gd.
Methods
A total of 24 patients with glioblastoma underwent T1Gd, T2, and 18F-FMISO—11 studies preceded surgical resection or biopsy, 7 followed surgery and preceded radiation therapy, and 11 followed radiation therapy. Abnormal regions seen on the MRI scan were segmented, including the necrotic center (T0), the region of abnormal blood–brain barrier associated with disrupted vasculature (T1Gd), and infiltrating tumor cells and edema (T2). The 18F-FMISO images were scaled to the blood 18F-FMISO activity to create tumor-to-blood ratio (T/B) images. The hypoxic volume (HV) was defined as the region with T/Bs greater than 1.2, and the maximum T/B (T/Bmax) was determined by the voxel with the greatest T/B value.
Results
The HV generally occupied a region straddling the outer edge of the T1Gd abnormality and into the T2. A significant correlation between HV and the volume of the T1Gd abnormality that relied on the existence of a large outlier was observed. However, there was consistent correlation between surface areas of all MRI-defined regions and the surface area of the HV. The T/Bmax, typically located within the T1Gd region, was independent of the MRI-defined tumor size. Univariate survival analysis found the most significant predictors of survival to be HV, surface area of HV, surface area of T1Gd, and T/Bmax.
Conclusion
Hypoxia may drive the peripheral growth of glioblastomas. This conclusion supports the spatial link between the volumes and surface areas of the hypoxic and MRI regions; the magnitude of hypoxia, T/Bmax, remains independent of size.
Keywords: hypoxia, glioblastoma, 18F-FMISO PET, MRI, angiogenesis
Glioblastoma multiforme (World Health Organization grade IV) is a highly anaplastic, rapidly proliferating, primary brain neoplasm characterized by diffuse invasion of the normal-appearing tissue peripheral to the contrast-enhanced abnormality seen on clinical imaging (1). These tumors respond poorly to the most aggressive treatments. The current standard of care includes surgical resection, followed by radiation therapy and chemotherapy, with a prognosis of survival generally falling in the range of 6–14 mo (2).
MRI and PET play important roles in the assessment of patients with gliomas. 18F-fluoromisonidazole PET (18F-FMISO) allows for imaging of hypoxia in vivo (3,4). On the basis of the biologic links between hypoxia and the aggressiveness of disease, including tumor-induced neoangiogenesis, it is instructive to compare 18F-FMISO images of hypoxia with MRI scans to reveal aspects of new vasculature and invasion.
Gadolinium-enhanced T1-weighted MRI (T1Gd) provides morphologic imaging of the blood–brain barrier breakdown in regions of angiogenesis usually surrounding central necrosis (5). Central necrosis appears hypointense when imaged by T1Gd because of the lack of viable vessels. In addition, edema associated with infiltrated glioma cells is hyperintense on T2-weighted MRI (T2). Exposure to ionizing radiation increases the permeability of the vasculature and may affect both T1Gd and T2 (6).
PET with the radiotracer 18F-FMISO detects regions of hypoxia independent of the tumor anatomy and perfusion (7). 18F-FMISO is a 2-nitroimidazole derivative that undergoes intracellular reduction in cells that are alive, generating a radical anion. Oxygen acts as an electron acceptor for the 18F-FMISO radical anion. In the absence of oxygen, the unstable 18F-FMISO radical anion is further reduced and covalently bound to intracellular macromolecules and cannot exit the hypoxic cells (8). Binding of 18F-FMISO is proportional to the concentration of oxygen, with significant retention occurring at oxygen levels below 3 mm Hg (9). Thus, 18F-FMISO binds to hypoxic tumor tissue but not to the oxygenated brain or oxygenated tumor (10).
The Angiogenic Cascade
As tumor cells proliferate, the local tissue becomes relatively oxygen-depleted (hypoxic). Tumor cell growth outstrips vascular development so that oxygen delivery is decreased beyond its diffusion distance. Hypoxia promotes neovascularization through a variety of molecular signals that drive tumor survival (11,12). On the molecular level, hypoxia-inducible factor-1—a transcription factor that is constantly produced but survives only in hypoxic cells—binds to a hypoxic response element that activates the transcription of more than 100 genes, promoting cell survival, invasiveness, and aggressiveness, including vascular endothelial growth factor (VEGF) (13,14). VEGF is a dominant cytokine regulating the expression of growth factor receptor genes at the onset of the angiogenic cascade (15). In its role as an angiogenic factor, VEGF serves to recruit and induce proliferation of vascular endothelial cells. In addition to the role of hypoxia in neoangiogenesis, tumor cells show adaptation to hypoxia by decreasing the proliferation rate, remaining longer in the resting phase G0, and escaping to some degree the impact of conventional treatments that principally target cells in the S phase of their cycle. A greater dose of photon irradiation (2–3 times) is required to kill hypoxic tissue relative to normoxic tissue (16), a factor that further implicates hypoxia in primary tumor recurrence (2).
This study considers the assessment of disease burden by 18F-FMISO relative to T1Gd and T2. Motivated by the biologic link between hypoxia and tumor-induced neovasculature and tumor aggressiveness, we analyzed detailed spatial and volumetric data of 18F-FMISO uptake relative to MRI-defined regions. This initial analysis provides the basis for exploring the benefit of combining MRI and PET data into a more complete picture of the disease burden for better disease assessment and prognosis.
MATERIALS AND METHODS
Patients
All 24 patients (16 men and 8 women) were diagnosed with glioblastoma multiforme (World Health Organization grade IV) and ranged in age from 37 to 76 y old (median, 54 y; mean, 54.8 y). A total of 11 studies were performed before operation (including those patients who received stereotactic biopsy as a minimal intervention affecting the imaging; PreOp), 7 studies after resection and before radiation therapy (PostOp), and 11 studies after both operation and radiation therapy (PostXRT), for a total of 29 imaging sets (summarized in Table 1). Seventeen of these patients were included in a prior report (17). Karnofsky performance scores ranged from 60 to 100 (median, 70). Each patient signed a written consent to participate in our study, which was approved by our institutional review board and radiation safety committee.
TABLE 1.
Characteristics of PreOp, PostOp, and PostXRT Groups
| Group | Patient no. | Age (y) | Sex | KPS | Extent of resection | Survival (d) |
|---|---|---|---|---|---|---|
| PreOp | 1 | 54 | F | 70 | STR | 124 |
| 2 | 73 | M | 60 | BX | 223 | |
| 3 | 55 | F | 70 | BX | 134 | |
| 4 | 72 | M | 70 | BX | 44 | |
| 5 | 43 | M | 90 | STR | 724 | |
| 6 | 63 | M | 90 | BX | 115 | |
| 7 | 43 | M | 70 | STR | 1033 | |
| 8 | 56 | M | 80 | GTR | 168 | |
| 9 | 54 | F | 70 | GTR | 767 | |
| 10 | 53 | F | 70 | BX | 376 | |
| 11 | 70 | M | 70 | BX | 430 | |
| PostOp | 12 | 49 | F | 80 | GTR | 166 |
| 13 | 47 | F | 100 | GTR | 410 | |
| 14 | 58 | M | 90 | GTR | 702 | |
| 15 | 54 | F | 70 | GTR | 767 | |
| 16 | 65 | M | 60 | STR | 266 | |
| 17 | 41 | M | 100 | STR | 550 | |
| 18 | 49 | F | 80 | STR | 483 | |
| PostXRT | 19 | 49 | F | 80 | GTR | 166 |
| 20 | 51 | M | 90 | GTR | 659 | |
| 21 | 43 | M | 90 | STR | 724 | |
| 22 | 40 | F | 90 | BX | 316 | |
| 23 | 72 | M | 70 | STR | 374 | |
| 24 | 53 | M | 100 | GTR | 414 | |
| 25 | 76 | M | 60 | STR | 351 | |
| 26 | 43 | M | 90 | STR | 724 | |
| 27 | 65 | M | 60 | STR | 286 | |
| 28 | 41 | M | 100 | STR | 550 | |
| 29 | 56 | M | 80 | GTR | 168 |
Extent of resection includes biopsy (BX), subtotal resection (STR), and gross-total resection (GTR).
KPS = Karnofsky performance score.
Imaging Tools and Techniques
PET Protocol
Patients were imaged in the supine position, and their heads were immobilized with a moldable thermoplastic mask. All PET scans were performed on an Advance Tomograph (GE Healthcare) operating in 3-dimensional, high-resolution mode, with 35 imaging planes covering a 15-cm axial field of view. Performance characteristics of the tomograph have been published elsewhere (18). Attenuation scans, with a 68Ge rotating sector source, were also performed. All emission images were reconstructed with a Hanning filter after corrections for scatter, singles, and random events, resulting in a reconstructed spatial resolution of approximately 6 mm (19). The tomograph is regularly calibrated to convert counts per minute per pixel to megabecquerels per milliliter using large vials containing known activities of 18F imaged separately from the patient and reconstructed using the same filter as the emission images.
18F-FMISO was prepared by a modification of the method of Lim and Berridge (19). Venous access lines were placed in both arms of the patient, one for the 18F-FMISO injection and the other for blood sampling. Patients were injected intravenously with 18F-FMISO (3.7 MBq/kg [0.1 mCi/kg]; maximum, 260 MBq [7 mCi]). A single-field-of-view emission scan from 120 to 140 min after injection and an attenuation scan of the brain with tumor were performed. During emission tomography, venous blood samples were obtained. Whole-blood samples (1 mL each) were counted in a multichannel γ-well counter (Cobra; Packard Corp.) that was calibrated each week in units of counts per minute per megabecquerel. Blood activity of the samples was averaged and then expressed as megabecquerels per milliliter and decay-corrected to time of injection.
MRI Protocol
MRI scans were acquired using a 1.5-T system (Horizon LX Echospeed, with version 9.1 software; GE Health-care). The preoperative stealth navigation studies included axial T1Gd with contrast (3-dimensional gradient echo, a minimal echo time] and repetition time; slice thickness, 1.3 mm, with no skip; and 26-mm field of view) and axial fast spin-echo T2 (echo time, 97.3 ms; repetition time, 4,000 ms; slice thickness, 1.7 mm, with no skip; and 26-mm field of view). Follow-up scans, including standard T1Gd (echo time, minimal; repetition time, 350 ms) and T2 (echo time, 102 ms; repetition time, 4,300 ms), were performed in 2-dimensional mode, with a spin-echo sequence and slice thickness of 5 mm and no interslice spacing.
Image Processing and Analysis
The number of days between the 18F-FMISO and the MRI scans ranged from 0 to 36 d (average, 11 d; median, 12 d). Each image set consisted of T1Gd, T2, and 18F-FMISO. The T2 and the 18F-FMISO images were coregistered to the T1Gd images. Coregistration was performed using Statistical Parametric Mapping (SPM) software (version 5; Wellcome Department of Imaging Neuroscience).
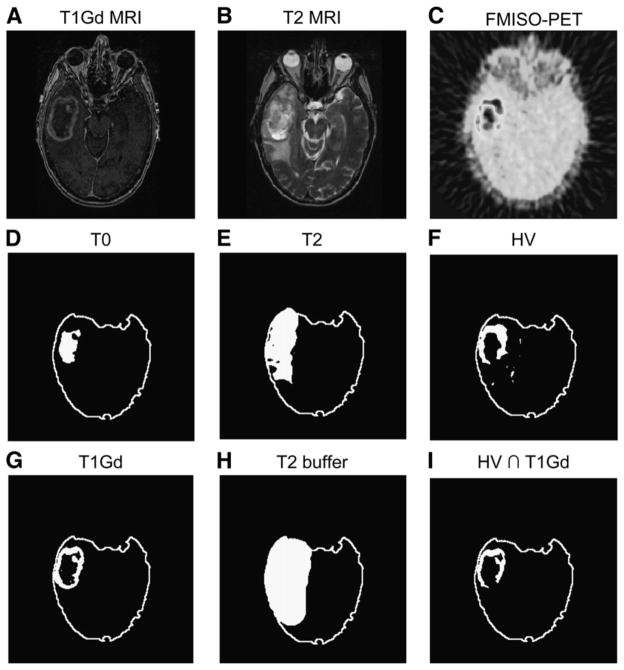
The MRI scans (T1Gd and T2) were segmented using the image-analysis tools MATLAB and Automatic Thresholding (http://www.mathworks.com/matlabcentral/fileexchange/8502; The MathWorks, Inc.). Figure 1 illustrates the distinct tumor regions segmented from the MRI scans. The 18F-FMISO images (coregistered to the T1Gd) were scaled to the blood 18F-FMISO activity to create tumor-to-blood ratio (T/B) images. As in other studies (5), a T/B cutoff of 1.2 was used to determine the hypoxic volume (HV). To verify that the 1.2 cutoff was reasonable to determine the HV, we considered a variety of T/B cutoffs. On the basis that hypoxia would not be expected at large distances from the bulky tumor mass, an HV was calculated and the portion of that HV that was outside the MRI-defined tumor region was graphed (data not shown), for a range of cutoff values. The results showed that the HV occupying presumed nontumorous regions precipitously declined above the 1.2 level. Further, greater than 99% of contralateral normal brain had a T/B of less than 1.2. These data support the validity of using the 1.2 T/B level as a threshold for hypoxia. Small nontumor regions in the brain were still detected with T/B greater than 1.2; however, these were typically scattered in isolated voxels throughout the brain. To avoid this noise, hypoxic regions were designated as tissue with an 18F-FMISO T/B greater than 1.2 inside a buffer region of 2 cm surrounding the hyperintense tumor region of the T2 MRI; this method is consistent with current region-of-interest approaches to calculating HV (6,7). Only a small number of isolated voxels with a T/B greater than 1.2 were located peripheral to the buffer region. Figures 1 and 2 illustrate these regional analyses.
FIGURE 1.
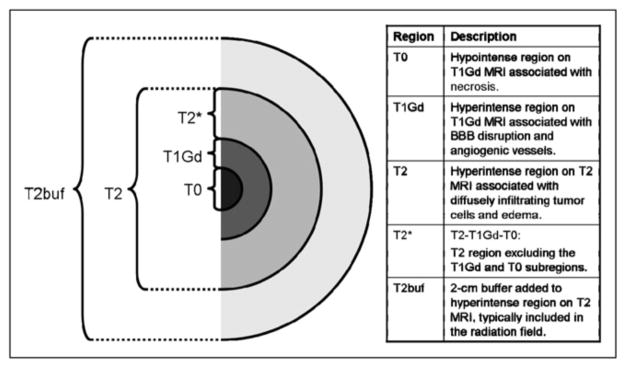
Schematic of tumor regions visible on T1Gd and T2. Table lists associations between MRI scans and schematic. T2buf = T2 buffer region.
FIGURE 2.
Results of applying image segmentation to coregistered images of right temporal glioblastoma multiforme (A–C) to generate tumor regions related to each image (D–H). Overlap of HV (F) and T1Gd (G) is shown in I.
Calculations for Volume and Surface Area of Segmented Regions
The areas of each 2-dimensional segmented tumor region (on MRI or PET scans) were added together and multiplied by the slice thickness to compute volumes. Surface area was computed by summing the areas of the top- and bottommost tumor slices with the lateral area. The lateral area was determined by adding the perimeters of each 2-dimensional segmented tumor region and multiplying it by the slice thickness.
After segmenting the T1Gd, T2, and 18F-FMISO images, we calculated the volume and surface area of the following 4 regions: necrotic center (T0, imaged as hypointense on T1Gd), region of abnormal blood–brain barrier associated with angiogenic vasculature (T1, hyperintense on T1Gd), infiltrating tumor cells and edema (hyperintense on T2, naturally including T0 and T1), and hypoxic area (T/B > 1.2 on 18F-FMISO). As shown in Figure 1, we also introduced a fifth region, T2*, as the portion of the T2 abnormality that was not also visible on T1Gd either as contrast enhancement (T1Gd) or as necrosis (T0). We generated overlaps of the different MRI-defined tumor regions with the 18F-FMISO–defined hypoxic regions to determine concordance and the spread of hypoxia in the T0, T1Gd, and T2 regions. Surface area and volume computations were taken for the overlap regions. Figure 2 of a right temporal glioblastoma multiforme displays an example of coregistered T1Gd, T2, and 18F-FMISO scans along with the thresholded regions of 18F-FMISO, T1Gd, T0, T2, and T2 buffer. An illustration of the overlap of thresholded T1Gd and HV regions is shown in Figure 2I. Although not shown for this example, overlaps for HV were also determined with the MRI-defined T0, T2, and T2* regions.
Besides measuring size-dependent quantities, we mapped 18F-FMISO intensity (scaled as T/B and constrained within the T2 buffer region) to MRI-defined subtumor regions. Using this map, we computed the maximum T/B (T/Bmax) and determined its spatial location relative to MRI abnormalities.
Statistical Analyses
Statistical analyses were performed using S-PLUS software (version 6.1; Insightful Corp.). The Mann–Whitney U test was used to assess the significance of differences in means across groups. Pearson correlation was used to assess association between variables. Survival was based on the most recent follow-up information and was calculated from the date of tumor diagnosis, taken to be the date of surgery. All analyses were repeated using survival measured from the date of the first abnormal MRI with no change in overall results. Survival analysis was performed using Cox proportional hazards regression (S-PLUS) and standard censoring procedures (20), with the significance of the individual variables assessed using log-rank tests.
RESULTS
Measures of MRI-Based and PET-Based Hypoxic Tumor Burden
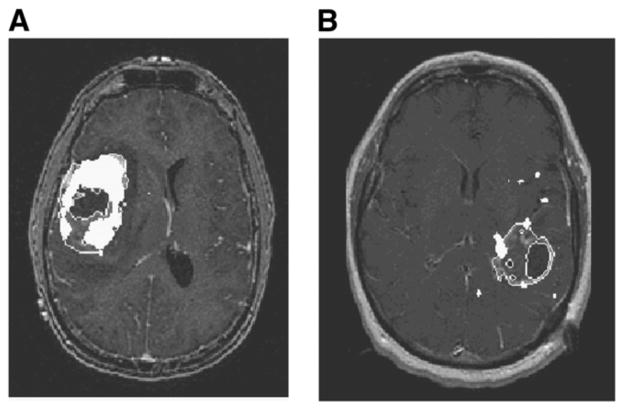
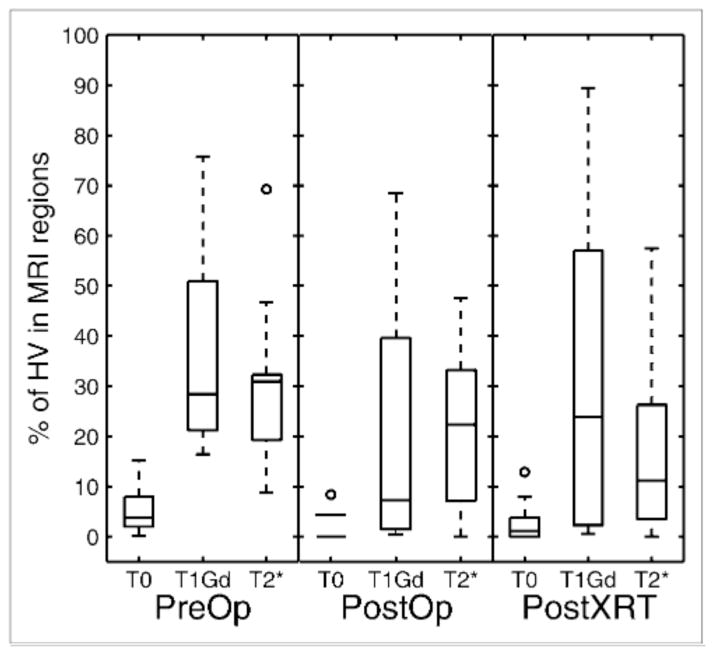
To compare regions of different sizes and shape, we chose to include measures of both volume and surface area. After we observed that HV tended to occupy an annular region straddling the outer edge of the T1Gd region (Figs. 2 and 3), surface area became an important consideration for comparisons across patients and across modalities. Had we been simply comparing approximately spheric tumor subregions across patients and across modalities, then a comparison of HVs and MRI-defined volumes would have been reasonable. However, because we were studying tumor subregions that consisted of approximately concentric annular regions (Fig. 1), it was determined that the volume of the subregions might not be the best way to quantify similarity. Surface area measurements assessed the hypothesis that hypoxia leads the growth of the invading edge of the tumor, and because this hypothesis relies on tumor growth activity at the outer edge of the abnormality surface area measurements were appropriate to consider. Additionally, surface area provides a means for distinguishing hypoxic regions of similar volume in which one is dominated by several punctate foci dispersed throughout the tumor region and the other is a more consolidated solid hypoxic region (Fig. 3). Thus, in addition to the ability of surface area measurements to illustrate relationships at the perimeter of an object, these measurements (when compared with volumetric measurements) are also useful for describing the relatively dispersed nature of a tumor within a region of interest because a dispersed punctate volume would have a larger surface area than would a solid mass of the same volume. In our study, a wide range of concordances were observed in all patient categories (Fig. 4). In general, hypoxic and T1Gd regions showed more concordant patterns in PreOp studies.
FIGURE 3.
Concordance and discordance seen between T1Gd abnormalities and 18F-FMISO (overlaid in white) in right insular glioblastoma multiforme (A) and left temporal-parietal glioblastoma multiforme (B).
FIGURE 4.
18F-FMISO concordance, or percentage of HV that is within each MRI-defined region, as function of timing of imaging. Box plots show median, 25th percentile, and 75th percentile of data, with minimum and maximum represented by whiskers.
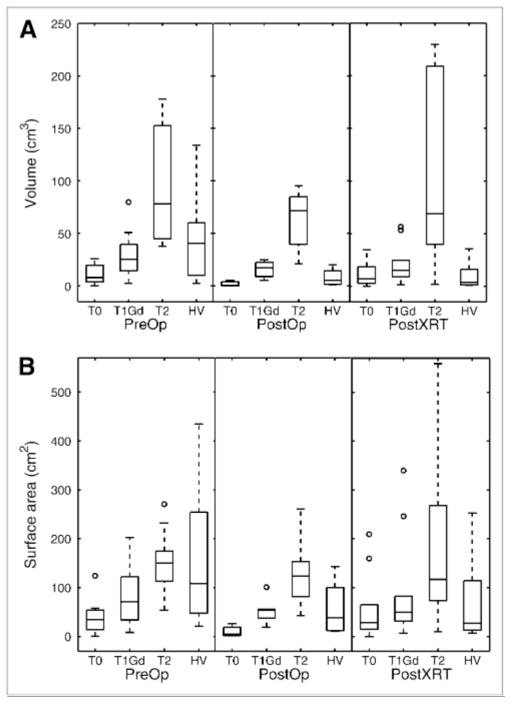
Figure 5 displays box plots of the volume distribution of the MRI abnormalities and hypoxic region for the 3 groups: PreOp, PostOp, and PostXRT. The pattern revealed in Figure 5 is that glioblastomas show a trend toward increasing volume and surface area of the MRI-defined abnormalities in the following order: T0 < T1Gd < T2. The HV is generally smaller than the volume of the T2 abnormality, with only punctate foci more peripherally located. However, HV surface area (HVsa) can be greater than T1 and T2 surface areas, which is consistent with the peripheral location of the HV relative to the MRI-defined region (Figs. 2 and 3). Specifically, in the absence of treatment, typical HVs form annular (ringlike) regions with a surface area consisting of the sum of the interior and exterior spherelike shells (Fig. 1F). Therefore, even though the HV may be smaller than the T1Gd volume, the HV is spread on the surface peripheral to the T1Gd region, yielding a larger surface area (HVsa > T1 surface area). Treatment is associated with a significant decrease in HV (PreOp to PostOp, P = 0.015; PreOp to PostXRT, P = 0.005) and borderline significant decrease in HVsa (PreOp to PostOp, P = 0.056; PreOp to PostXRT, P = 0.047).
FIGURE 5.
Volume (A) and surface area (B) of MRI-defined tumor regions and hypoxic regions according to timing of imaging before operation, after resection and before radiation therapy, and after both operation and radiation therapy.
Correlates of Hypoxic Burden
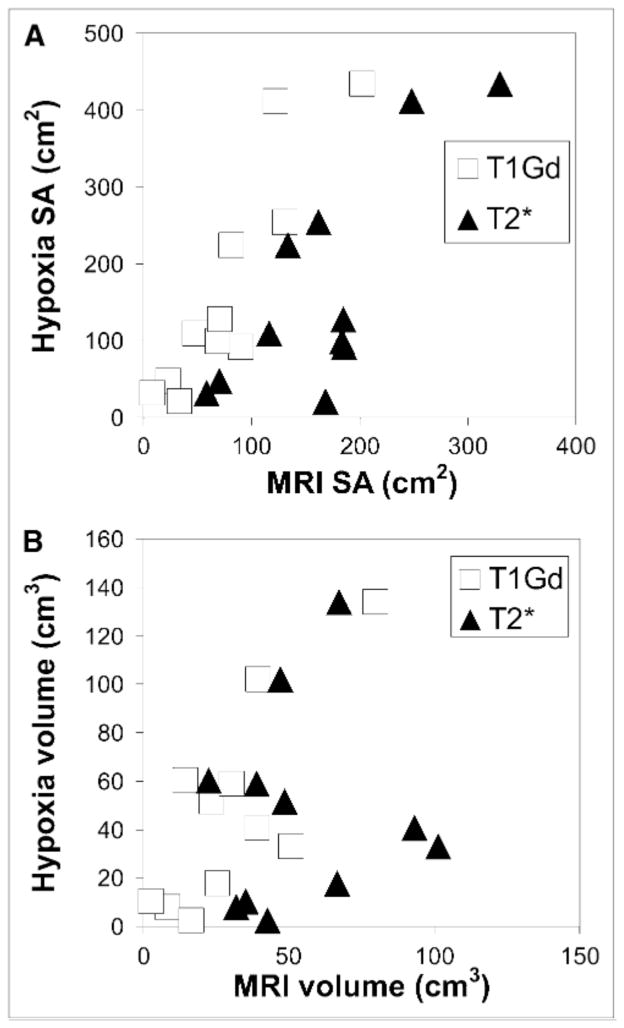
Figure 6A shows the linearity of the scatter of the HVsa relative to the MRI-defined tumor surface areas, and Figure 6B shows the quantitative relationship between the HV and the MRI-defined volumes. In this study, the HVsa is larger than the T1 surface area for all but 1 of the patients in the PreOp group (Fig. 6A). Consistent with the artificial removal of a variable portion of the tumor mass by treatment (e.g., resection), the correlation between the MRI volume (or surface area) and the HV (or HVsa) was lost after therapy.
FIGURE 6.
Scatter plots of HVsa vs. MRI-defined tumor surface areas (A) and of HV vs. MRI-defined tumor volumes (B) for PreOp patients only.
Table 2 summarizes the statistical significance of any associations between the hypoxic burden (volume, surface area, or T/Bmax) with the MRI-defined tumor burden (volume or surface area).
TABLE 2.
Correlations of 18F-FMISO–Associated Measures of Hypoxic Burden with MRI-Defined Regional Volumes and Surface Areas for PreOp Group (n = 11)
| Association between… | P | R2 |
|---|---|---|
| HV vs. MRI-defined volumes | ||
| T1Gd | 0.006 | 0.58 |
| T2* | 0.79 | 0.01 |
|
| ||
| HVsa vs. MRI-defined surface areas | ||
| T1Gd | 0.0002 | 0.81 |
| T2* | 0.005 | 0.61 |
|
| ||
| T/Bmax vs. MRI-defined volumes | ||
| T1Gd | 0.31 | 0.12 |
| T2* | 0.95 | 0.00 |
|
| ||
| T/Bmax vs. MRI-defined surface areas | ||
| T1Gd | 0.06 | 0.34 |
| T2* | 0.12 | 0.25 |
HV
There was a significant correlation between the HV and the T1Gd tumor volume in both the PreOp (P < 0.007) and the PostXRT (P < 0.05) groups (Fig. 6B). However, significance was lost when removing the largest volume tumor, suggesting the result is dominated by an outlier. To consider the relative contribution of each of the MRI-defined volumes to the HV, a multivariate linear regression was performed. The gadolinium-enhanced T1 volume (T1Gdvol) did not show a significant positive correlation with HV in this multivariate regression in any of the groups.
HVsa
There was a significant correlation between the HVsa and each of the surface areas of the T1Gd- and T2*-defined tumor volumes in the PreOp (P < 0.01) and PostXRT (P < 0.02) groups. A multivariate linear regression was performed to determine the relative contribution of each of the MRI-defined surface areas to the HVsa. The T1 surface area showed a significant positive correlation with HVsa in this multivariate regression in the PreOp group (P < 0.03, multiple R2 = 0.84) but not in either of the other groups.
T/Bmax
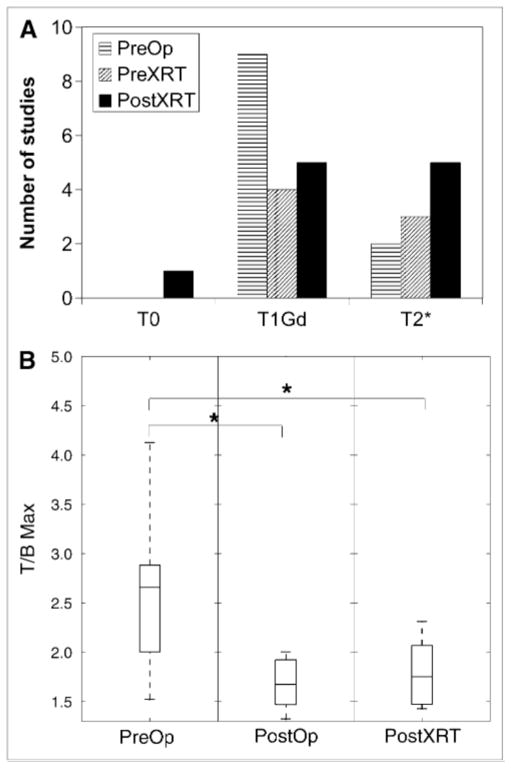
Figure 7A illustrates that the T/Bmax (within the T2-defined tumor region) was generally found in the T1Gd region before the operation but tended toward the periphery (T2*) of the tumor after both operation and radiation therapy. The T/Bmax (in 1 study) that was located in the T0 region resulted from the relatively small size of this tumor region relative to HV and probably represents a partial-volume effect. Figure 7B shows that the T/Bmax decreased with treatment (Mann–Whitney U test, P < 0.002 between PreOp and PostOp studies and P = 0.0004 between PreOp and PostXRT studies), consistent with treatment targeting the hypoxic T1Gd region. In the PreOp studies (Table 2), no significant associations were found between the T/Bmax and any MRI-defined volumes or surface areas. In the PostXRT studies, T/Bmax correlated with all MRI-defined surface areas but only weakly with T1Gd volumes; however, the correlations did not persist in the multivariate regression in any group.
FIGURE 7.
(A) Location of T/Bmax voxel within MRI-defined regions. (B) Value of T/Bmax as function of timing of imaging. Asterisks indicate significant difference between groups as tested by Mann–Whitney U test (P < 0.002 between PreOp and PostOp and P = 0.0004 between PreOp and PostXRT studies).
Concordance of HV with MRI-Defined Tumor Regions
We measured concordance to determine the spatial correlation of hypoxia relative to the MRI-defined abnormalities. 18F-FMISO concordance was defined as the percentage of the HV that was within an MRI-defined tumor region. For example, the 18F-FMISO concordance with the T1Gd region is the volume of the intersection of the HV with the T1Gd regions divided by the total HV and reported as a percentage.
Figure 4 summarizes the 18F-FMISO concordances separated according to the time point of the imaging observation relative to treatments. The median is shown within the box plot, with the edges of each box showing the 25th and 75th percentiles of the data and the whiskers showing the range of the data. Concordances were highly variable. Preoperatively, on average approximately 30% of the HV lies within the T1Gd region and another 30% lies in the T2* region. The concordance tends to decrease with resection, which is consistent with the results of the operation targeting removal of the MRI-defined region. There is negligible 18F-FMISO concordance with the T0 regions, perhaps dominated by partial-volume effects associated with the different spatial resolutions of the 2 imaging techniques. No statistically significant difference between the 18F-FMISO concordances in T1Gd or T2* regions is demonstrated (Fig. 4).
Survival Analysis
Table 3 shows the results of a univariate Cox proportional hazard survival analysis of our PreOp group and includes log-rank P values, hazard ratios for significant factors, and the associated increase in the covariate that the univariate analysis suggests would be associated with a 50% decrease in survival. In the PreOp group, HV and HVsa were significant predictors of survival (P < 0.05), but this correlation was lost in the PostOp and PostXRT groups (results not shown). The MRI-based surface area measurements (excluding the necrotic T0) were significant only in the PreOp patient group. With the exception of age (P < 0.04) in the PostXRT group, none of the standard clinical predictors (e.g., age, Karnofsky performance score, and extent of resection) was prognostically significant in each patient group in this small study. A multivariate analysis combining HV or HVsa or T/Bmax with any of the MRI-defined volumes or surface areas did not reveal an improved model fit of survival; however, because of the small numbers of patients in this study, performing such an analysis is probably not appropriate.
TABLE 3.
Log-Rank P Values Resulting from Univariate Cox Survival Analysis of Variables in PreOp Group (n = 11)
| Variable | P | Hazard coefficients for significant P values* | Increase associated with 50% decrease in survival† |
|---|---|---|---|
| Volume | |||
| HV | 0.005 | 0.025 (0.011) | 16 cm3 (11–29 cm3) |
| T1Gd | 0.12 | ||
| T2* | 0.27 | — | |
|
| |||
| Surface area | — | ||
| HV | 0.002 | 0.009 (0.004) | 45 cm2 (31–81 cm2) |
| T1Gd | 0.03 | 0.014 (0.007) | 29 cm2 (19–58 cm2) |
| T2* | 0.17 | — | |
|
| |||
| 18F-FMISO | |||
| T/Bmax | 0.002 | 2.47 (0.98) | 0.16 (0.12–0.27) |
|
| |||
| Clinical | |||
| Age | 0.37 | — | |
| Karnofsky performance score | 0.66 | — | |
| Extent of resection | 0.3 | — | |
Data in parentheses are SEs.
Data in parentheses are 95% confidence intervals.
DISCUSSION
We performed a detailed spatial analysis of the hypoxic tumor burden visible on the 18F-FMISO image relative to the imaging changes associated with tumor neovasculature, necrosis, invasion, and edema seen on the MRI scans. Figures 2–4 and 7 show that hypoxia lies predominantly at the junction between the T1Gd and T2* regions of MRI abnormalities, but as much as 20%–30% lies outside T1Gd in the PreOp and PostOp groups (Fig. 4). These observations suggest a role for hypoxia in driving the invasion at the tumor periphery, but further study is necessary to test this interpretation.
Because one consequence of hypoxia is to induce the angiogenic cascade, sites of current hypoxia may be sites of future vascular-rich contrast enhancement (T1Gd). Our analysis of tumor-region surface areas appears to support this general hypothesis. Interestingly, although there is a modest correlation between the HV and the MRI-defined volumes consistent with the findings of Spence et al. (17), and thus correlation is dominated by 1 large outlier (Fig. 6B; Table 2), there is a much more striking correlation between the HVsa and the MRI-defined surface areas (Fig. 6A; Table 2). The observed strong association between the MRI-defined surface areas and the HVsa (Fig. 6A; Table 2) hints at a spatial connection between the surface area of MRI-defined abnormalities, especially T1Gd, and the resultant annular HV. If one visualizes MRI-visible glioblastoma growth as a set of nested shells of tumor growth led by diffuse tumor cell invasion (T2*) and proliferation that results in local hypoxia, which in turn stimulates (among other things) neoangiogenesis (T1Gd) and necrosis (T0), then it is plausible to expect a correlation between the T0, T1Gd, and T2* surface areas, as is the case in this study.
Despite the spatial relationship between the HV and the MRI-defined tumor regions, the lack of correlation between T/Bmax and the MRI-defined measurements in PreOp studies suggests that the magnitude of hypoxia may be independent of the size of the tumor. That is, although the location of hypoxia may be spatially relatable to the MRI-defined tumor regions, the magnitude of the signal representing hypoxia seen on 18F-FMISO does not appear to be dependent on the tumor size.
Volume-related correlations were dominated by an outlier. However, unlike the volumetric measurements, HVsa correlates quantitatively and spatially with the surface areas of all MRI abnormalities (T0, T1Gd, and T2*) in the PreOp studies. This finding further accentuates the relative spatial relationship we observed between hypoxia and MRI-defined tumor regions.
In considering measures of concordance, comparison of the MRI-defined regions with the HV is limited both by the differing spatial resolutions involved and by the need for image coregistration. Coregistration of the 18F-FMISO image to the MRI scan produces an interpolated 18F-FMISO image. Even if the actual HV and the imageable contrast-enhancing regions were perfectly aligned spatially, the differences in spatial resolution generate a disparity. We assume that these limitations result in differences that are smaller than the effect we are measuring, and because it would be consistent across patient studies within each patient group (e.g., PreOp) the effect of this disparity may be diminished. Overall, the 18F-FMISO concordance indicates that hypoxia extends beyond the imageable T1Gd abnormality and suggests a role for 18F-FMISO in defining range target volumes for radiotherapy.
Although larger GBMs generally had more hypoxia (HV or HVsa), in this study the T/Bmax was quantitatively independent of the MRI-defined tumor size in the PreOp and PostOp groups. Further, this result, combined with previous results in head and neck cancer (21), sarcoma (22), and GBMs (17) that both HV and T/Bmax are prognostically significant, suggests distinctive roles for the 2 measures of hypoxia. In our PreOp group (in which the imaging abnormalities were not affected by either resection or radiotherapy), we not only found that HV and T/Bmax were significant prognostically but also noted that the surface areas of the HV and T1Gd regions were significant predictors of survival. This finding supports the possibility that surface area may be an alternative and meaningful measure of disease burden, particularly in the case in which the tumor regions measured do not approximate a sphere or other solid mass.
The observation that HV, HVsa, T1Gdvol, T1Gdsa, T2*vol, T2*sa, and T/Bmax were not significant predictors of survival in PostOp or PostXRT groups suggests that pretreatment hypoxic burden may reflect the overall aggressiveness of the tumor but can be altered by therapeutic interventions. Mathematical models quantitatively connecting tumor growth shown on an MRI scan with hypoxic burden demonstrated by a pretreatment 18F-FMISO image have shown that the most hypoxic tumors (PreOp) have the most aggressive tumor phenotype, quantified by high net rates of proliferation and invasion (23). If treatment (e.g., resection) removes a portion of an aggressive (hypoxic) tumor, the remaining tumor may still be aggressive. That is, the overall tumor aggressiveness is not necessarily decreased after removal of the hypoxic component of the lesion. Thus, care should be taken in comparing patients across treatment groups.
Our modest number of studies precluded any meaningful consideration of multivariate survival models to test for the additive effect of combing HV or HVsa or T/Bmax with MRI-defined tumor volumes or surface areas. Larger studies are necessary to expound on any complementary role of these 2 imaging modalities in terms of survival analyses.
CONCLUSION
This study delineates spatially and quantitatively the relationships between MRI-defined tumor burden and 18F-FMISO–defined hypoxic burden. Although there are some general associations between larger tumors and more hypoxic burden, these images (PreOp) are biologically linked through the angiogenic cascade. Our imaging results support the concept that local hypoxia (visible on the 18F-FMISO image) leads to the production of angiogenic factors and vasculature recruitment and growth at the peripheral edge of the T1Gd abnormality where it is adjacent to T2*. These results are consistent with the interpretation that local hypoxia induces an angiogenic response that later becomes visible on contrast-enhanced MRI. The 18F-FMISO concordance data fortify this interpretation because a substantial percentage of hypoxic tissue lies outside the T1Gd abnormality, which is currently not targeted for surgical or radiation treatment. The angiogenic cascade is further supported by the significant relationship between HVsa and the MRI-defined surface areas (Fig. 6). The results also show that surface area is a novel means of assessing hypoxic burden that is prognostically significant and is grounded in its biologic link to growth patterns. These results, coupled with the conclusions of other studies that indicate a relation of hypoxia to aggressive tumor phenotypes (23), can be used to develop mathematical models to further explore the role of hypoxia in tumor growth in vivo. Overall, these results suggest that information provided by MRI and 18F-FMISO imaging is complementary but distinct, and their relationship may be significantly affected by therapeutic interventions.
Acknowledgments
We gratefully acknowledge the support of the McDonnell Foundation and National Institutes of Health grant P01 CA042045-20 (principal investigator, Kenneth A. Krohn).
References
- 1.Swanson KR, Alvord EC, Jr, Murray JD. Virtual brain tumours (gliomas) enhance the reality of medical imaging and highlight inadequacies of current therapy. Br J Cancer. 2002;86:14–18. doi: 10.1038/sj.bjc.6600021. [DOI] [PMC free article] [PubMed] [Google Scholar]
- 2.Silbergeld DL, Rostomily RC, Alvord ECJ. The cause of death in patients with glioblastoma is multifactorial: clinical factors and autopsy findings in 117 cases of supratentorial glioblastoma in adults. J Neurooncol. 1991;10:179–185. doi: 10.1007/BF00146880. [DOI] [PubMed] [Google Scholar]
- 3.Rasey JS, Koh WJ, Evans ML, et al. Quantifying regional hypoxia in human tumors with positron emission tomography of [18F]fluoromisonidazole: a pretherapy study of 37 patients. Int J Radiat Oncol Biol Phys. 1996;36:417–428. doi: 10.1016/s0360-3016(96)00325-2. [DOI] [PubMed] [Google Scholar]
- 4.Valk PE, Mathis CA, Prados MD, Gilbert JC, Budinger TF. Hypoxia in human gliomas: demonstration by PET with fluorine-18-fluoromisonidazole. J Nucl Med. 1992;33:2133–2137. [PubMed] [Google Scholar]
- 5.Brasch R, Pham C, Shames D, et al. Assessing tumor angiogenesis using macromolecular MR imaging contrast media. J Magn Reson Imaging. 1997;7:68–74. doi: 10.1002/jmri.1880070110. [DOI] [PubMed] [Google Scholar]
- 6.Cao Y, Nagesh V, Hamstra D, et al. The extent and severity of vasculature leakage as evidence of tumor aggressiveness in high-grade gliomas. Cancer Res. 2006;66:8912–8917. doi: 10.1158/0008-5472.CAN-05-4328. [DOI] [PubMed] [Google Scholar]
- 7.Rajendran JG, Mankoff DA, O’Sullivan F, et al. Hypoxia and glucose metabolism in malignant tumors: evaluation by [18F]fluoromisonidazole and [18F]fluorodeoxyglucose positron emission tomography imaging. Clin Cancer Res. 2004;10:2245–2252. doi: 10.1158/1078-0432.ccr-0688-3. [DOI] [PubMed] [Google Scholar]
- 8.Rajendran JG, Hendrickson KR, Spence AM, Muzi M, Krohn KA, Mankoff DA. Hypoxia imaging-directed radiation treatment planning. Eur J Nucl Med Mol Imaging. 2006;33(suppl 13):S44–S53. doi: 10.1007/s00259-006-0135-1. [DOI] [PubMed] [Google Scholar]
- 9.Rasey JS, Nelson NJ, Chin L, Evans ML, Grunbaum Z. Characteristics of the binding of labeled fluoromisonidazole in cells in vitro. Radiat Res. 1990;122:301–308. [PubMed] [Google Scholar]
- 10.Tochon-Danguy HJ, Sachinidis JI, Chan F, et al. Imaging and quantitation of the hypoxic cell fraction of viable tumor in an animal model of intracerebral high grade glioma using [18F]fluoromisonidazole (FMISO) Nucl Med Biol. 2002;29:191–197. doi: 10.1016/s0969-8051(01)00298-0. [DOI] [PubMed] [Google Scholar]
- 11.Dunn IF, Heese O, Black PM. Growth factors in glioma angiogenesis: FGFs, PDGF, EGF, and TGFs. J Neurooncol. 2000;50:121–137. doi: 10.1023/a:1006436624862. [DOI] [PubMed] [Google Scholar]
- 12.Fischer I, Gagner JP, Law M, Newcomb EW, Zagzag D. Angiogenesis in gliomas: biology and molecular pathophysiology. Brain Pathol. 2005;15:297–310. doi: 10.1111/j.1750-3639.2005.tb00115.x. [DOI] [PMC free article] [PubMed] [Google Scholar]
- 13.Slomiany MG, Rosenzweig SA. Hypoxia-inducible factor-1-dependent and -independent regulation of insulin-like growth factor-1-stimulated vascular endothelial growth factor secretion. J Pharmacol Exp Ther. 2006;318:666–675. doi: 10.1124/jpet.106.104158. [DOI] [PubMed] [Google Scholar]
- 14.Semenza GL. Targeting HIF-1 for cancer therapy. Nat Rev Cancer. 2003;3:721–732. doi: 10.1038/nrc1187. [DOI] [PubMed] [Google Scholar]
- 15.Neufeld G, Cohen T, Gengrinovitch S, Poltorak Z. Vascular endothelial growth factor (VEGF) and its receptors. FASEB J. 1999;13:9–22. [PubMed] [Google Scholar]
- 16.Hall E. Radiobiology for the Radiologist. 4. Philadelphia, PA: JB Lippincott Company; 1994. [Google Scholar]
- 17.Spence AM, Muzi M, Swanson KR, et al. Regional hypoxia in glioblastoma multiforme quantified with [18F]fluoromisonidazole positron emission tomography before radiotherapy: correlation with time to progression and survival. Clin Cancer Res. 2008;14:2623–2630. doi: 10.1158/1078-0432.CCR-07-4995. [DOI] [PMC free article] [PubMed] [Google Scholar]
- 18.Lewellen TK, Kohlmyer SG, Miyaoka RS, Kaplan MS, Stearns CW, Schubert SF. Investigation of the performance of the General Electric ADVANCE positron emission tomograph in 3D mode. IEEE Trans Nucl Sci. 1996;43:2199–2206. [Google Scholar]
- 19.Lim JL, Berridge MS. An efficient radiosynthesis of [18F]fluoromisonidazole. Appl Radiat Isot. 1993;44:1085–1091. doi: 10.1016/0969-8043(93)90110-v. [DOI] [PubMed] [Google Scholar]
- 20.Kalbfleisch JG. Probability and Statistical Inference II. New York, NY: Springer Verlag; 1980. [Google Scholar]
- 21.Rajendran JG, Schwartz DL, O’Sullivan J, et al. Tumor hypoxia imaging with [F-18] fluoromisonidazole positron emission tomography in head and neck cancer. Clin Cancer Res. 2006;12:5435–5441. doi: 10.1158/1078-0432.CCR-05-1773. [DOI] [PMC free article] [PubMed] [Google Scholar]
- 22.Nordsmark M, Overgaard M, Overgaard J. Pretreatment oxygenation predicts radiation response in advanced squamous cell carcinoma of the head and neck. Radiother Oncol. 1996;41:31–39. doi: 10.1016/s0167-8140(96)91811-3. [DOI] [PubMed] [Google Scholar]
- 23.Swanson KR, Chakraborty G, Rockne R, et al. A mathematical model for glioma growth and invasion links biological aggressiveness assessed by MRI with hypoxia assessed by FMISO-PET [abstract] J Nucl Med. 2007;48(suppl 2):151P. [Google Scholar]


