

Abstract
It has been demonstrated that Tau exists on the microtubule lattice in both diffusing and static populations, but how this may relate to Tau function is currently unclear. Tau isoforms are developmentally regulated and have been shown to have disparate effects on microtubule polymerization, the ability to bind microtubules, and the ability to inhibit kinesin. It has also been shown that Tau is sensitive to microtubule stabilizing agents and the ability to affect the persistence length of microtubules and to inhibit kinesin can be altered by stabilizing microtubules with various nucleotide analogs. Given these observations, it is likely the behavior of Tau is dictated by both the isoform of Tau and by structural changes in the microtubule lattice. In the present study, we use single molecule imaging to examine the behavior of the three-repeat short (3RS) isoform and the four-repeat long (4RL) isoform on different microtubule tracks stabilized with either paclitaxel or guanylyl-(α, β)-methylene-diphosphate (GMPCPP). On paclitaxel-stabilized microtubules, we find 3RS-Tau favors the static conformation and forms complexes consisting of 2–3 molecules, while 4RL-Tau predominantly exists as a single molecule equally distributed between the static and diffusing populations. However, on GMPCPP-stabilized microtubules both isoforms favor the diffusing conformation and do not form static complexes composed of more than one Tau molecule. We find both isoforms of Tau interconvert between static and diffusing populations on the microtubule surface, and the equilibrium between these two states depends on both the isoform of Tau and the structure of the underlying microtubule lattice.
Keywords: Tau, microtubule, cytoskeleton, neuron, kinesin, nucleotide
Introduction
The microtubule associated protein (MAP) Tau is a neuronal specific protein belonging to the Tau/MAP2/ MAP4 family of MAPs and, in humans, there are six known isoforms which are alternatively spliced from a single gene located on chromosome 17 [Avila et al., 2004]. Isoforms differ by the absence or presence of one or two acidic inserts in the N-terminal portion of the molecule and three or four microtubule binding repeats in the C-terminal region [Goode et al., 2000; Avila et al., 2004]. Tau is intimately involved in the regulation of microtubule dynamics and plays a major role in the development of the nervous system, therefore it is not surprising that changes in Tau expression and/or regulation have been linked to numerous physiological responses and neurodegenerative disorders such as Alzheimer’s disease (AD) [Goedert and Spillantini, 2001]. Although the regulation of microtubule dynamics appears to be a major functional aspect of Tau, evidence suggests Tau may also play other equally important roles which include the ability to regulate microtubule spacing [Chen et al., 1992; Frappier et al., 1994], involvement in multiple signaling pathways [Perez et al., 2009; Sultan et al., 2011; Li et al., in press], and the regulation kinesin-mediated transport [Vershinin et al., 2007; Dixit et al., 2008; Stoothoff et al., 2009]. The sheer diversity of Tau functions within the cell indicates it is a versatile molecule, but how a single protein performs such distinct roles remains unclear.
The diversity of Tau functions are likely to be related, at least in part, to the different isoforms of Tau. How differences in Tau sequence among different isoforms relates to differences in Tau behavior and function is currently unclear. Because they represent the extreme ends of the Tau isoform spectrum, much attention has been paid to two specific isoforms of Tau—three-repeat short (3RS) vs. four repeat long (4RL) Tau, which differ in the presence or absence of the second microtubule binding repeat and by having either two (4RL) or zero (3RS) acidic inserts on the N-terminal end of the protein. Not only do these two Tau isoforms differ in their affinity for microtubules and their ability to initiate polymerization and stabilize microtubules [Bunker et al., 2004], but they have been shown to also exhibit functional differences in their ability to regulate kinesin-mediated transport. The 3RS-Tau isoform is considerably more inhibitory than the 4RL-Tau isoform in in vitro motility assays [Vershinin et al., 2007; Dixit et al., 2008]. It has also been shown that overexpression of both 3RS- and 4RL-Tau in primary mouse cortical neurons reduces the amount of mitochondria that localize to the axon, but interestingly the overexpression of the 4RL-Tau had a larger effect than 3RS-Tau in neuronal cell culture [Stoothoff et al., 2009]. The differences between Tau isoforms are known to be important in normal neuronal function as disruptions in the normal balance between the 3R- and 4R-isoforms is known to lead to certain types of dementia including FTDP-17 and Picks disease [Utton et al., 2001; Panda et al., 2003], but the underlying mechanisms remain unclear.
It was recently demonstrated that 4RL-Tau can exist in two different states on the microtubule (MT) surface, a diffusive state and a static state, and the diffusing population is sensitive to pH, ionic strength, and subtilisin treatment, but the physiological relevance of this is not well understood [Hinrichs et al., 2012]. Given that Tau appears to have isoform specific functions and the recent finding that lattice structure can affect Tau function [McVicker et al., 2011], we hypothesize both the Tau isoform and the underlying microtubule lattice structure can influence the dynamic behavior of Tau on the microtubule surface, and differences in such behavior could account for functional differences observed between 3RS- and 4RL-Tau isoforms in the current body of literature. To directly test this hypothesis, we used a single molecule approach to observe the diffusive behavior of 3RS- and 4RL-Tau isoforms on microtubules stabilized with either paclitaxel or GMPCPP. Our results demonstrate that the dynamic behavior of Tau on the microtubule surface is modulated by both the isoforms of Tau and the microtubule lattice, with 3RS-Tau consisting of mostly static long lasting multi-Tau complexes on paclitaxel-stabilized microtubules, while 4RL-Tau exists predominantly as a single molecule which has an equal propensity to either be diffusive or static. On GMPCPP-stabilized microtubules, both isoforms exist as primarily single diffusing molecules.
Results
On Paclitaxel-Stabilized Microtubules, 3RS-Tau and 4RL-Tau Exist in Both Static and Diffusive Populations With the 3RS-Isoform Favoring the Static State
Single molecule imaging was used to observe the behavior of Alexa 488-labeled 3RS-Tau and 4RL-Tau molecules on the surface of microtubules (Supporting Information Movies 1 and 2). It was determined that both Tau isoforms can exist in two distinct populations when interacting with paclitaxel-stabilized microtubules: a static state where Tau remains stationary on the microtubule lattice, and a dynamic state where Tau diffuses across the surface of the microtubule. Representative kymographs of Tau in both a static and diffusing state are shown in Figs. 1A and 1B, respectively. It was observed that these states were interchangeable, and Tau could interconvert between states (Figs. 1C and 1D). 3RS-Tau favored the static (62%) over diffusive (38%) state on paclitaxel-stabilized microtubules, while 4RL-Tau had an equal propensity to exist in either state as 51% were observed diffusing along the microtubule lattice and the remaining 49% were static (Table I). In addition to having a larger proportion of static events, the static 3RS-Tau molecules remained on the lattice longer than the static 4RL-Tau molecules. A representative dwell time histogram of static 3RS-Tau on paclitaxel-stabilized microtubules is shown in Fig. 2A. The characteristic dwell time for the 3RS-Tau static molecules (19.6 ± 2.60 s (Fig. 2B)) was statistically different (P<0.0001) from the characteristic dwell time of the static 4RL-Tau molecules (5.80 ± 0.58 s (Fig. 2B)). In contrast, the characteristic dwell times of the diffusing populations from either Tau isoform were indistinguishable (3.60 ± 0.35 s for 3RS-Tau and 3.87 ± 0.57 s for 4RL-Tau; P=0.80) (Fig. 2B). To determine if there was a concentration dependence on the behavior of Tau on the microtubule lattice, the experiments were repeated at an additional concentration of 300 nM unlabeled Tau. Under these conditions there were marked increases in the static population of both isoforms (77% for 3RS-Tau and 55% for 4RL-Tau); however, characteristic dwell times were unaffected (Fig. 2B). Previous work has demonstrated the electrostatic nature of these interactions, and has shown that ionic strength, pH, and subtilisin treatment all alter the behavior of Tau on the microtubule lattice [Hinrichs et al., 2012].
Fig. 1. Representative kymographs of static and diffusing Tau populations on paclitaxel-stabilized microtubules.
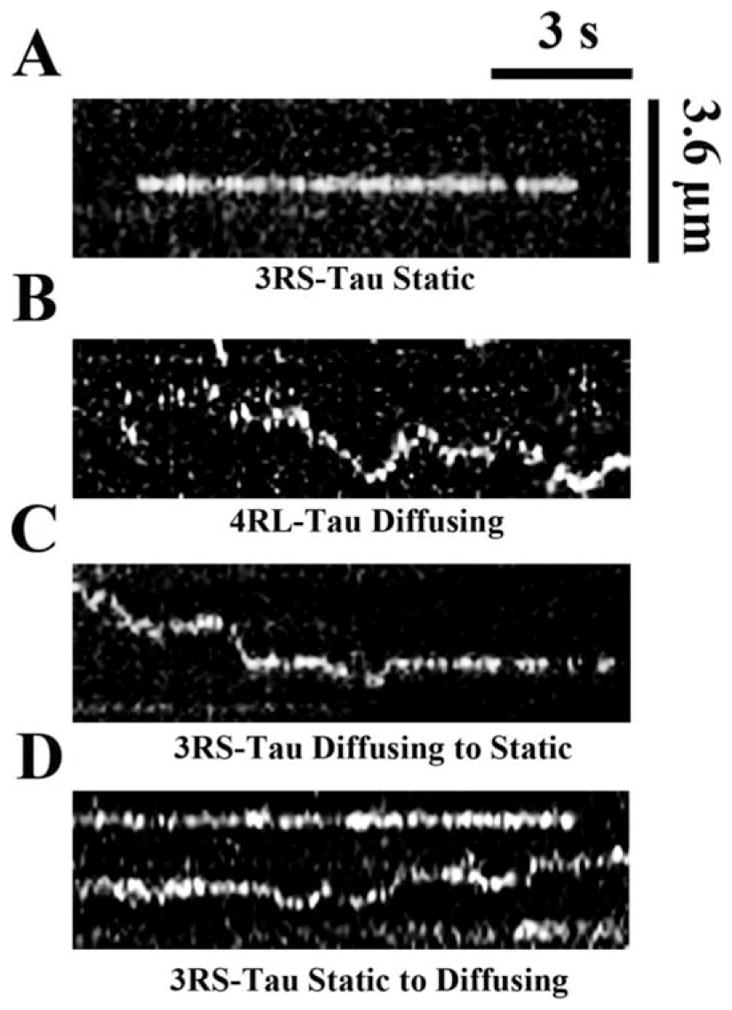
3RS-Tau (A, C, and D) and 4RL-Tau (B) were both present in static (A) and diffusive (B) populations on paclitaxel-stabilized (A–D) and GMPCPP-stabilized (data not shown) microtubules. In addition, Tau was observed to interconvert from diffusing to stationary states (C) and stationary to diffusing states (D) on the microtubule surface. The image size, brightness, and contrast have been adjusted for consistency and appearance.
Table I.
Fraction of Static Tau Molecules, Characteristic Dwell Times, and Diffusion Coefficients (D) of 3RS-Tau and 4RL-Tau on Paclitaxel-Stabilized and GMPCPP-Stabilized Microtubules
| Microtubule preparation | % Static | Dwell time
|
D (μm2/s) | |
|---|---|---|---|---|
| Static | Diffusing | |||
| Paclitaxel microtubules | ||||
| 0.5 nM 3RS-Tau | 62 | 19.6±2.60(272) | 3.60±0.35 (174) | 0.18±0.04 (90) |
| 300 nM 3RS-Taua | 78 | 21.6±5.22(349) | 4.39±0.51 (103) | 0.06±0.01 (75) |
| 0.5 nM 4RL-Tau | 49 | 5.80±0.58 (166) | 3.87±0.57 (169) | 0.12±0.02 (99) |
| 300 nM 4RL-Taua | 55 | 6.23±0.56 (128) | 3.78±0.79 (112) | 0.06±0.02 (72) |
| GMPCPP Microtubules | ||||
| 0.5 nM 3RS-Tau | 40 | 5.14±0.99 (123) | 4.30±0.60 (183) | 0.12±0.02 (92) |
| 300 nM 3RS-Taua | 39 | 6.81±1.49 (138) | 4.02±0.30 (216) | 0.07±0.01 (80) |
| 0.5 nM 4RL-Tau | 21 | 4.60±0.50 (80) | 6.65±2.38 (311) | 0.15±0.01 (92) |
| 300 nM 4RL-Taua | 24 | 4.89±0.72 (81) | 5.64±0.68 (262) | 0.06±0.01 (78) |
All dwell times have been corrected for photobleaching as described. Errors for dwell times are reported as standard error of the exponential decay function.
0.5 nM Alexa 488 Tau in the presence of 300 nM unlabeled Tau.
Fig. 2. Characteristic dwell times of static (S) and diffusing (D) 3RS-Tau and 4RL-Tau molecules on the microtubule surface.

A: A representative histogram of 3RS-Tau static dwell times (19.6 ± 2.60 s) on paclitaxel-stabilized microtubules. B: Characteristic dwell times of both static and diffusing Tau populations under all experimental conditions tested. Note the red asterisks (*) indicate a statistically significant difference in the characteristic dwell times of the static population of 3RS-Tau on paclitaxel-stabilized microtubules. Values were generated from a single exponential decay fit to histograms of the dwell times under each condition. Dwell times were corrected for photobleaching as described in the materials and methods. Errors are reported as standard error of the fitted function. [Color figure can be viewed in the online issue, which is available at wileyonlinelibrary.com.]
Tau diffusion was further characterized by calculating diffusion coefficients (D) on the surface of paclitaxel-stabilized microtubules, which were obtained by analyzing the trajectories of the diffusing populations using mean square displacement (MSD) (Supporting Information Fig. S1). A representative histogram of 3RS-Tau diffusion coefficients is shown in Fig. 3A. Both 3RS-Tau (0.18 ± 0.04 μm2·s−1) and 4RL-Tau (0.12 ± 0.02 μm2·s−1) had similar diffusion coefficients on paclitaxel-stabilized microtubules (Fig. 3B and Table I). Increasing the Tau concentration by adding 300 nM unlabeled Tau resulted in a decrease in the diffusion coefficients of both the 3RS-Tau (0.06 ± 0.01 μm2·s−1) and 4RL-Tau (0.06 ± 0.01 μm2·s−1) isoforms.
Fig. 3. Diffusion coefficients of 3RS-Tau and 4RL-Tau on the microtubule surface.

A: Representative histogram of the diffusion coefficient (0.18 ± 0.04 μm2/s) for 3RS-Tau on paclitaxel-stabilized microtubules. B: Diffusion coefficients of all experimental conditions tested. Note red asterisks (*) indicate a significant difference in the diffusion coefficient values at a total Tau concentration of 300 nM on either microtubule preparation. Values were generated from a single exponential decay fit to histograms of the diffusion coefficients under each condition. Errors are reported as standard error of the fitted function. [Color figure can be viewed in the online issue, which is available at wileyonlinelibrary.com.]
On GMPCPP-Stabilized Microtubules, 3RS-Tau and 4RL-Tau Exist in Static and Diffusing Populations With Both Isoforms Favoring the Diffusive State
Previously, we have reported that Tau loses its ability to inhibit kinesin motility on GMPCPP-stabilized microtubules and predicted the behavior of Tau on these microtubules would be distinguishable from those stabilized with paclitaxel [McVicker et al., 2011]. As with paclitaxel-stabilized microtubules, we observed both diffusive and static Tau populations (Supporting Information Movies 3 and 4); however on GMPCPP-stabilized microtubules, both isoforms favored the diffusive state. 3RS-Tau had a marked increase in the fraction of diffusing molecules (60%) as compared to that observed on paclitaxel-stabilized microtubules (38%) (Table I). 4RL-Tau also demonstrated a dramatic shift with 79% of observed molecules diffusing on GMPCPP-stabilized microtubules compared to 51% on paclitaxel-stabilized microtubules (Table I). Characteristic dwell times for the 4RL-Tau static (4.60 ± 0.50 s) and diffusing (6.65 ± 2.38 s) populations remained consistent with those seen on paclitaxel-stabilized microtubules (Fig. 2B). In addition, diffusion coefficients (0.15 ± 0.01 μm2·s−1) were similar with those seen for 4RL-Tau on paclitaxel-stabilized microtubules (Fig. 3B and Table I). Interestingly, the 3RS-Tau isoform demonstrated a reduced characteristic dwell time of 5.14 ± 0.99 s (Fig. 2B) for the static population on GMPCPP-stabilized microtubules as compared to paclitaxel-stabilized microtubules (19.6 ± 2.60 s), but had similar characteristic dwell times for the diffusing population (4.30 ± 0.60 s) (Fig. 2B) on either microtubule preparation. Characteristic dwell times for both static and diffusing populations of 3RS-Tau and 4RL-Tau were indistinguishable (P>0.2) on either microtubule preparation, save for the approximately 41% decrease in dwell time seen for 3RS-Tau on GMPCPP-stabilized microtubules as compared to paclitaxel-stabilized microtubules (P<0.001). As with the 4RL-Tau isoform, 3RS-Tau had a similar diffusion coefficient on GMPCPP-stabilized microtubules (0.12 ± 0.02 μm2·s−1) as observed on paclitaxel-stabilized microtubules (Fig. 3B and Table I).
At an increased Tau concentration (with 300 nM unlabeled Tau) on GMPCPP-stabilized microtubules we did not observe a shift in the static and diffusing populations as was seen in the paclitaxel case; both the fraction of static molecules and characteristic dwell times remained consistent with the values observed at the lower 0.5 nM concentration of Tau (Fig. 2B). As with paclitaxel-stabilized microtubules, a marked decrease in the diffusion coefficient was observed with increased Tau concentration (0.07 ± 0.01 μm2·s−1for 3RS-Tau and 0.06 ± 0.01 μm2·s−1 for 4RL-Tau) (Fig. 3B and Table I). To ensure our dwell time analysis was not confounded by photobleaching, we measured the rate of photobleaching for Alexa 488- fluorophores conjugated to a monomeric kinesin construct containing a single surface exposed cysteine. In the apo (nucleotide-free) state, this construct remained bound to microtubules and the on/off kinetics were not a significant factor as they would have been using our labeled Tau constructs [Moyer et al., 1998]. The characteristic photobleaching rate of the Alexa-488 fluorophore under our experimental conditions was 21.0 ± 2.1 s (Supporting Information Fig. S5C), and all dwell time values were corrected using this bleaching rate. The percentage of diffusing and static Tau molecules for all experimental conditions is summarized in Table I. Dwell time histograms of all 3RS-Tau and 4RL-Tau data are shown in Supporting Information Figs. S2 and S3, respectively. Histograms of the diffusion coefficients determined under all experimental conditions are shown in Supporting Information Fig. S4.
Tau Forms Complexes, Consisting of Multiple Molecules, on Paclitaxel-Stabilized Microtubules, But Binds as a Single Molecule on GMPCPP-Stabilized Microtubules
To investigate the distribution of Tau on a given microtubule lattice, we measured the brightness of both diffusing and static 3RS- and 4RL-Tau molecules on paclitaxel-stabilized and GMPCPP-stabilized microtubules. Because the 4RL-Tau isoform contains two cysteine residues (located in the second and third binding repeat regions, R2 and R3) and the 3RS-Tau isoform contains a single cysteine (located in the third binding repeat region R3), we used the single point mutation to replace the second binding repeat cysteine in the 4RL-Tau with an isoleucine (C291I) making the 3RS- and 4RL-Tau isoforms equivalent regarding the number and location of cysteines. All brightness measurements were measured at a final concentration of either 0.5 nM or 5.0 nM Tau. We found that at 5.0 nM Tau we were able to distinguish single molecules at any given frame, but because of crowding on the lattice and the diffraction limit of Tau spots, we were unable to track single molecules over a period of time, and could not calculate diffusion coefficients or dwell times at this concentration. To compensate for inconsistencies in brightness across multiple experimental conditions, all fluorescence intensity measurements were normalized by dividing the measured fluorescence intensity values by the average intensity of a single Alexa 488- fluorophore. Based on the fluorescence intensity analysis of Alexa 488-conjugated monomeric kinesin (Supporting Information Fig. S5D), which does not dimerize or bind as complexes on the microtubule [Skiniotis et al., 2004], it was determined that the diffusing Tau molecules consisted of a single population with a brightness consistent with that of a single Alexa 488 fluorophore. Data sets were divided by the average fluorescence intensity of the diffusing population within a given data set which produced a histogram where single fluorophores were centered at 1.00, consistent with the brightness analysis of the Alexa 488-conjugated kinesin (Supporting Information Fig. S5D).
The normalized fluorescence intensity of diffusing populations for both Tau isoforms on paclitaxel-stabilized and GMPCPP-stabilized microtubules at 0.5 nM and 5.0 nM total Tau were best fit by a single Gaussian distribution centered between 0.93 and 1.01 (Figs. 4A–4H) and were statistically indistinguishable from one another (P>0.31), suggesting they consist of one singly labeled Tau molecule. On paclitaxel-stabilized microtubules, however, both the 3RS-Tau and 4RL-Tau static populations deviated from this trend. At 0.5 nM Tau, the intensity distributions of the 4RL-Tau static population were best fit by the sum of two Gaussians, centered at 1.10 ± 0.27 and 1.70 ± 0.23 (Fig. 4E), and were statistically different from the diffusing population (P<0.001). The peak centered at 1.10 was consistent with our observations of a single fluorophore, and the second peak centered at 1.70 presumably corresponds to two Alexa 488-dyes, suggesting two 4RL-Tau molecules were present in that particular subset of static events. Based on the amplitude data, the static population consisting of a single Tau molecule was 74%, and the static population consisting of two Tau molecules constituted 26%, of the entire population. At 5.0 nM 4RL-Tau, we observed a modest shift of these populations and the distributions were centered at 0.98 ± 0.24 (69%) and 1.71 ± 0.22 (31%) (Fig. 4F). At 0.5 nM, the 3RS-Tau static population distribution was fit by the sum of three Gaussians with the first population fixed at 1.00 ± 0.19 corresponding to the distribution of single Alexa 488-fluorophores, and the second and third populations were centered at 1.84 ± 0.47, and 2.84 ± 0.15 (Fig. 4A). As seen with 4RL-Tau, the populations centered at 1.0 and 1.8 corresponded to one and two Tau molecules. However, unlike the 4RL-Tau isoform, 3RS-Tau had a subpopulation centered at 2.84, presumably arising from a complex of three Tau molecules. In accordance with this brightness analysis, a subset of 3RS-Tau complexes were seen to undergo three distinct bleaching steps indicating at least three fluorophores were present (Supporting Information Fig. S5A). The subpopulation consisting of two Tau molecules constituted the majority of the entire population (59%), while the subpopulations consisting of one and three Tau molecules comprised only 15% and 26% of the entire population, respectively. At 5.0 nM, the 3RS-Tau static population representing single molecules completely disappeared, and the distribution was best fit by the sum of two Gaussians with peaks centered at 1.64 ± 0.39 (70%) and 2.63 ± 0.28 (30%) (Fig. 4B). Individual diffusing Tau molecules were observed to merge with stationary Tau molecules (Supporting Information Movie 5) to form a larger static complex, as evidenced by a doubling of the observed fluorescence intensity upon complex formation (Fig. S5B). On GMPCPP-stabilized microtubules at 0.5 nM or 5.0 nM Tau, this behavior was not seen and the static populations of both the 3RS- and 4RL-Tau, which were centered at 1.06 ± 0.32 and 1.03 ± 0.32 (0.5 nM) and 1.07 ± 0.27 and 0.99 ± 0.25 (5.0 nM), respectively, appeared to be single molecules (Figs. 4C, 4D, 4G, and 4H). These data suggest the static Tau on GMPCPP-stabilized microtubules exists as a single molecule and does not form larger complexes as seen with paclitaxel-stabilized microtubules. All of the brightness data are summarized in Table II.
Fig. 4. Brightness analysis of 3RS-Tau and 4RL-Tau.

The normalized fluorescence intensity of static (purple) and diffusing (green) Alexa 488-labeled 3RS-Tau and 4RL-Tau was measured on paclitaxel-stabilized microtubules at 0.5 nM and 5.0 nM (A, B, E, and F), and GMPCPP-stabilized microtubules (C, D, G, and H), respectively. The mean normalized fluorescence intensity was determined by fitting the data to Gaussian frequency distributions (0.1 normalized fluorescence bins) ± S.D. The diffusing populations of either Tau isoform on either microtubule preparation were consistent with single molecules as compared to a kinesin control (Supporting Information Fig. S5D). On paclitaxel-stabilized microtubules, 3RS-Tau exhibited static events whose brightness was consistent with 1–3 Tau molecules, while the 4RL-Tau isoform formed static events consistent with 1–2 Tau molecules. However, static events from both isoforms consisted solely of brightness values consistent with single molecules on GMPCPP-stabilized microtubules. Errors are reported as standard deviations of the mean.
Table II.
Brightness Analysis of 3RS-Tau and 4RL-Tau Static and Diffusing Populations
| Microtubule preparation | Brightness (mean)
|
|||
|---|---|---|---|---|
| 0.5 nM | 5.0 nM | |||
| Paclitaxel Microtubules | Static | Diffusing | Static | Diffusing |
| 3RS-Tau | 1.00±0.19 (15%) | 0.94±0.26 | – | 0.94±0.29 |
| 1.84±0.47 (59%) | – | 1.64±0.39 (70%) | – | |
| 2.82±0.15 (26%) | – | 2.63±0.28 (30%) | – | |
| 4RL-Tau | 1.10±0.25 (74%) | 0.97±0.22 | 0.98±0.24 (69%) | 0.96±0.27 |
| 1.70±0.23 (26%) | – | 1.71±0.22 (31%) | – | |
| GMPCPP microtubules | ||||
| 3RS-Tau | 1.06±0.32 | 1.01±0.27 | 1.07±0.27 | 0.97±0.25 |
| 4RL-Tau | 1.03±0.32 | 0.96±0.29 | 0.99±0.25 | 0.93±0.18 |
The percent of each static population is shown in parenthesis next to the mean brightness for each experimental condition. All errors are reported as standard deviation of the mean.
Discussion
The dynamic behavior of Tau on the microtubule lattice observed in this work is consistent with previous reports demonstrating similar dwell times in vivo [Konzack et al., 2007] and diffusion coefficients in vitro [Hinrichs et al., 2012]. Interestingly, while both dwell time and the propensity of Tau to form complexes on the microtubule surface are dependent on differences in the specific isoform of Tau and microtubule lattice structure, there was no noticeable effect on the diffusion coefficient of Tau. This indicates that when Tau is in a conformation that allows for diffusion, the diffusion mechanism is independent of Tau isoform or lattice structure and is purely electrostatic in nature. This is also supported by previous work that demonstrates 4RL-Tau is sensitive to ionic strength, pH, and subtilisin treatment [Hinrichs et al., 2012]. However, like the equilibrium between static and diffusive states on the microtubule surface, diffusion coefficients were sensitive to the total concentration of Tau, decreasing by more than 50% as the concentration increased from 0.5 nM to 300 nM on both paclitaxel-stabilized and GMPCPP-stabilized microtubules. Although a previous study did not report a change in 4RL-Tau behavior at increased Tau concentrations, our total Tau concentration was 30 times that used in that work [Hinrichs et al., 2012], which may account for the discrepancy. We also see a concentration dependence on the ability of Tau to form complexes on the lattice. At 5.0 nM labeled Tau, we see an increase in the amount of 3RS- and 4RL-Tau that is present as complexes of two or three molecules on the lattice. Interestingly we don’t see a large increase in the dwell time of Tau at higher protein concentrations. This may be due to the fact that we never see complexes of more than two or three Tau molecules even when we increase the Tau concentration 10 fold from 0.5 nM to 5.0 nM total labeled Tau. Given Tau is known to bind microtubules through multiple weak interactions [Butner and Kirschner, 1991], the off-rate of Tau would strictly be determined by the number of binding sites. We see the vast majority of 4RL- or 3RS-Tau molecules existing as either single molecules or complexes of two Tau molecules, respectively. Therefore, we may not expect to see a large concentration dependence on dwell time as the number of sites interacting with the microtubule lattice does not seem to change with increasing Tau concentration.
3RS-Tau produces more numerous, longer lasting, and larger static complexes than 4RL-Tau on paclitaxel-stabilized microtubules. These results are consistent with findings from Dixit et al. who has used power spectrum analysis to demonstrate that Tau can form patches consisting of multiple molecules on paclitaxel-stabilized microtubules [Dixit et al., 2008]. These observations are also consistent with the same study, and others, which found that kinesin has a more difficult time passing patches of 3RS-Tau than 4RL-Tau [Dixit et al., 2008] and that 3RS-Tau is a more potent inhibitor of kinesin than 4RL-Tau [Vershinin et al., 2007; Dixit et al., 2008]. Our previous finding that Tau loses its ability to inhibit kinesin on GMPCPP-stabilized microtubules [McVicker et al., 2011] is also consistent with our current results, given that both Tau isoforms favor the diffusing state on this same microtubule preparation. At physiological concentrations, 3RS-Tau binds to microtubules stabilized with paclitaxel primarily in large, long lasting static complexes, which may disrupt kinesin mediated transport, while 4RL-Tau diffuses along the lattice and binds in smaller, short lived complexes, allowing kinesin transport to proceed unhindered at physiological levels. On GMPCPP-stabilized microtubules, both isoforms interact as primarily diffusing Tau molecules, allowing kinesin transport to proceed uninhibited. These effects are likely due specifically to changes induced in the lattice stabilized with GMPCPP, as in our previous study we demonstrate that microtubules stabilized by both GMPCPP and Taxol behave identically to microtubules stabilized with GMPCPP alone [McVicker et al., 2011].
Under our conditions Tau exhibits two distinct behaviors on the microtubule lattice: Transitioning between a diffusing and static state and forming complexes of 2–3 Tau molecules. Because we are comparing the 3RS isoform, which lacks both the second binding repeat and the N-terminal acidic inserts, and the 4RL isoform which contains both inserts and the second binding repeats, we cannot determine whether these effects are due to the acidic inserts or the microtubule binding domain. However, we chose these isoforms specifically so we could correlate their behavior with the known body of literature, which has focused on 3RS- and 4RL-Tau. It has previously been shown that, in solution, the C-terminus of Tau can interact with the microtubule binding domains and the acidic inserts in the N-terminus to form a folded conformation [Jeganathan et al., 2006]. Although a future study would be needed to determine the exact mechanism, it is possible that this folded Tau structure could diffuse along the microtubule and then unfold freeing the microtubule binding domain and allowing Tau to adopt a static structure on the microtubule lattice. It has also been proposed that the proline-rich region of Tau could bind directly to the microtubule, which could also contribute to Tau stability or complex formation [Kar et al., 2003b]. If this was the case, the isoform specific differences could be dependent on both the acidic inserts, which could regulate the ability of Tau to transition between diffusing and static states, and the microtubule binding domain and/or proline-rich region, which may be involved if forming Tau complexes on the microtubule.
Although Tau is an intrinsically disordered protein, there is fluorescence resonance energy transfer (FRET) data that demonstrates Tau possess a specific folded conformation in solution, and this conformation may be plastic [Jeganathan et al., 2006]. Because Tau has many potential phosphorylation sites, it is possible that access to these sites could also be dictated by Tau conformation. Kanaan et al. has demonstrated that Tau possess a phosphatase activating domain, which is exposed in certain pathological forms of Tau, indicating Tau conformation is an important regulator of function [Kanaan et al., 2011]. It has also been shown that pseudophosphorylation events at specific Tau residues can produce a combinatory effect, with certain phosphorylation events completely abolishing the ability of Tau to bind microtubules, but additional events actually enhancing Tau binding [Kiris et al., 2011]. These data strongly suggest that phosphorylation of Tau causes a conformational change in Tau itself leading to an alteration of Tau function. Our findings that these diffusive and static behaviors of Tau on the microtubule surface are isoform specific and can be altered by subtle changes to the microtubule architecture also indicates that Tau can form multiple conformations which exist in equilibrium and are sensitive to external factors.
Microtubule structure has also been shown to affect the function of the neuronal microtubule stabilizing protein doublecortin (DCX), which binds paclitaxel-stabilized, but not GMPCPP-stabilized, microtubules in a cooperative manner [Bechstedt and Brouhard, 2012]. The physiological ramifications of studies demonstrating the effects of GMPCPP on MAPs serve to demonstrate that MAPs are quite sensitive to alterations in lattice structure. Given that microtubules undergo numerous posttranslational modifications in cells, it is a reasonable expectation that MAPs would also be sensitive to these modifications. It has been shown that neurons contain some proportion of microtubules that are thought to be in the GTP-nucleotide state, and kinesin- 1 preferentially binds GMPCPP-stabilized microtubules [Nakata et al., 2011]. This is thought to occur from the β-tubulin C-terminal half of helix H4 pushed toward kinesin as well as helix H4 making longitudinal contact with the helix H11 of α-tubulin better positioning the kinesin binding site for the kinesin loop L11 [Yajima et al., 2012]. It has also been shown that neurons contain a proportion of microtubules that are polyaminated, which is believed to prevent GTP hydrolysis, thus locking microtubules in the GTP-state [Song et al., 2013]. Because GMPCPP is a GTP analog, studies using this reagent may have a more direct physiological relevance in neurons, which contain these microtubules. Although our group has focused on the agent used to stabilize microtubules, there may also be other factors, such as posttranslational modifications [Saragoni et al., 2000; Reed et al., 2006; Bulinski, 2007], nucleotide state [Nakata et al., 2011], and differences in protofilament number [Bechstedt and Brouhard, 2012] which all have been shown to alter the function of various MAPs and molecular motors. In the broader context, this work highlights additional levels of physiological complexity in the regulation of MAPs by demonstrating that the microtubule lattice may be an active player in the regulation of MAPs.
Materials and Methods
Protein Expression and Purification
The 4RL-Tau construct containing the single amino acid substitution, cysteine 291 to isoleucine (C291I), was created using the QuickChange® site-directed mutagenesis kit from Agilent Technologies (Santa Clara, CA). Wild-type 3RS-Tau and C291I-4RL-Tau proteins, each containing a single cysteine residue at equivalent positions in the second microtubule binding repeat (C233 and C322, respectively), were expressed in BL21-CodonPlus(DE3)-RP E. coli cells (Stratagene, La Jolla, CA) using the pET vector system (Novagen, Madison, WI), and purified as previously described [Kar et al., 2003a; McVicker et al., 2011]. Protein concentration was determined using the bicinchonic acid (BCA) assay (Pierce, Rockford, IL) using desalted lyophilized 3RS- or 4RL-Tau as standards. Samples were dialyzed against BRB80 (80 mM PIPES, 1 mM EGTA, 1 mM MgCl2, pH 6.9 at room temperature), frozen in liquid nitrogen, and stored at −80°C. Bovine brain was obtained from Vermont Livestock & Slaughter (Ferrisburgh, VT), and tubulin was purified using high molarity PIPES buffer (1M PIPES, pH 6.9 at room temperature, 10 mM MgCl, and 20 mM EGTA) as previously described [Castoldi and Popov, 2003]. Monomeric human kinesin (K349) [Naber et al., 2003] containing an N-terminal 6X histidine affinity tag, was expressed in BL21-CodonPlus(DE3)-RP E. coli cells (Stratagene, La Jolla, CA) using the isopropyl-thio-β-D-galactopyranoside-inducible pET vector system (Novagen, Madison, WI). Cells were lysed and protein was purified using HisPur™ Cobalt Resin (Pierce, Rockford, IL) as per manufacturer’s instructions. Protein identity and purity was evaluated using SDS-PAGE and dialyzed against ATPase Buffer (20 mM MOPS, pH 7.2 at room temperature, 5 mM Mg-Acetate, 50 mM K-acetate, 0.1 mM EGTA, 0.1 mM EDTA, and 1 mM DTT). Protein concentration was determined using the Bradford assay (Sigma-Aldrich, St. Louis, MO).
Fluorescent-Labeling of Tau
Tau protein was incubated with a 10-fold molar excess of Dithiothreitol (DTT) for 2 h at room temperature, and DTT was removed using a 2 ml 7K MWCO Zeba™ spin desalting column (Pierce, Rockford, IL). Tau was then incubated in a 10-fold molar excess of Alexa Fluor 488-C5 maleimide (Invitrogen Molecular Probes, Carlsbad, CA) for an additional 2 h at room temperature, and excess fluorophore was removed using a second desalting column. Labeling efficiency of Tau was determined by comparing the concentration of fluorophore to protein. Tau concentration was determined as described above, and dye concentration was determined using an extinction coefficient of 71,000 cm−1·M−1 at 495 nm (Alexa 488) in a NanoDrop® ND-1000 spectrophotometer (Thermo Scientific, Rockford, IL). Labeling efficiency was determined to be 79–85% for both Tau isoforms.
Microtubule Preparation
Purified bovine tubulin was thawed on ice, supplemented with 1 mM GTP or GMPCPP (Jena Bioscience, Jena, Germany) and mixed with rhodamine-labeled tubulin (Cytoskeleton Inc., Denver, CO) at a 1:10 labeled/unlabeled ratio. For paclitaxel-stabilized microtubules, tubulin was incubated at 37°C for 30 min followed by the stepwise addition of paclitaxel(Sigma-Aldrich, St. Louis, MO) to a final concentration of 20 μM. For GMPCPP-stabilized microtubules, small volumes of GMPCPP-tubulin were added stepwise (3–5 steps) and incubated for 20 min at 37°C between each addition. This process ensured long microtubules suitable for use in the single molecule imaging experiments.
Single Molecule TIRF Assay
Total internal reflection fluorescence (TIRF) microscopy was performed at 22°C using an inverted microscope (Eclipse Ti-U; Nikon) equipped with a 100× Plan Apo objective lens (1.49 NA) and auxiliary ×1.5 magnification. Alexa 488-labeled 3RS-Tau or 4RL-C291I Tau and rhodamine-labeled tubulin were excited with a 473-nm or 532-nm argon laser and imaged through emission filters (wavelength/band-pass) of 525/55 and 605/70, respectively. Images were obtained using an XR/Turbo-Z camera (Stanford Photonics) running Piper Control software (v2.3.39). The resolution was 95 nm/pixel. 1000 images for Tau, and 50 images for reference microtubules, were captured at 10 frames/s. Flow chambers were prepared by adhering ARTUS shims (Englewood, NJ) to siliconized glass cover slips. Samples were prepared by incubating the flow chamber with monoclonal anti-β III tubulin (neuronal) monoclonal antibodies(Sigma-Aldrich, St. Louis, MO), diluted to 1–3% in BRB80 buffer, for 5 min at room temperature. The chambers were washed and blocked with BRB80 (containing 1 mg/ml bovine serum albumin (BSA) and an oxygen scavenger system as previously described [McVicker et al., 2011] for an additional 5 min before the addition of microtubules incubated with 0.5 nM or 5.0 nM Tau for 20 min, followed by a wash containing 0.5 nM or 5.0 nM Tau in BRB80. For experiments where Tau concentrations were varied, 1.5 μM microtubules were incubated with 300 nM unlabeled and 0.5 nM labeled 3RS-Tau or 4RL-Tau for 20 min. The chambers were washed with BRB80 supplemented with 0.5 nM labeled-Tau just prior to image acquisition.
Data Analysis
Kymographs were used to differentiate static from diffusing Tau populations. Tau dwell times and brightness analysis were measured using ImageJ software, version 1.44 (National Institutes of Health, Bethesda, MD). For dwell times, the multiple kymograph plugin was used, and only static or diffusing events that occurred on microtubules that began and ended during the course of the data collection period were counted. In addition, only events lasting greater than five frames and could clearly be scored either diffusing or static was included. For brightness analysis, the background subtracted fluorescence intensity of the first five frames of any given event was measured and averaged. Fluorescence intensity was normalized by dividing all data, within a given set, by the mean value of a single Alexa 488-fluorophore. Dwell time distribution histograms were fit to a single exponential decay and brightness distribution histograms were fit by either a Gaussian distribution or the sum of two or three Gaussian distributions in GraphPad Prism software, version 5.0 (GraphPad Software, La Jolla, CA). All data sets reported are composites of data collected over multiple days and dwell time data is presented as the mean fit to a single exponential decay function ± the standard error of the mean for the fitted function. Statistical significance at P<0.05 was determined using the Mann–Whitney test, a nonparametric, bin-width independent statistical hypothesis test, for dwell time comparisons and an unpaired two-tailed Student t-Test was used to compare brightness analysis values. Because photobleaching caused an underestimate of the true dwell times, dwell time measurements were corrected using the following expression kobs=kdiss+kbleach where kobs is the inverse of the association time, kdiss is the dissociation rate, and kbleach is the bleaching rate [Thorn et al., 2000]. All brightness measurements are reported as the mean normalized intensity and standard deviation about the mean. All statistical analysis was performed using GraphPad Prism software, version 5.0 (GraphPad Software, La Jolla, CA).
For mean square displacement analysis (MSD or <x2>), two-dimensional trajectories of Tau diffusion were plotted using ImageJ software, version 1.44, and analyzed using the following expression:
where Δt is the time between frames, N is the total number of frames in the trajectory, n is the number of frames for different time intervals, xi and yi are the positions of Tau in frame i. The diffusion coefficient (D) was calculated using the slope of the first 10–15% of the MSD versus timeplots (Supporting Information Fig. S1) [Kad et al., 2010].
Supplementary Material
The mean square displacement (MSD) plot for Tau trajectories along the microtubule lattice. The diffusion coefficient is obtained from the slope of the MSD plot.
The duration of Alexa 488-labeled 3RS-Tau static and diffusing events on the microtubule surface were plotted in 3 second bins, and the resulting histograms were fit by a single exponential decay function describing the characteristic dwell time ± S.E. of the fit. All dwell times were corrected for photobleaching. It was noted that 3RS-Tau static events on paclitaxel-stabilized microtubules lasted over two times as long as the diffusing events and the static events of the other experimental conditions. 3RS-Tau also slightly favored the static state on paclitaxel stabilized microtubules as compared to the other conditions and demonstrated a shift from static to diffusing states on GMPCPP-stabilized microtubules.
The duration of Alexa 488-labeled 4RL-Tau static and diffusing events on the microtubule surface were plotted in 3 second bins, and the resulting histograms were fit by a single exponential decay function describing the characteristic dwell time ± S.E. of the fit. All dwell times were corrected for photobleaching. It was noted that the dwell times of both the diffusing and static states were similar for all experimental conditions. However, 4RL-Tau demonstrated a large shift from the static state to the diffusing state on GMPCPP-stabilized microtubules.
The diffusion coefficients of 3RS-Tau and 4RL-Tau on the microtubule surface were plotted in 0.2 second bins, and the resulting histograms were fit by a single exponential decay function describing the characteristic diffusion coefficient ± S.E. of the fit.
(A) As a diffusing 3RS-Tau molecule formed a complex with a stationary molecule on the microtubule surface, the florescence intensity of the stationary molecule doubled from a mean intensity of 56.5 ± 21.1 units to 128.4 ± 43.2 units. (B) A three-step bleaching process was observed for a subset of 3RS-Tau molecules on paclitaxel-stabilized microtubules. The mean fluorescence intensity was recorded at 118.4 ± 34.6 units for a single 3RS-Tau patch, and over a period of 10 seconds, the mean intensity was reduced to 62.5 ± 12.2 units, 28.9 ± 11.8 units, and then back to baseline levels in three distinct steps. The background fluorescence was subtracted from each time point and errors are reported as standard deviations. (C) The photobleaching rate of Alexa-488 labeled kinesin (conjugated at a single surface exposed cysteine) is over two times as long as the longest dwell time for Alexa-488 labeled Tau, indicating that photobleaching is not a significant source of error in the dwell time measurements. (D) The brightness of a single Alexa-488 kinesin molecule is centered at 1.00 units, which corresponds to our measurements for a single Alexa-488 tau molecule.
Acknowledgments
Authors thank Dr. Steven King for the 3RS-Tau and 4RL-Tau cDNA constructs. They also thank Dr. David Warshaw and Guy Kennedy for the use and technical support of the TIRF microscope. Authors also thank Gabrielle Anderson, Lynn Chrin, Dr. Justin Decarreau, Dr. Erik Dent, Cindy Fonseca, and Dr. Jason Stumpff for their support during the preparation of this manuscript. This work was supported by funding from NIGMS/NIH (R01 GM101066 to C.L.B.).
Footnotes
Additional Supporting Information may be found in the online version of this article.
References
- Avila J, Lucas JJ, Perez M, Hernandez F. Role of tau protein in both physiological and pathological conditions. Physiol Rev. 2004;84(2):361–384. doi: 10.1152/physrev.00024.2003. [DOI] [PubMed] [Google Scholar]
- Bechstedt S, Brouhard GJ. Doublecortin recognizes the 13-protofilament microtubule cooperatively and tracks microtubule ends. Dev Cell. 2012;23(1):181–192. doi: 10.1016/j.devcel.2012.05.006. [DOI] [PMC free article] [PubMed] [Google Scholar]
- Bulinski JC. Microtubule modification: acetylation speeds anterograde traffic flow. Curr Biol. 2007;17(1):R18–R20. doi: 10.1016/j.cub.2006.11.036. [DOI] [PubMed] [Google Scholar]
- Bunker JM, Wilson L, Jordan MA, Feinstein SC. Modulation of microtubule dynamics by tau in living cells: implications for development and neurodegeneration. Mol Biol Cell. 2004;15(6):2720– 2728. doi: 10.1091/mbc.E04-01-0062. [DOI] [PMC free article] [PubMed] [Google Scholar]
- Butner KA, Kirschner MW. Tau protein binds to microtubules through a flexible array of distributed weak sites. J Cell Biol. 1991;115(3):717–730. doi: 10.1083/jcb.115.3.717. [DOI] [PMC free article] [PubMed] [Google Scholar]
- Castoldi M, Popov AV. Purification of brain tubulin through two cycles of polymerization-depolymerization in a high-molarity buffer. Protein Expr Purif. 2003;32(1):83–88. doi: 10.1016/S1046-5928(03)00218-3. [DOI] [PubMed] [Google Scholar]
- Chen J, Kanai Y, Cowan NJ, Hirokawa N. Projection domains of MAP2 and tau determine spacings between microtubules in dendrites and axons. Nature. 1992;360(6405):674–677. doi: 10.1038/360674a0. [DOI] [PubMed] [Google Scholar]
- Dixit R, Ross JL, Goldman YE, Holzbaur EL. Differential regulation of dynein and kinesin motor proteins by tau. Science. 2008;319(5866):1086–1089. doi: 10.1126/science.1152993. [DOI] [PMC free article] [PubMed] [Google Scholar]
- Frappier TF, Georgieff IS, Brown K, Shelanski ML. tau Regulation of microtubule-microtubule spacing and bundling. J Neurochem. 1994;63(6):2288–2294. doi: 10.1046/j.1471-4159.1994.63062288.x. [DOI] [PubMed] [Google Scholar]
- Goedert M, Spillantini MG. Tau gene mutations and neurodegeneration. Biochem Soc Symp. 2001;chapter 6(67):59–71. doi: 10.1042/bss0670059. [DOI] [PubMed] [Google Scholar]
- Goode BL, Chau M, Denis PE, Feinstein SC. Structural and functional differences between 3-repeat and 4-repeat tau isoforms. Implications for normal tau function and the onset of neurodegenetative disease. J Biol Chem. 2000;275(49):38182–38189. doi: 10.1074/jbc.M007489200. [DOI] [PubMed] [Google Scholar]
- Hinrichs MH, Jalal A, Brenner B, Mandelkow E, Kumar S, Scholz T. Tau protein diffuses along the microtubule lattice. J Biol Chem. 2012;287(46):38559–38568. doi: 10.1074/jbc.M112.369785. [DOI] [PMC free article] [PubMed] [Google Scholar]
- Jeganathan S, von Bergen M, Brutlach H, Steinhoff HJ, Mandelkow E. Global hairpin folding of tau in solution. Biochemistry. 2006;45(7):2283–2293. doi: 10.1021/bi0521543. [DOI] [PubMed] [Google Scholar]
- Kad NM, Wang H, Kennedy GG, Warshaw DM, Van Houten B. Collaborative dynamic DNA scanning by nucleotide excision repair proteins investigated by single- molecule imaging of quantum-dot-labeled proteins. Mol Cell. 2010;37(5):702–713. doi: 10.1016/j.molcel.2010.02.003. [DOI] [PMC free article] [PubMed] [Google Scholar]
- Kanaan NM, Morfini GA, LaPointe NE, Pigino GF, Patterson KR, Song Y, Andreadis A, Fu Y, Brady ST, Binder LI. Pathogenic forms of tau inhibit kinesin-dependent axonal transport through a mechanism involving activation of axonal phosphotransferases. J Neurosci. 2011;31(27):9858–9868. doi: 10.1523/JNEUROSCI.0560-11.2011. [DOI] [PMC free article] [PubMed] [Google Scholar]
- Kar S, Fan J, Smith MJ, Goedert M, Amos LA. Repeat motifs of tau bind to the insides of microtubules in the absence of taxol. EMBO J. 2003a;22(1):70–77. doi: 10.1093/emboj/cdg001. [DOI] [PMC free article] [PubMed] [Google Scholar]
- Kar S, Florence GJ, Paterson I, Amos LA. Discodermolide interferes with the binding of tau protein to microtubules. FEBS Lett. 2003b;539(1–3):34–36. doi: 10.1016/s0014-5793(03)00181-9. [DOI] [PubMed] [Google Scholar]
- Kiris E, Ventimiglia D, Sargin ME, Gaylord MR, Altinok A, Rose K, Manjunath BS, Jordan MA, Wilson L, Feinstein SC. Combinatorial Tau pseudophosphorylation: markedly different regulatory effects on microtubule assembly and dynamic instability than the sum of the individual parts. J Biol Chem. 2011;286(16):14257– 14270. doi: 10.1074/jbc.M111.219311. [DOI] [PMC free article] [PubMed] [Google Scholar]
- Konzack S, Thies E, Marx A, Mandelkow EM, Mandelkow E. Swimming against the tide: mobility of the microtubule-associated protein tau in neurons. J Neurosci. 2007;27(37):9916–9927. doi: 10.1523/JNEUROSCI.0927-07.2007. [DOI] [PMC free article] [PubMed] [Google Scholar]
- Li L, Fothergill T, Hutchins BI, Dent EW, Kalil K. Wnt5a evokes cortical axon outgrowth and repulsive guidance by tau mediated reorganization of dynamic microtubules. Developmental Neurobiology. doi: 10.1002/dneu.22102. in press. in press. [DOI] [PMC free article] [PubMed] [Google Scholar]
- McVicker DP, Chrin LR, Berger CL. The nucleotide-binding state of microtubules modulates kinesin processivity and the ability of tau to inhibit kinesin-mediated transport. J Biol Chem. 2011;286(50):42873–42880. doi: 10.1074/jbc.M111.292987. [DOI] [PMC free article] [PubMed] [Google Scholar]
- Moyer ML, Gilbert SP, Johnson KA. Pathway of ATP hydrolysis by monomeric and dimeric kinesin. Biochemistry. 1998;37(3):800– 813. doi: 10.1021/bi9711184. [DOI] [PubMed] [Google Scholar]
- Naber N, Rice S, Matuska M, Vale RD, Cooke R, Pate E. EPR spectroscopy shows a microtubule-dependent conformational change in the kinesin switch 1 domain. Biophys J. 2003;84(5):3190–3196. doi: 10.1016/S0006-3495(03)70043-5. [DOI] [PMC free article] [PubMed] [Google Scholar]
- Nakata T, Niwa S, Okada Y, Perez F, Hirokawa N. Preferential binding of a kinesin-1 motor to GTP-tubulin-rich microtubules underlies polarized vesicle transport. J Cell Biol. 2011;194(2):245–255. doi: 10.1083/jcb.201104034. [DOI] [PMC free article] [PubMed] [Google Scholar]
- Panda D, Samuel JC, Massie M, Feinstein SC, Wilson L. Differential regulation of microtubule dynamics by three- and four-repeat tau: implications for the onset of neurodegenerative disease. Proc Natl Acad Sci USA. 2003;100(16):9548–9553. doi: 10.1073/pnas.1633508100. [DOI] [PMC free article] [PubMed] [Google Scholar]
- Perez M, Santa-Maria I, Gomez de Barreda E, Zhu X, Cuadros R, Cabrero JR, Sanchez-Madrid F, Dawson HN, Vitek MP, Perry G, et al. Tau—an inhibitor of deacetylase HDAC6 function. J Neurochem. 2009;109(6):1756–1766. doi: 10.1111/j.1471-4159.2009.06102.x. [DOI] [PubMed] [Google Scholar]
- Reed NA, Cai D, Blasius TL, Jih GT, Meyhofer E, Gaertig J, Verhey KJ. Microtubule acetylation promotes kinesin-1 binding and transport. Curr Biol. 2006;16(21):2166–2172. doi: 10.1016/j.cub.2006.09.014. [DOI] [PubMed] [Google Scholar]
- Saragoni L, Hernandez P, Maccioni RB. Differential association of tau with subsets of microtubules containing posttranslationally-modified tubulin variants in neuroblastoma cells. Neurochem Res. 2000;25(1):59–70. doi: 10.1023/a:1007587315630. [DOI] [PubMed] [Google Scholar]
- Skiniotis G, Cochran JC, Muller J, Mandelkow E, Gilbert SP, Hoenger A. Modulation of kinesin binding by the C-termini of tubulin. EMBO J. 2004;23(5):989–999. doi: 10.1038/sj.emboj.7600118. [DOI] [PMC free article] [PubMed] [Google Scholar]
- Song Y, Kirkpatrick LL, Schilling AB, Helseth DL, Chabot N, Keillor JW, Johnson GV, Brady ST. Transglutaminase and polyamination of tubulin: posttranslational modification for stabilizing axonal microtubules. Neuron. 2013;78(1):109–123. doi: 10.1016/j.neuron.2013.01.036. [DOI] [PMC free article] [PubMed] [Google Scholar]
- Stoothoff W, Jones PB, Spires-Jones TL, Joyner D, Chhabra E, Bercury K, Fan Z, Xie H, Bacskai B, Edd J, et al. Differential effect of three-repeat and four-repeat tau on mitochondrial axonal transport. J Neurochem. 2009;111(2):417–427. doi: 10.1111/j.1471-4159.2009.06316.x. [DOI] [PMC free article] [PubMed] [Google Scholar]
- Sultan A, Nesslany F, Violet M, Begard S, Loyens A, Talahari S, Mansuroglu Z, Marzin D, Sergeant N, Humez S, et al. Nuclear tau, a key player in neuronal DNA protection. J Biol Chem. 2011;286(6):4566–4575. doi: 10.1074/jbc.M110.199976. [DOI] [PMC free article] [PubMed] [Google Scholar]
- Thorn KS, Ubersax JA, Vale RD. Engineering the processive run length of the kinesin motor. J Cell Biol. 2000;151(5):1093–1100. doi: 10.1083/jcb.151.5.1093. [DOI] [PMC free article] [PubMed] [Google Scholar]
- Utton MA, Gibb GM, Burdett ID, Anderton BH, Vandecandelaere A. Functional differences of tau isoforms containing 3 or 4 C-terminal repeat regions and the influence of oxidative stress. J Biol Chem. 2001;276(36):34288–34297. doi: 10.1074/jbc.M011384200. [DOI] [PubMed] [Google Scholar]
- Vershinin M, Carter BC, Razafsky DS, King SJ, Gross SP. Multiple-motor based transport and its regulation by Tau. Proc Natl Acad Sci USA. 2007;104(1):87–92. doi: 10.1073/pnas.0607919104. [DOI] [PMC free article] [PubMed] [Google Scholar]
- Yajima H, Ogura T, Nitta R, Okada Y, Sato C, Hirokawa N. Conformational changes in tubulin in GMPCPP and GDP-taxol microtubules observed by cryoelectron microscopy. J Cell Biol. 2012;198(3):315–322. doi: 10.1083/jcb.201201161. [DOI] [PMC free article] [PubMed] [Google Scholar]
Associated Data
This section collects any data citations, data availability statements, or supplementary materials included in this article.
Supplementary Materials
The mean square displacement (MSD) plot for Tau trajectories along the microtubule lattice. The diffusion coefficient is obtained from the slope of the MSD plot.
The duration of Alexa 488-labeled 3RS-Tau static and diffusing events on the microtubule surface were plotted in 3 second bins, and the resulting histograms were fit by a single exponential decay function describing the characteristic dwell time ± S.E. of the fit. All dwell times were corrected for photobleaching. It was noted that 3RS-Tau static events on paclitaxel-stabilized microtubules lasted over two times as long as the diffusing events and the static events of the other experimental conditions. 3RS-Tau also slightly favored the static state on paclitaxel stabilized microtubules as compared to the other conditions and demonstrated a shift from static to diffusing states on GMPCPP-stabilized microtubules.
The duration of Alexa 488-labeled 4RL-Tau static and diffusing events on the microtubule surface were plotted in 3 second bins, and the resulting histograms were fit by a single exponential decay function describing the characteristic dwell time ± S.E. of the fit. All dwell times were corrected for photobleaching. It was noted that the dwell times of both the diffusing and static states were similar for all experimental conditions. However, 4RL-Tau demonstrated a large shift from the static state to the diffusing state on GMPCPP-stabilized microtubules.
The diffusion coefficients of 3RS-Tau and 4RL-Tau on the microtubule surface were plotted in 0.2 second bins, and the resulting histograms were fit by a single exponential decay function describing the characteristic diffusion coefficient ± S.E. of the fit.
(A) As a diffusing 3RS-Tau molecule formed a complex with a stationary molecule on the microtubule surface, the florescence intensity of the stationary molecule doubled from a mean intensity of 56.5 ± 21.1 units to 128.4 ± 43.2 units. (B) A three-step bleaching process was observed for a subset of 3RS-Tau molecules on paclitaxel-stabilized microtubules. The mean fluorescence intensity was recorded at 118.4 ± 34.6 units for a single 3RS-Tau patch, and over a period of 10 seconds, the mean intensity was reduced to 62.5 ± 12.2 units, 28.9 ± 11.8 units, and then back to baseline levels in three distinct steps. The background fluorescence was subtracted from each time point and errors are reported as standard deviations. (C) The photobleaching rate of Alexa-488 labeled kinesin (conjugated at a single surface exposed cysteine) is over two times as long as the longest dwell time for Alexa-488 labeled Tau, indicating that photobleaching is not a significant source of error in the dwell time measurements. (D) The brightness of a single Alexa-488 kinesin molecule is centered at 1.00 units, which corresponds to our measurements for a single Alexa-488 tau molecule.