Abstract
Nitric oxide (NO) plays an important role in inhibiting the development of hepatic fibrosis and its ensuing complication of portal hypertension by inhibiting human hepatic stellate cell (HSC) activation. Here we have developed a gold nanoparticle and silica nanoparticle mediated drug delivery system containing NO donors, which could be used for potential therapeutic application in chronic liver disease. The gold nanoconjugates were characterized using several physico-chemical techniques such as UV-visible spectroscopy and transmission electron microscopy. Silica nanoconjugates were synthesized and characterized as reported previously. NO released from gold and silica nanoconjugates was quantified under physiological conditions (pH = 7.4 at 37 °C) for a substantial period of time. HSC proliferation and the vascular tube formation ability, manifestations of their activation, were significantly attenuated by the NO released from these nanoconjugates. This study indicates that gold and silica nanoparticle mediated drug delivery systems for introducing NO could be used as a strategy for the treatment of hepatic fibrosis or chronic liver diseases, by limiting HSC activation.
1. Introduction
Cirrhosis and chronic liver disease is the twelfth leading cause of death in the United States, accounting for more than 27000 deaths in 2005. Portal hypertension is a major complication of liver cirrhosis and directly increases mortality and morbidity by increasing the propensity of venous hemorrhage [1]. Previous research has shown that nitric oxide (NO) is important to both increased hepatic resistance and hyper-dynamic circulation-associated hyperemia [1–3]. Under normal physiologic conditions, endothelial nitric oxide synthase (eNOS) derived NO exerts paracrine effects on hepatic stellate cells (HSC). In cases of hepatic cirrhosis or fibrosis, NO generation from endothelial cells is impaired in association with concomitant HSC activation and changes in sinusoidal structure, events which significantly contribute to the development of portal hypertension [4]. HSCs, liver specific pericytes, are normally quiescent and low in mitotic activity. In the case of hepatic fibrosis or chronic liver diseases, HSCs are activated and transform into myofibroblastlike cells, migrate to the portal area, proliferate, and produce various components of the extracellular matrix. Hepatic angiogenesis contributes to fibrosis in liver [5]. The broader role of angiogenesis in portal hypertension and cirrhosis has developed into an area of vigorous investigation. Our earlier studies have shown that NO negatively regulates diverse HSC functions that lead to the HSC ‘activation’ phenotype of portal hypertension including HSC migration, proliferation, and contraction [4, 6–8]. Therefore, the aim of our present study was to develop a novel method for a drug delivery system to deliver NO in a controlled way to the activated HSC in an in vitro setting of hepatic cellular milieu resembling the chronic liver disease. In this context, the pivotal role of nanotechnology was evaluated towards solving biological problems.
Nanotechnology is a cutting edge technology that is devoted to understanding, creation, and design of matter at the atomic and molecular level. Generally it deals with structures of the size 100 nm or smaller [9–12]. Nanomedicine is the biomedical application of nanoscience and nanotechnology [12–14]. Several inorganic nanoparticles including gold nanoparticles, silica nanoparticles, silver nanoparticles, lanthanide nanoparticles [15, 16], and quantum dots (CdSe, ZnS, PbSe, ZnSe, and ZnS) play an appreciable role in biology and medicine because of their unique sizedependent properties and optical properties [11, 16–19]. Among these inorganic nanoparticles, frequently colloidal gold nanoparticles (AuNPs) have been widely used for drug delivery, imaging, biomedical diagnostics, and therapeutic applications due to their stability, biocompatibility, very high surface area, ease of preparation, characterization, and surface functionalization properties due to a strong affinity for the –SH and –NH2 group [10, 20–25]. Similarly, silica nanoparticles (SiNPs) also offer a wide variety of potential applications in biomedical sciences [26–31]. Its biocompatibility, stability, and surface modifications render the possibility of using it as a controlled delivery system for therapeutic agents such as vancomycin, neurotransmitters, anti-tumor agents, peptides and NO [29–31]. Such modification and functional properties have provided the potential for employing AuNPs and SiNPs as drug delivery vehicles.
In this paper, we have developed gold and silica nanoconjugate mediated drug delivery system (DDS) for delivery of NO in a controlled way to the activated HSCs in an in vitro setting of hepatic cellular milieu resembling chronic liver disease. The NO conjugation to AuNPs was characterized by several physico-chemical analyses and NO released from this AuNPs and SiNPs conjugated with NO donor was quantified by in vitro methods for a substantial period of time. Proliferation and vascular tube formation ability of HSCs was significantly attenuated by the NO released from AuNPs and SiNPs indicating these nanoconjugates bound with NO may serve as a novel NO delivery system for therapeutic application of cirrhosis and chronic liver disease.
2. Materials and methods
2.1. Materials
Tetrachloroauric acid (HAuCl4) and sodium borohydride (NaBH4) were purchased from Aldrich Chemicals (St Louis, MO). 7–10 nm dia. hydroxyl-terminated fumed silica (FS), N-acetyl-DL-penicillamine, tert-butylnitrite, acetic anhydride, toluene, pyridine, hexane, chloroform (CHCl3), concentrated hydrochloric acid (HCl) and magnesium sulfate were all purchased from Sigma-Aldrich (St Louis, MO). (3-Aminopropyl) trimethoxysilane (APTMS) was obtained from Fluka (Milwaukee, WI). Tert-butyl nitrite was purified by extracting with an aqueous solution of 15 mM cyclam to remove copper used for stabilizing the organonitrite. All the chemicals were used as received without further purification.
2.2. Detection of endotoxin in water
The Millipore H2O, used for all experiments in our research was tested for endotoxin using the gel-clot method according to manufacture’s instructions (Cat # GS 250 Cape Cod Associates, Cape Cod). The formation of a gel-clot indicated the presence of endotoxin in a sample. However, we did not observe any gel-clot indicating absence of endotoxin in Millipore H2O.
2.3. Synthesis of gold nanoparticles (AuNPs)
Colloidal AuNPs were synthesized by mixing an aqueous solution of HAuCl4 and NaBH4 under vigorous stirring in a 2 l flask according to our previously reported literature [10, 20, 21, 32–34]. Initially, a stock solution of HAuCl4 was prepared at a concentration of 10−2 M by dissolving 1 g of HAuCl4 in endotoxin free H2O. Briefly, 10 ml of 10−2 M HAuCl4 was diluted to 1000 ml with endotoxin free H2O and an aqueous solution of sodium borohydride (~45 mg of NaBH4 in 500 ml of H2O) was added to it under vigorous stirring for 12–16 h to obtain the AuNPs used in this study.
2.4. Synthesis of gold nanoconjugates containing NO donors
Several NO donors such as S-nitroso-N-acetyl-DL-penicillamine (SNAP), glyco-SNAP, 3-morpholino-sydnonimine (SIN-1), S-nitrosoglutathione (SNOG) were screened to select one with better long term, slow NO releasing ability and chemical characteristics for the present study. Gold nanoconjugates containing NO donors such SNAP, glyco-SNAP, SIN-1, SNOG, etc, were synthesized in a single step incubation at room temperature by mixing AuNPs solution and corresponding NO donors (10 µg ml−1 of AuNPs) under stirring condition according to our previously published methods [10, 20, 21, 32–34]. After the final incubation, the UV-visible spectra of the resultant solutions were taken to measure the absorbance of AuNPs bound to NO donors. The resulting solutions were centrifuged at 13 000 rpm for 1 h 10 °C in a Sorvall Ultracentrifuge OTD80B (Thermofisher Scientific, Inc. Waltham, MA) using a 502Ti rotor. The loose pellets were used for further chemical characterizations and cell culture experiments.
2.5. Synthesis of S-nitroso-N-acetyl-DL-penicillamine derivitized fumed silica (SNAP-FS)
The complete synthesis and characterization of SNAP-FS has been performed as described previously [29]. Briefly, to synthesize the SNAP-FS, first 2.4 g fumed silica (FS) was refluxed in toluene for 24 h with 2.1 g APTMS. Particles were purified from un-reacted APTMS after dispersing in fresh toluene and three additional centrifugations. In order to obtain, N-acetyl-DL-penicillamine thiolactone crystals (NADLPT), the N-acetyl-DL-penicillamine and acetic anhydride (both separately dissolved in pyridine at ice-cooled for 20 min) solutions were combined and stirred at room temperature overnight. NADLPT crystals were obtained after solvent removal followed by extraction with 1 M HCl and dried with magnesium sulfate. The APTMS-FS was mixed with NADLPT crystals then mixed in pyridine and stirred at room temperature for 24 h. The thiol group of N-acetyl-DL-penicillamine was reacted with tert-butylnitrite for 45 min to form SNAP-FS. SNAP-FS particles were washed with toluene to remove un-reacted tert-butylnitrite, collected by centrifuging at 3000 rpm for 10 min, and vacuum dried.
2.6. Cell culture experiments
Primary human HSC (ScienCell Research Laboratories) and LX2 cells, a well-characterized cell-line derived from human HSCs, which express many markers of the activated HSC phenotype. The markers of activated HSCs includes expression of NG2 (Suppl. figure 1 available at stacks.iop.org/Nano/21/305102/mmedia), HSP 47 mRNA, MMP-2, PDGF receptor β subunit [6] and α-SMA [35]. LX2 were cultured in Dulbecco’s modified Eagle’s medium, or specialized HSC medium, supplemented with 10% fetal bovine serum, 1 mmol l−1 L-glutamine, and 100 IU ml−1 penicillin. All cells were maintained at 37 °C in an atmosphere containing 95% air−5% CO2 (v/v).
2.6.1. Proliferation assay
Cell proliferation was evaluated using the colorimetric MTS assay according to the manufacturer’s instructions (CellTiter 96 Aqueous One-Solution Cell Proliferation Assay, Promega, Madison, WI, USA). The reduction of yellow tetrazolium salt [3-(4,5-dimethylthiazol-2-yl)-5-(3-carboxymethoxyphenyl)2-(4-sulfophenyl)-2H–tetrazolium] in MTS to form purple formazan crystals by the dehydrogenase enzymes secreted by the mitochondria of metabolically active cells forms the basis of this assay. The formazan dye shows absorbance at 492 nm and the amount of formazan crystals formed is directly proportional to the number of cells. The relative proliferation rates of primary human HSC and LX2 cells treated with either vehicle or various concentrations of Au-SNAP and SNAP-FS in basal (serum free) cell culture medium for 18 h in 96 well plates were then rinsed with phosphate-buffered saline (PBS) to remove unattached cells and incubated with 20% MTS reagent in a serum free medium for a period of 3 h at 37 °C. Absorbance of the obtained dye was measured at 490 nm using a spectrophotometric plate reader as described previously [4].
2.6.2. Vascular tube formation assay
Glass-chambered slides were coated with 100 µl Matrigel Matrix (BD Biosciences, San Jose, CA) for 30 min at 37 °C. Cells were washed, trypsinized and seeded at 2 × 10⁴ cells/well on Matrigel-coated chamber slides. Cells were incubated in the presence of either vehicle or various concentrations of Au-SNAP or SNAP-FS in basal (serum free) cell culture medium for 12–18 h at 37 °C and 5% CO2 and imaged using 4× objective and analyzed using Image-Pro Plus 6.2 software for quantification of tube formation as described previously [36, 37].
3. Characterization
AuNPs and its nanoconjugates (Au-SNAP, Au-glyco-SNAP, Au-SIN-1, Au-SNOG, Au-SNAP) were characterized using UV–visible spectroscopy and transmission electron microscopy as described previously [10, 20, 21, 32–34]. Synthesis and characterization of SNAP-FS were carried out by several physico-chemical techniques according to published literature [29].
3.1. UV–vis spectroscopy
UV–vis spectra of AuNPs and its conjugates with various NO donors including Au-SNAP, Au-glyco-SNAP, Au-SIN-1, Au-SNOG, were recorded for their absorbance maximum using UV–visible spectroscopy (Shimadzu UV PC2101). The solutions were loaded in a 1 ml cuvette and the spectra recorded from 200 to 800 nm with a resolution of 1 nm.
3.2. Transmission electron microscopy (TEM)
TEM micrographs of AuNPs were obtained in a FEI TECNAI 12 operating at 120 kV by drop coating the solution in a carbon-coated copper grid (300 mesh) as described previously [21, 32, 34]. TEM micrographs of primary human HSC and LX2 cells were taken on a TECNAI 12 (FEI Company, Hillsboro, OR) operating at 120 kV. TEM sample preparation involving primary human HSC and LX2 cells was performed by treating cells with AuNPs for two hours in respective cell culture medium. After 2 h of incubation, human primary HSCs or LX2 cells were trypsinized and centrifuged initially at 1500 rpm for 5 min. The resultant cell pellets were then washed thrice with PBS, suspended in Trump’s fixative (1% glutaraldehyde and 4% formaldehyde in 0.1 M phosphate buffer, pH 7.2) and subjected for TEM analysis. To visualize the internalization of AuNPs in the cells, previously published procedures were followed [15, 38, 39].
3.3. Quantification of NO releases from AuNPs conjugated NO donors and fumed silica-SNAP
The fluorescent reagent 4,5-diaminofluorescein (DAF-2) has been widely used for specific and quantitative measurement of NO. In vitro NO release was studied using DAF-2 fluorimetric assay over a period of time as described previously [40]. Briefly, AuNPs conjugated with various NO donors were incubated in a solution containing 1 µM DAF-2 and incubated for 30 min in microcuvettes for fluorescence quantification with excitation of 485 nm and emission of 538 nm using a fluorimeter (VersaFluor Flurometer, BioRad). Fluorimetry was performed in duplicate for each sample, and a standard curve generated using known amounts of sodium nitroprusside (SNP, 0–500 nM). NO generation from SNAP-FS was measured with chemiluminescence detection using a Sievers Nitric Oxide Analyzer 280i (GE Instruments, Boulder, CO).
3.4. Statistical analysis
The data in the bar graphs represent the mean ± S.E.M. of at least three independent experiments, each performed with duplicate samples. TEM figures represent typical experiments reproduced at least three times with similar results. Statistical analyses were performed using a Student’s t test, with a twotailed value of P < 0.05 considered significant.
4. Results and discussion
4.1. UV-visible spectroscopy and TEM
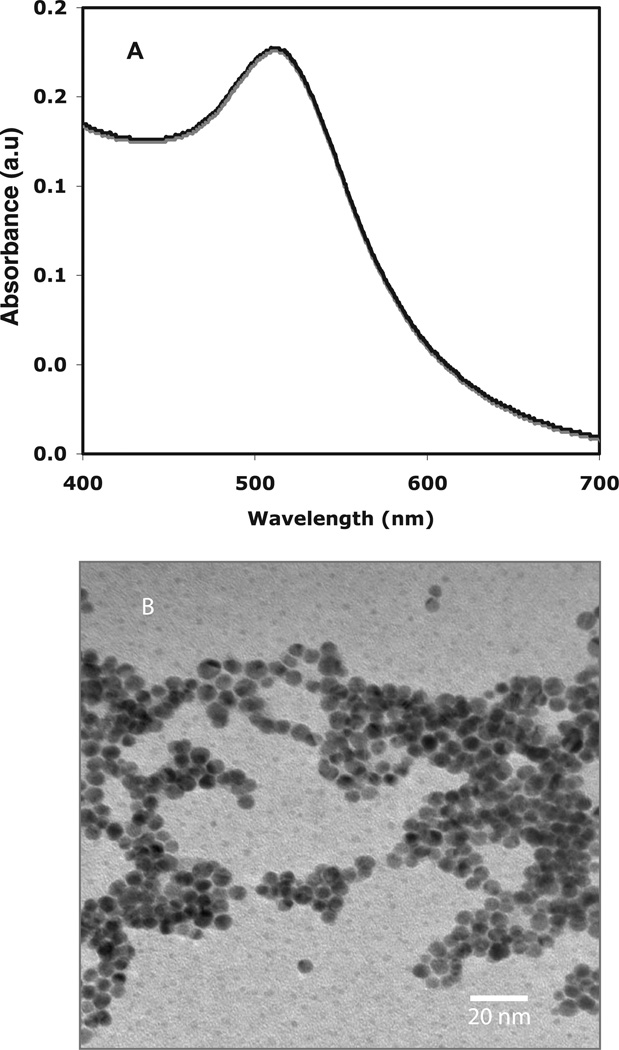
The as-synthesized AuNPs, obtained by the reduction of HAuCl4 with NaBH4, were characterized by UV-visible spectroscopy and TEM [21, 32, 33]. The AuNPs were spherical in shape and depicted a characteristic size of approximately 5 nm [21, 32, 33]. The UV-visible spectrum of AuNPs (figure 1(A)) exhibits a characteristic surface plasmon resonance (SPR) band at ~510 nm, depicting formation of spherical gold nanoparticles [41]. Using TEM analysis, the formation of AuNPs and their shape and size was further confirmed to be spherical of nearly <5 nm as shown in figure 1 (B).
Figure 1.
UV–visible spectroscopy and TEM of AuNPs. (A) UV-visible spectrum of a colloidal AuNPs solution shows a characteristic absorbance at 510 nm. Graphical representation, n = 3. (B) TEM picture of AuNPs was obtained after drop coating the AuNPs on carbon-coated copper grid depicting the shape and size of these gold nanoparticles to be spherical and <5 nm, respectively. Representative photomicrographs are from three independent experiments.
4.2. UV-visible spectroscopy gold nanoconjugates
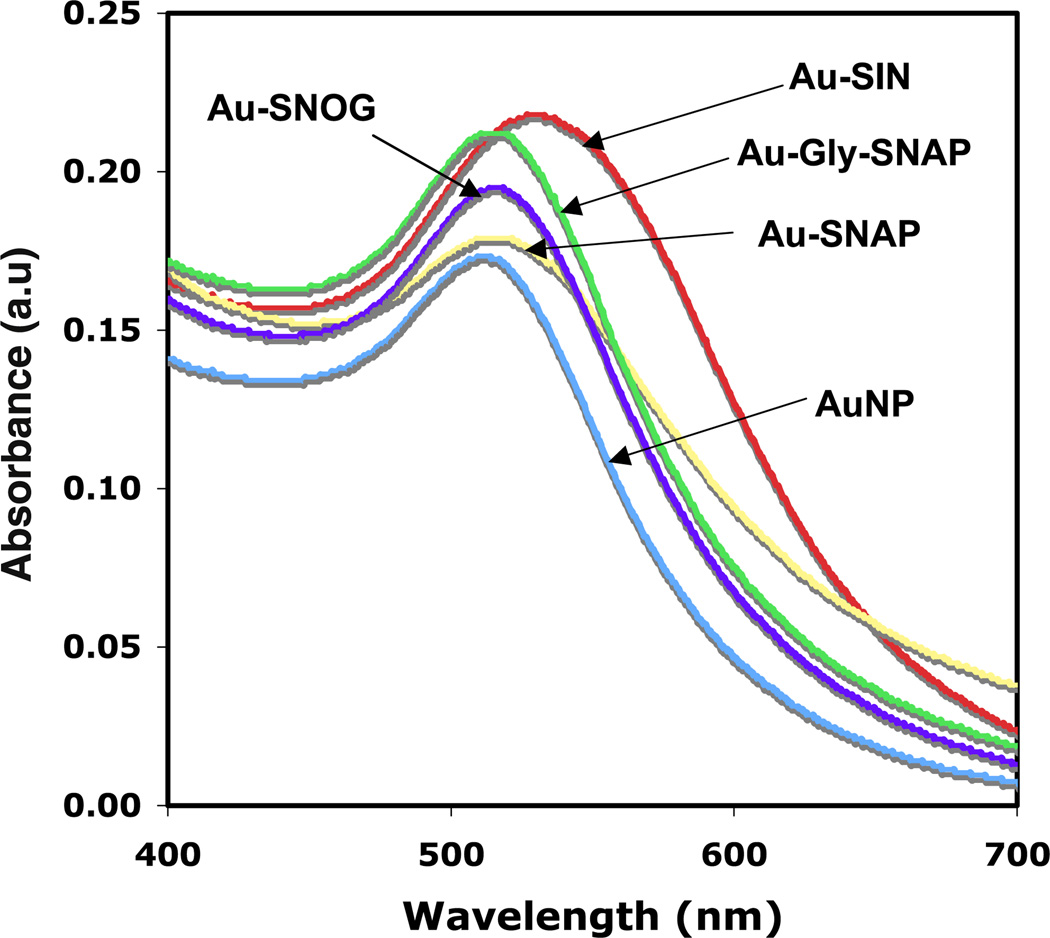
Figure 2 demonstrates the change of absorption maxima (λmax) of AuNPs upon additions of SIN-1, SNAP, glyco-SNAP and SNOG to AuNPs solution. This data clearly demonstrates a red shift in the SPR band maxima in Au-SIN-1 (from λmax = 510 to 535 nm), Au-SNAP (from λmax = 510 to 525 nm), Au-glyco-SNAP (from λmax = 510 to 520 nm), Au-SNOG (from λmax = 510 to 521 nm) upon addition of SIN, SNAP, glyco-SNAP and SNOG, respectively, as compared to the spectrum of AuNPs alone (λmax = 510). These red shifts in the λmax values upon addition of various NO donors such as SIN-1, SNAP, glyco-SNAP and SNOG suggest the interaction and binding of the individual components with the surface of AuNPs. Concurrently, an increase in absorbance of AuNPs with the addition of various NO donor molecules on AuNPs was also observed. For example, the absorbance of naked AuNP is 0.171 and similarly absorbances of Au-SNAP, Au-SNOG, Au-glyco-SNAP and Au-SIN are 0.179, 0.195, 0.209, and 0.217, respectively. The higher absorbance of NO donor conjugated AuNPs as compared to naked AuNPs indicates lack of aggregation after the interaction of NO donors with AuNPs. TEM analysis of these NO donor conjugated AuNPs further confirmed lack of aggregation (data not shown).
Figure 2.
UV–visible spectra of NO-conjugated AuNPs. AuNP was conjugated with different NO donors SIN-1 (Au-SIN-1), SNAP (Au-SNAP), glyco-SNAP (Au-glyco-SNAP) and SNOG (Au-SNOG). Change of absorption spectra of AuNPs as well as change of λmax (towards red shift) upon the addition of SIN-1, SNAP, glyco-SNAP and SNOG indicates the association of NO donor molecules to AuNPs. Graphical representation are from three independent experiments, n = 3.
4.3. NO release quantification by different NO donors bound to AuNPs
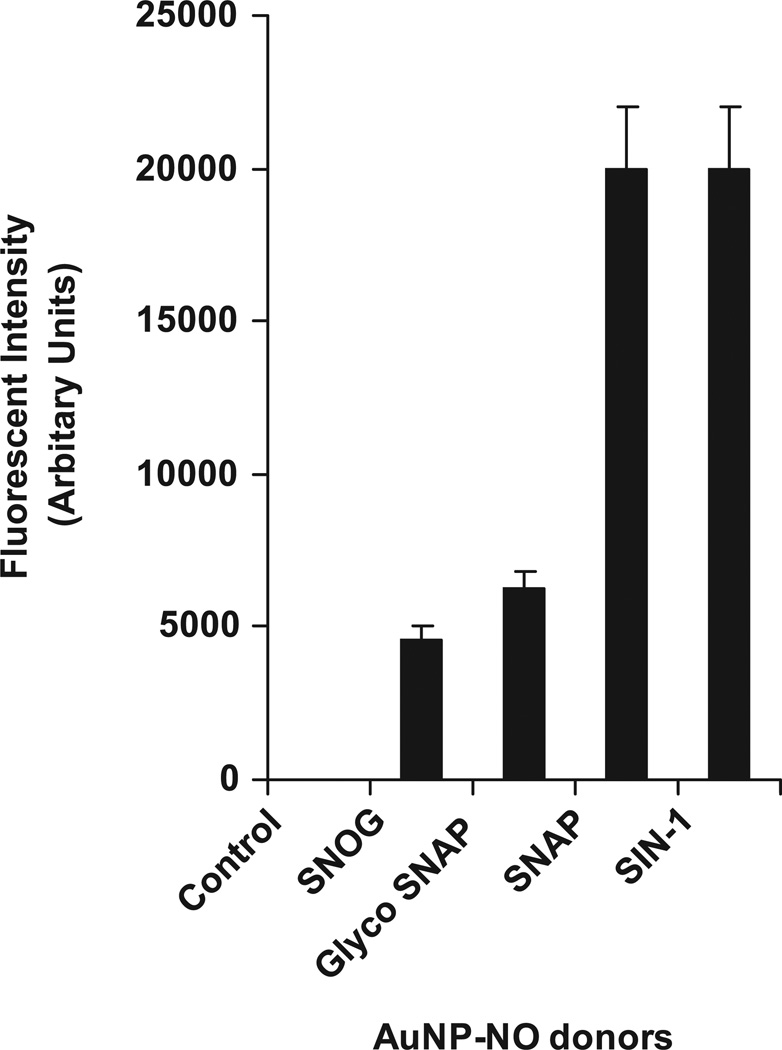
Quantification of NO release from the AuNPs showed a marked increase in NO release profile by SIN-1 and SNAP bound to AuNPs as compared to control (only AuNPs) at a period of 18 h time point (n = 3, *p < 0.05) (figure 3). It is pertinent to mention that the NO released by AuNPs also showed a marked physiological effect on the HSCs at 18 h time point. Although Au-SIN-1 to nanogold conjugates showed a significant increase in NO release, the metabolized product of SIN-1 generates peroxynitrite [42], a reactive nitrogen species that may cause unwarranted side effects in in vivo settings as a DDS. However, SNAP when metabolized generates nitrate and nitrite and releases NO [43] but not peroxynitrite. Thus further studies were performed using Au-SNAP nanoconjugates.
Figure 3.
Quantification of NO release by NO-conjugated AuNPs. In vitro NO release by NO-bound AuNPs was studied using DAF-2 fluorimetric assay over a period of 18 h time point. SIN-1 and SNAP bound to AuNP conjugates showed a marked increase in NO release profile as compared to control (AuNPs) at a period of 18 h time point (n = 3).
4.4. UV–visible spectra of Au-SNAP nanoconjugates
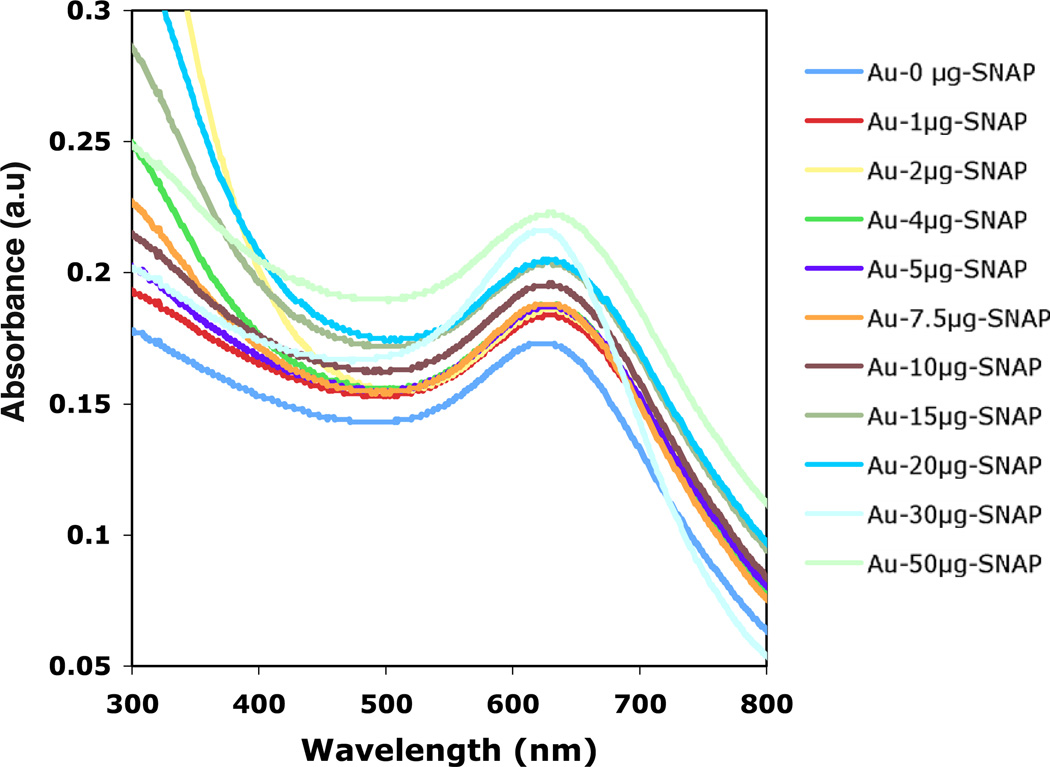
The UV-visible spectra of Au-SNAP were evaluated at different concentrations of SNAP (0–50 µg ml−1) in aqueous solution. Figure 4 demonstrates the increase of absorption maxima (0.173–0.221) of AuNPs while increasing the concentration of SNAP from 0 to 50 µg ml−1. This data clearly demonstrates a red shift in the SPR band maxima in Au-SNAP with increasing concentration of SNAP further indicating the increase in binding interaction between AuNPs and SNAP.
Figure 4.
UV–visible spectra of Au-SNAP nanoconjugates. Using different concentrations of SNAP (0–50 µg with respect to 1 ml of AuNPs solution) an increase in absorbance of Au-SNAP was observed with increasing concentration of SNAP (n = 3).
4.5. Saturation kinetics of Au-SNAP nanoconjugates
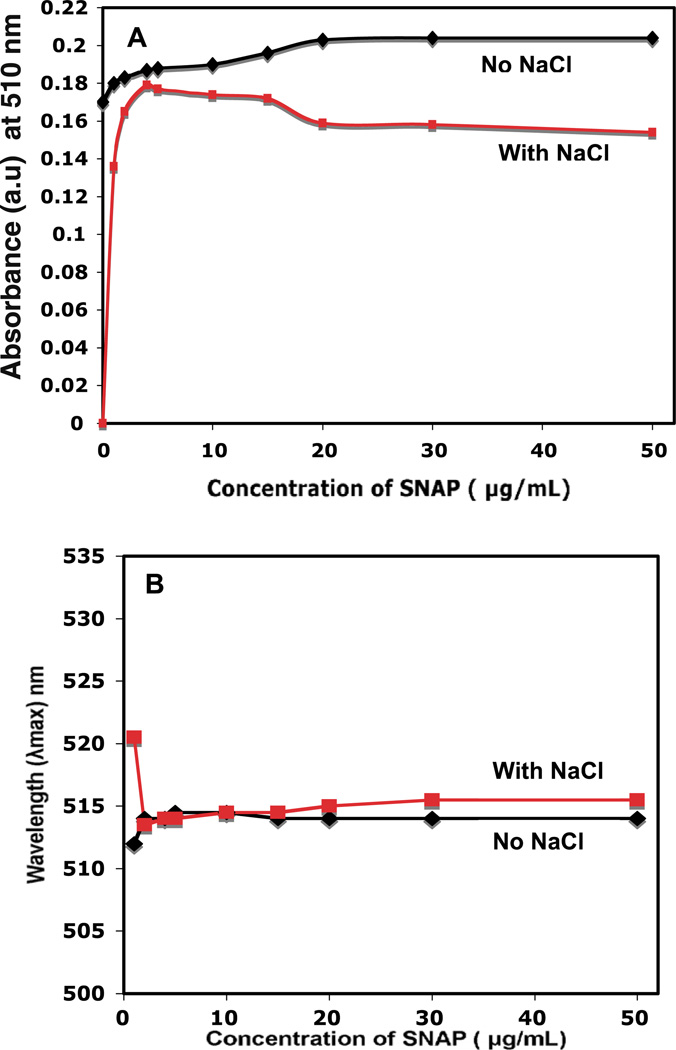
The saturation concentration of SNAP was determined by incubating different concentrations of the SNAP with the AuNPs at room temperature followed by testing the stability of Au-SNAP using a 140 mmol l−1 NaCl solution (figure 5 (A) and (B)). Attachment of SNAP to AuNP was confirmed by monitoring the change in absorbance and shift in the λmax value of AuNP after incubation with increasing concentration of SNAP (0–50 µg ml−1). Figure 5 (A) represents the change in absorbance of AuNP after the addition of an increasing concentration of SNAP. At first, a saturation curve of SNAP to AuNP was prepared by increasing the concentration of SNAP. The saturation curve provides an idea of the number of drug molecules required to saturate a nanoparticle. The increase in absorbance of AuNP upon incubation with increasing concentrations of SNAP also suggests the perturbation of the electrical double layer around gold nanoparticles upon SNAP addition (figure 5(A)). These increased absorbance also suggests the attachment or binding of SNAP to AuNP [32]. Aggregation of uncovered or partially covered particles is induced by the addition of 140 mmol l−1 NaCl and can be monitored by following the SPR absorbance of AuNPs. The concentration minimizing aggregation is considered to be the saturation concentration. The extent of aggregation, however, should decrease with increasing protection of the AuNP surface SNAP. It is clear from figure 5 (A) that in the absence of any SNAP but in the presence of NaCl, the AuNPs are completely aggregated and their absorbance dropped to zero. Protecting the AuNP surface with SNAP prevented aggregation. The extent of aggregation was found to be minimal at a concentration of 10 µg ml−1 SNAP. Figure 5 (B) represents the shift in λmax of gold nanoconjugate with increasing concentration of SNAP from 0 to 50 µg ml −1. It is evident from the figure that a red shift in the λmax value of AuNP was observed (λmax = 514.5 nm, concentration of SNAP being 10–50 µg ml−1) as compared with the spectrum of AuNPs alone (λmax = 510 nm), suggesting the association of SNAP to AuNPs. The observed red shift in the λmax value and an increase in plasmon resonance are consistent with increase in the dielectric constant of the medium surrounding the AuNPs and suggest the conjugation of SNAP to AuNP [21, 33, 44].
Figure 5.
Saturation concentration of SNAP to AuNPs. UV–visible spectra of Au-SNAP nanoconjugates were performed using different concentrations of SNAP. Au-SNAP nanoconjugates were prepared by incubating AuNPs and SNAP at different concentrations at room temperature. The saturation concentration of SNAP was first determined by incubating different concentrations of the SNAP with AuNPs followed by stability testing using a 140 mmol l−1 NaCl solution and determination of saturation curve of SNAP on AuNPs in presence and absence of NaCl, (A) change in absorbance of AuNP, and (B) shift in the λmax with the addition of increasing concentration of SNAP. (a.u. means ‘arbitrary units’ used in Y-axis in this figure). Graphical representation, n = 3.
4.6. Internalization of Au-SNAP nanoconjugates
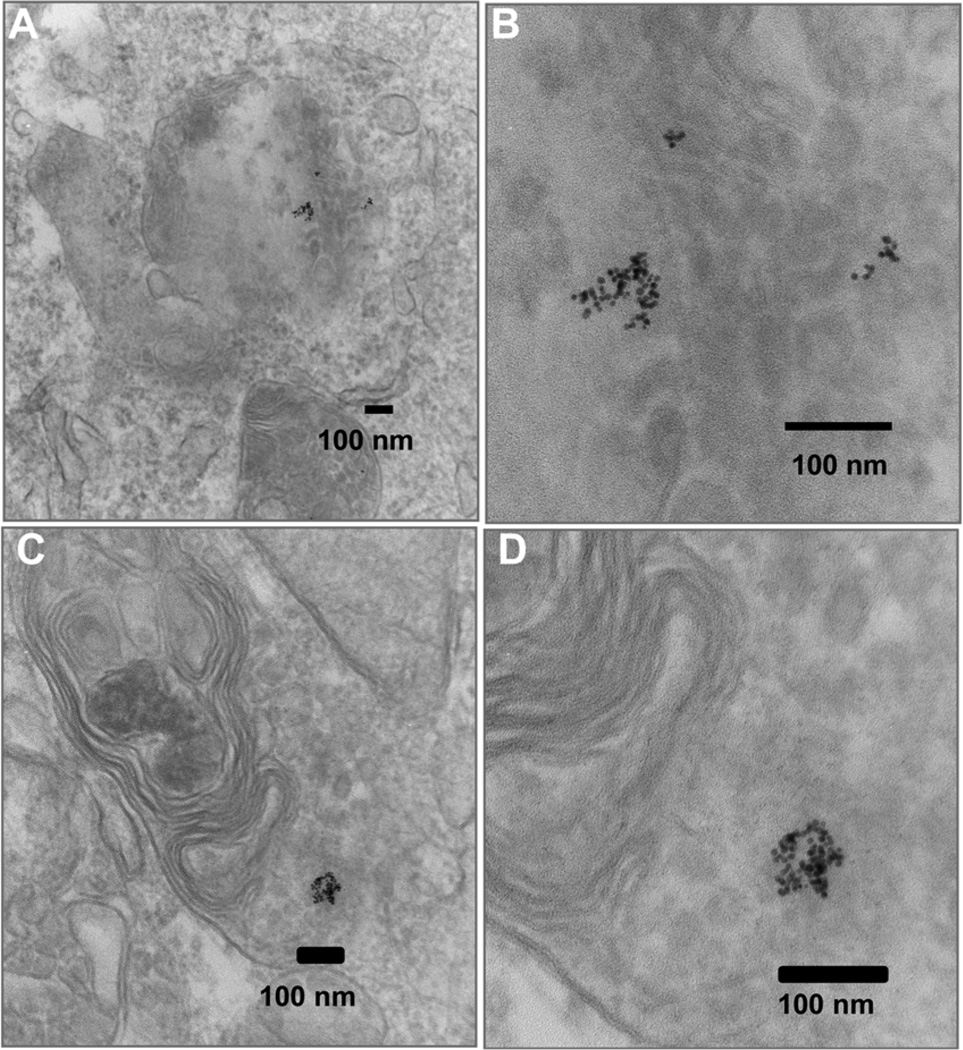
We next examined the cellular uptake of Au-SNAP nanoconjugates using TEM studies in the primary human HSC and LX2 cells. TEM pictures of LX2 cells treated with Au-SNAP for 2 h indicate an uptake of synthesized AuNPs in the cytoplasmic compartment as depicted in figure 6(A) and (B). This figure clearly indicates that in most of the cells, uptake of these nanoconjugates occurred. The morphology of these cells also clearly demonstrates no cytotoxicity issues in vitro following internalization of these nanoconjugates (figure 6 (A)). Similarly, the morphology of the nanoconjugates remained unchanged after internalization of AuNPs observed in higher magnified pictures (figure 6 (B)). Similar results were obtained when the primary human HSCs were treated with AuNPs (figure 6 (C) and (D)). The cellular uptake of these AuNPs were equally evident in both primary human HSC as well as transformed cells (LX2), a human HSC cell-line and are therefore not selective in terms of uptake in different cell types. However, TEM micrographs at higher magnification (figure 6 (B) and (D)) could not resolve the sub-cellular localization of these AuNPs in the intracellular components. Further studies are required to elucidate the exact intracellular compartmental localization of these nanoparticles.
Figure 6.
Cellular uptake of Au-SNAP. (A) TEMs of LX2 cells treated for 2 h with Au-SNAP. (B) Internalization of Au-SNAP by LX2 cells with higher magnifications. (C) TEM pictures of primary HSCs treated for 2 h with Au-SNAP. (D) Internalization of Au-SNAP by primary HSCs as observed under higher magnification. The photomicrographs clearly illustrate the internalization of gold nanoconjugates in both LX2 and primary HSC cells. Representative photomicrographs are from three independent experiments.
4.7. NO release from silica nanoconjugates
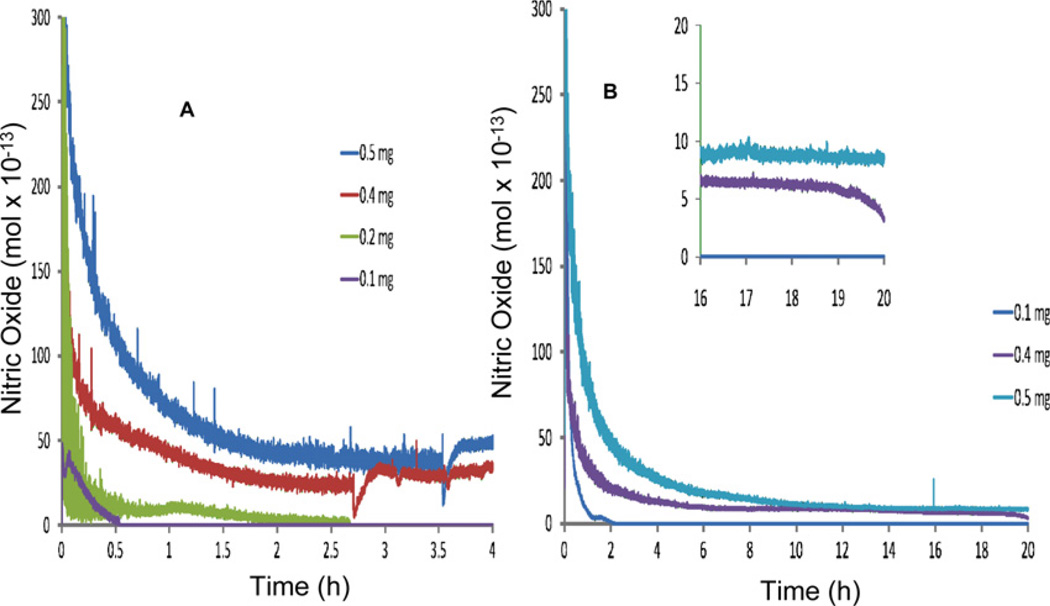
Next we compared our Au-SNAP with SNAP-FS, which has been previously established as a NO delivery nanoconjugate [29]. Figure 7 (A) shows the mass-dependent moles of NO released/s from SNAP-FS suspended in PBS (pH 7.4) incubated at 37 °C over a 4 h period. A large bolus of NO is released upon addition of the particles to the PBS solution and decreases over the duration of the experiment. SNAP-FS decompose to release NO upon contact with the buffer solution due to trace metals present in the buffer salts. Figure 7(B) shows the moles of NO released/s over a 20 h time period for 0.5, 0.4, and 0.1 mg SNAP - FS ml−1 of solution. After 20 h, the solution containing 0.5 mg SNAP-FS released NO at a rate of approximately 9 × 10⁻¹³ mol s−1 and 0.4 mg of particles ml−1 of solution released approximately 7 × 10⁻¹³ mol s−1. These release rates cannot be converted to molar concentrations of NO because the solution containing the particles was continuously purged with N2(g). This data therefore show the real-time NO release rates from the SNAP-FS particles.
Figure 7.
Release profile of NO from SNAP-FS. SNAP-FS particles were suspended in PBS (pH 7.4) at 37 °C. (A) Shows the moles of NO generated from 0.1, 0.2, 0.4 and 0.5 mg of SNAP-FS suspended in 1 ml of PBS (pH 7.4) at 37 °C over a 4 h period measured using chemiluminescence technique. (B) Shows the moles of NO generated/s from 0.1, 0.4 and 0.5 mg of SNAP-FS suspended in 1 ml of PBS (pH 7.4) at 37 °C over a 20 h period measured with chemiluminescence. Inset shows detail of NO release between 16–20 h time points of experiment. Graphical representation, n = 3.
4.8. NO released from NO-bound nanoconjugates attenuate HSC proliferation
During hepatic fibrosis, HSCs are activated and therefore depict angiogenic phenotype with increased proliferation, migration and tube forming capacity. Our previous studies has shown that NO attenuates small GTPases Rac1 and platelet-derived growth factor (PDGF)-driven migration of LX2 cells by abrogating the filopodia formation in this cells [6]. Also the PDGF-induced primary HSC migration was significantly attenuated in presence of NO donor SNP in a concentration-dependent manner indicating the role of NO in reversal of activation of HSCs [6]. Therefore the effects of these NO-bound nanoconjugates were studied on the LX2 proliferation and tube formation, other physiological parameters of angiogenic phenotype in activated HSCs.
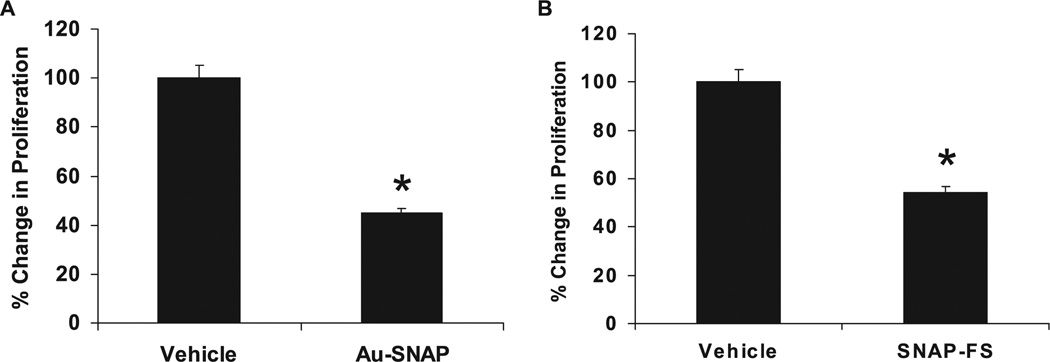
Proliferation of LX2 cells was significantly decreased by 55% when treated with Au-SNAP as compared to vehicle control (p < 0.05, n = 3) (figure 8 (A)). Similarly, a 45% decrease in proliferation of LX2 cells was also observed in presence of SNAP-FS as compared to vehicle control (p < 0.05, n = 3) (figure 8 (B)). A decrease in proliferation of primary human HSCs were also observed in presence of both Au-SNAP and SNAP-FS (data not shown). This data once again indicates the non-specific effect of these NO-bound nanoconjugates in terms of cell types, primary and transformed cell proliferation.
Figure 8.
NO-bound nanoparticles attenuate LX2 cell proliferation. (A) Au-SNAP (NO donor, 100 ng ml−1) significantly decreased the proliferation of LX2 cells (n = 3, *p < 0.05). (B) The proliferation of LX2 cells were also significantly inhibited in presence of SNAP-FS (n = 3,*p < 0.05).
4.9. NO delivered using nanoconjugates perturbs angiogenic phenotype of HSCs
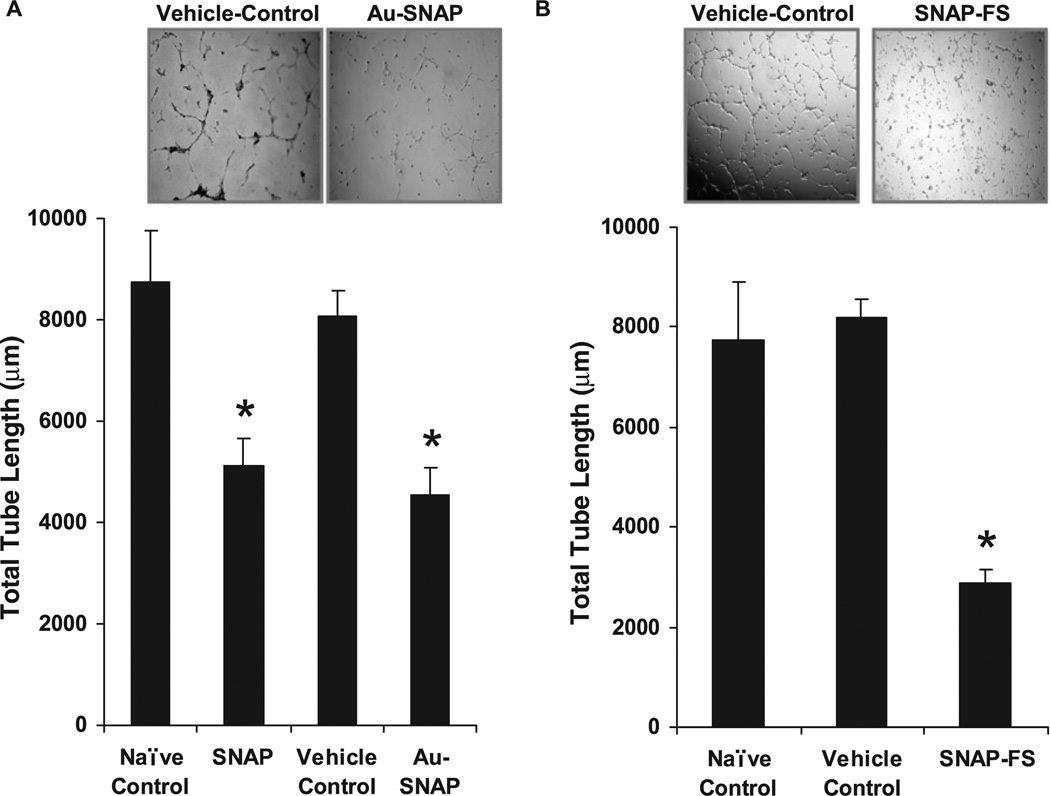
The effects of Au-SNAP and SNAP-FS on HSC function was analyzed by measuring HSC tube formation, a parameter which is generally inhibited by NO. Tube formation by human HSC cell-line, LX2 cells was attenuated by Au-SNAP (total tube length (µm): 4559.16 ± 537.33 as compared to vehicle control 8052.13 ± 533.01, p < 0.05, n = 3) (figure 9(A)). Similarly, HSC tube formation ability was also attenuated by SNAP-FS (total tube length (µm): 2864.8 ± 270.73 as compared to vehicle control 8178 ± 381.95, p < 0.05, n = 3) (figure 9(B)). A similar decrease in tube formation ability of primary human HSCs was also observed in the presence of both Au-SNAP and SNAP-FS (data not shown). These results from our in vitro experiments support the feasibility of generating biologically functional NO-based nanogold or silica nanoconjugate compounds that can target to liver HSCs using a specific antibody against activated HSC cell membrane protein markers bound to these nanoconjugates for potential therapeutic use in in vivo settings of chronic liver disease.
Figure 9.
Attenuation of LX2 cell tubulogenesis by NO-bound nanoconjugates. (A) Vascular tube formation capacity of LX2 cells, an in vitro correlates of angiogenesis, was significantly decreased in presence of both SNAP and Au-SNAP (NO donor, 100 ng ml−1) (n = 3, *p < 0.05). (B) SNAP-FS (NO donor, 360 µg ml−1) also showed a similar inhibition in tube formation ability of LX2 cells (n= 3, *p < 0.05). Representative photomicrographs from three independent experiments are shown in inset.
5. Conclusions
We have developed a gold and silica nanoparticle mediated DDS for NO delivery that can be explored for potential therapeutic application in chronic liver disease in the near future. These DDS have been critically characterized by several physico-chemical techniques. NO released from Au-SNAP and SNAP-FS was quantified by in vitro methods for a substantial period of time. Proliferation and vascular tube formation ability of the human HSCs, an in vitro correlates of angiogenic phenotype, were significantly attenuated by the NO released from these nanoconjugates. The results of this study indicates that both Au-SNAP and SNAP-FS may serve as a novel NO delivery system for therapeutics aimed at inhibiting HSC tubulogenesis-based therapy of chronic liver diseases. The unique functionality of the gold and silica nanoparticle mediated DDS may represent a new alternative therapeutic approach for the targeted delivery of NO in vivo.
Supplementary Material
Acknowledgments
The authors are also grateful to J Charlesworth of the EM Core Facility at Mayo Clinic for the TEM analysis.
Funding support. This work was supported by UOFMN-MEDICA#5P1, a grant from Minnesota Partnership for translational Nanotechnology in Cancer to PM; NIH R01 DK 59615, R01 HL 86990 and P30 DK 084567—Clinical Core to VHS; a generous gift from Bruce and Martha Atwater, and UOFMN-MEDICA#5CA, a grant from ‘Minnesota Partnership for translational Nanotechnology in Cancer’ to DM; and a Pilot and Feasibility Award by Mayo Clinic Center on Cell Signaling in Gastroenterology to AD.
Footnotes
Online supplementary data available from stacks.iop.org/Nano/21/305102/mmedia (Some figures in this article are in colour only in the electronic version)
References
- 1.Theodorakis NG, Wang YN, Wu JM, Maluccio MA, Sitzmann JV, Skill NJ. Role of endothelial nitric oxide synthase in the development of portal hypertension in the carbon tetrachloride-induced liver fibrosis model. Am. J. Physiol. Gastrointest. Liver Physiol. 2009;297:G792–G799. doi: 10.1152/ajpgi.00229.2009. [DOI] [PubMed] [Google Scholar]
- 2.Abraldes JG, Iwakiri Y, Loureiro-Silva M, Haq O, Sessa WC, Groszmann RJ. Mild increases in portal pressure upregulate vascular endothelial growth factor and endothelial nitric oxide synthase in the intestinal microcirculatory bed, leading to a hyperdynamic state. Am. J. Physiol. Gastrointest. Liver Physiol. 2006;290:G980–G987. doi: 10.1152/ajpgi.00336.2005. [DOI] [PubMed] [Google Scholar]
- 3.Rockey DC, Chung JJ. Reduced nitric oxide production by endothelial cells in cirrhotic rat liver: Endothelial dysfunction in portal hypertension. Gastroenterology. 1998;114:344–351. doi: 10.1016/s0016-5085(98)70487-1. [DOI] [PubMed] [Google Scholar]
- 4.Langer DA, Das A, Semela D, Kang-Decker N, Hendrickson H, Bronk SF, Katusic ZS, Gores GJ, Shah VH. Nitric oxide promotes caspase-independent hepatic stellate cell apoptosis through the generation of reactive oxygen species. Hepatology. 2008;47:1983–1993. doi: 10.1002/hep.22285. [DOI] [PMC free article] [PubMed] [Google Scholar]
- 5.Taura K, et al. Hepatic stellate cells secrete angiopoietin 1 that induces angiogenesis in liver fibrosis. Gastroenterology. 2008;135:1729–1738. doi: 10.1053/j.gastro.2008.07.065. [DOI] [PubMed] [Google Scholar]
- 6.Lee JS, Kang Decker N, Chatterjee S, Yao J, Friedman S, Shah V. Mechanisms of nitric oxide interplay with Rho GTPase family members in modulation of actin membrane dynamics in pericytes and fibroblasts. Am. J. Pathol. 2005;166:1861–1870. doi: 10.1016/S0002-9440(10)62495-9. [DOI] [PMC free article] [PubMed] [Google Scholar]
- 7.Perri RE, Langer DA, Chatterjee S, Gibbons SJ, Gadgil J, Cao S, Farrugia G, Shah VH. Defects in cGMP-PKG pathway contribute to impaired NO-dependent responses in hepatic stellate cells upon activation. Am. J. Physiol. Gastrointest. Liver Physiol. 2006;290:G535–G542. doi: 10.1152/ajpgi.00297.2005. [DOI] [PubMed] [Google Scholar]
- 8.Kang-Decker N, Cao S, Chatterjee S, Yao J, Egan LJ, Semela D, Mukhopadhyay D, Shah V. Nitric oxide promotes endothelial cell survival signaling through S-nitrosylation and activation of dynamin-2. J. Cell Sci. 2007;120:492–501. doi: 10.1242/jcs.03361. [DOI] [PubMed] [Google Scholar]
- 9.Wilson M, Kannangara K, Smith G, Simmons M, Raguse B. Nanotechnology–Basic Science and Emerging Technologies. London: Chapman-Hall; 2002. [Google Scholar]
- 10.Patra CR, Bhattacharya R, Mukhopadhyay D, Mukherjee P. Application of gold nanoparticles for targeted therapy in cancer. J. Biomed. Nanotechnol. 2008;4:99–132. [Google Scholar]
- 11.Bruchez M, Jr, Moronne M, Gin P, Weiss S, Alivisatos AP. Semiconductor nanocrystals as fluorescent biological labels. Science. 1998;281:2013–2016. doi: 10.1126/science.281.5385.2013. [DOI] [PubMed] [Google Scholar]
- 12.Alivisatos P. The use of nanocrystals in biological detection. Nat. Biotechnol. 2004;22:47–52. doi: 10.1038/nbt927. [DOI] [PubMed] [Google Scholar]
- 13.Webster TJ. Nanomedicine: what’s in a definition? Int. J. Nanomed. 2006;1:115–116. doi: 10.2147/nano.2006.1.2.115. [DOI] [PMC free article] [PubMed] [Google Scholar]
- 14.Thrall JH. Nanotechnology and medicine. Radiology. 2004;230:315–8. doi: 10.1148/radiol.2302031698. [DOI] [PubMed] [Google Scholar]
- 15.Patra CR, Bhattacharya R, Patra S, Basu S, Mukherjee P, Mukhopadhyay D. Inorganic phosphate nanorods are a novel fluorescent label in cell biology. J. Nanobiotechnol. 2006;4:11. doi: 10.1186/1477-3155-4-11. [DOI] [PMC free article] [PubMed] [Google Scholar]
- 16.Patra CR, Bhattacharya R, Patra S, Vlahakis NE, Gabashvili A, Koltypin Y, Gedanken A, Mukherjee P, Mukhopadhyay D. Pro-angiogenic properties of europium(III) hydroxide nanorods. Adv. Mater. 2008;20:753–756. [Google Scholar]
- 17.Michalet X, Pinaud FF, Bentolila LA, Tsay JM, Doose S, Li JJ, Sundaresan G, Wu AM, Gambhir SS, Weiss S. Quantum dots for live cells, in vivo imaging, and diagnostics. Science. 307:538–544. doi: 10.1126/science.1104274. [DOI] [PMC free article] [PubMed] [Google Scholar]
- 18.Medintz IL, Uyeda HT, Goldman ER, Mattoussi H. Quantum dot bioconjugates for imaging, labelling and sensing. Nat. Mater. 2005;4:435–446. doi: 10.1038/nmat1390. [DOI] [PubMed] [Google Scholar]
- 19.Patra CR, Moneim SSA, Wang E, Dutta S, Patra S, Eshed M, Mukherjee P, Gedanken A, Shah VH, Mukhopadhyay D. In vivo toxicity studies of europium hydroxide nanorods in mice. Toxicol. Appl. Pharmacol. 2009;240:88–98. doi: 10.1016/j.taap.2009.07.009. [DOI] [PMC free article] [PubMed] [Google Scholar]
- 20.Patra CR, Bhattacharya R, Mukhopadhyay D, Mukherjee P. Fabrication of gold nanoparticles for targeted therapy in pancreatic cancer. Adv. Drug Deliv. Rev. 2010;62:346–361. doi: 10.1016/j.addr.2009.11.007. [DOI] [PMC free article] [PubMed] [Google Scholar]
- 21.Patra CR, et al. Targeted delivery of gemcitabine to pancreatic adenocarcinoma using cetuximab as a targeting agent. Cancer Res. 2008;68:1970–1978. doi: 10.1158/0008-5472.CAN-07-6102. [DOI] [PubMed] [Google Scholar]
- 22.Hainfeld JF, Slatkin DN, Focella TM, Smilowitz HM. Gold nanoparticles: a new X-ray contrast agent. Br. J. Radiol. 2006;79:248–253. doi: 10.1259/bjr/13169882. [DOI] [PubMed] [Google Scholar]
- 23.Murphy CJ, Gole AM, Stone JW, Sisco PN, Alkilany AM, Goldsmith EC, Baxter SC. Gold Nanoparticles in biology: beyond toxicity to cellular imaging. Acc. Chem. Res. 2008;41:1721–1730. doi: 10.1021/ar800035u. [DOI] [PubMed] [Google Scholar]
- 24.Connor EE, Mwamuka J, Gole A, Murphy CJ, Wyatt MD. Gold nanoparticles are taken up by human cells but do not cause acute cytotoxicity. Small. 2005;1:325–327. doi: 10.1002/smll.200400093. [DOI] [PubMed] [Google Scholar]
- 25.Sandhu KK, McIntosh CM, Simard JM, Smith SW, Rotello VM. Gold nanoparticle-mediated transfection of mammalian cells. Bioconjug. Chem. 2002;13:3–6. doi: 10.1021/bc015545c. [DOI] [PubMed] [Google Scholar]
- 26.Rigby P. Silica nanoparticles target cancer cells. Nano. Today. 2007;2:12–12. [Google Scholar]
- 27.Rosenholm JM, Meinander A, Peulhu E, Niemi R, Eriksson JE, Sahlgren C, Linden M. Targeting of Porous Hybrid Silica Nanoparticles to Cancer Cells. ACS Nano. 2009;3:197–206. doi: 10.1021/nn800781r. [DOI] [PubMed] [Google Scholar]
- 28.Wu P, He XX, Wang KM, Tan WH, Ma D, Yang WH, He CM. Imaging breast cancer cells and tissues using peptide-labeled fluorescent silica nanoparticles. J. Nanosci. Nanotechnol. 2008;8:2483–2487. doi: 10.1166/jnn.2008.362. [DOI] [PubMed] [Google Scholar]
- 29.Frost MC, Meyerhoff ME. Synthesis, characterization, and controlled nitric oxide release from S-nitrosothiol-derivatized fumed silica polymer filler particles. J. Biomed. Mater. Res. A. 2005;72A:409–419. doi: 10.1002/jbm.a.30275. [DOI] [PubMed] [Google Scholar]
- 30.Slowing II, Vivero-Escoto JL, Wu CW, Lin VSY. Mesoporous silica nanoparticles as controlled release drug delivery and gene transfection carriers. Adv. Drug Deliv. Rev. 2008;60:1278–1288. doi: 10.1016/j.addr.2008.03.012. [DOI] [PubMed] [Google Scholar]
- 31.Barbe C, Bartlett J, Kong LG, Finnie K, Lin HQ, Larkin M, Calleja S, Bush A, Calleja G. Silica particles: a novel drug-delivery system. Adv. Mater. 2004;16:1959–1966. [Google Scholar]
- 32.Bhattacharya R, et al. Attaching folic acid on gold nanoparticles using noncovalent interaction via different polyethylene glycol backbones and targeting of cancer cells. Nanomed.-Nanotechnol. Biol. Med. 2007;3:224–238. [Google Scholar]
- 33.Patra CR, Verma R, Kumar S, Greipp PR, Mukhopadhyay D, Mukherjee P. Fabrication of gold nanoparticle for potential application in multiple myeloma. J. Biomed. Nanotechnol. 2008;4:499–507. [Google Scholar]
- 34.Patra CR, Cao S, Safgren S, Hattacharya R, Ames MM, Shah V, Reid JM, Mukherjee P. Intracellular fate of a targeted delivery system. J. Biomed. Nanotechnol. 2008;4:508–514. [Google Scholar]
- 35.Vercelino R, Crespo I, de Souza GF, Cuevas MJ, de Oliveira MG, Marroni NP, González-Gallego J, Tuñón MJ. S-nitroso-N-acetylcysteine attenuates liver fibrosis in cirrhotic rats. J. Mol. Med. 2010;88:401–411. doi: 10.1007/s00109-009-0577-6. [DOI] [PubMed] [Google Scholar]
- 36.Semela D, Das A, Langer D, Kang NL, Leof E, Shah V. Platelet-derived growth factor signaling through ephrin-B2 regulates hepatic vascular structure and function. Gastroenterology. 2008;135:671–679. doi: 10.1053/j.gastro.2008.04.010. [DOI] [PMC free article] [PubMed] [Google Scholar]
- 37.Das A, Yaqoob U, Mehta D, Shah VH. FXR promotes endothelial cell motility through coordinated regulation of FAK and MMP-9. Arterioscler. Thromb. Vasc. Biol. 2009;29:562–570. doi: 10.1161/ATVBAHA.108.182725. [DOI] [PMC free article] [PubMed] [Google Scholar]
- 38.Spurr AR. A low viscosity epoxy resin embedding medium for electron microscopy. J. Ultrastruct. Res. 1969;26:31–36. doi: 10.1016/s0022-5320(69)90033-1. [DOI] [PubMed] [Google Scholar]
- 39.McDowell EM, Trump BF. Histologic fixatives suitable for. diagnostic light and electron microscopy. Arch. Pathol. Lab. Med. 1976;100:405–414. [PubMed] [Google Scholar]
- 40.Chatterjee S, Cao S, Peterson TE, Simari RD, Shah V. Inhibition of GTP-dependent vesicle trafficking impairs internalization of plasmalemmal eNOS and cellular nitric oxide production. J. Cell Sci. 2003;116:3645–3655. doi: 10.1242/jcs.00664. [DOI] [PubMed] [Google Scholar]
- 41.Daniel MC, Astruc D. Gold nanoparticles: assembly, supramolecular chemistry, quantumsize-related properties, and applications toward biology, catalysis, and nanotechnology. Chem. Rev. 2004;104:293–346. doi: 10.1021/cr030698+. [DOI] [PubMed] [Google Scholar]
- 42.Zhang YM, Wang H, Li JR, Jimenez DA, Levitan ES, Aizenman E, Rosenberg PA. Peroxynitrite-induced neuronal apoptosis is mediated by intracellular zinc release and 12-lipoxygenase activation. J. Neurosci. 2004;24:10616–10627. doi: 10.1523/JNEUROSCI.2469-04.2004. [DOI] [PMC free article] [PubMed] [Google Scholar]
- 43.Leshem YY, Haramaty E. The characterization and contrasting effects of the nitric oxide free radical in vegetative stress and senescence of Pisum sativum Linn foliage. J. Plant Physiol. 1996;148:258–263. [Google Scholar]
- 44.Mangeney C, Ferrage F, Aujard I, Marchi-Artzner V, Jullien L, Ouari O, Rekai ED, Laschewsky A, Vikholm I, Sadowski JW. Synthesis and properties of water-soluble gold colloids covalently derivatized with neutral polymer monolayers. J. Am. Chem. Soc. 2002;124:5811–5821. doi: 10.1021/ja010796h. [DOI] [PubMed] [Google Scholar]
Associated Data
This section collects any data citations, data availability statements, or supplementary materials included in this article.


