Abstract
Background
Several studies have suggested that neuron-specific enolase (NSE) in serum may be a biomarker of traumatic brain injury. However, whether serum NSE levels correlate with outcomes remains unclear. The purpose of this review was to evaluate the prognostic value of serum NSE protein after traumatic brain injury.
Methods
PubMed and Embase were searched for relevant studies published up to October 2013. Full-text publications on the relationship of NSE to TBI were included if the studies concerned patients with closed head injury, NSE levels in serum after injury, and Glasgow Outcome Scale (GOS) or Extended GOS (GOSE) scores or mortality. Study design, inclusion criteria, assay, blood sample collection time, NSE cutoff, sensitivity and specificity of NSE for mortality prediction (if sufficient information was provided to calculate these values), and main outcomes were recorded.
Results
Sixteen studies were eligible for the current meta-analysis. In the six studies comparing NSE concentrations between TBI patients who died and those who survived, NSE concentrations correlated with mortality (M.D. 0.28, 95% confidence interval (CI), 0.21 to 0.34; I2 55%). In the eight studies evaluating GOS or GOSE, patients with unfavorable outcomes had significantly higher NSE concentrations than those with favorable outcomes (M.D. 0.24, 95% CI, 0.17 to 0.31; I2 64%). From the studies providing sufficient data, the pooled sensitivity and specificity for mortality were 0.79 and 0.50, and 0.72 and 0.66 for unfavorable neurological prognosis, respectively. The areas under the SROC curve (AUC) of NSE concentrations were 0.73 (95% CI, 0.66–0.80) for unfavorable outcome and 0.76 (95% CI, 0.62–0.90) for mortality.
Conclusions
Mortality and unfavorable outcome were significantly associated with greater NSE concentrations. In addition, NSE has moderate discriminatory ability to predict mortality and neurological outcome in TBI patients. The optimal discrimination cutoff values and optimal sampling time remain uncertain because of significant variations between studies.
Introduction
Traumatic brain injury (TBI) is a common public health and socio-economic problem worldwide. TBI is a major cause of death and lifelong disability, especially among young adults [1]. Despite recent improvements in management of TBI in intensive care and the development of standardized guidelines, mortality and morbidity in these patients remain high [2]. Early determination of prognosis based on epidemiological data is key to inform care of these patients [3], but current prognostic models based on demographics, clinical examination, and radiological imaging have limited predictive capacity [4]. Thus, other prognostic indicators may be more useful for early prediction of outcomes in TBI patients [5].
Over the past several years, biomarkers of brain injury have been increasingly investigated as potential tools for prognostic evaluation [6]–[7]. Neuron-specific enolase (NSE), first described by Moore and McGregor in 1965[8], is a 78-kDa dimeric γ-isoenzyme of the glycolytic enzyme enolase, localized predominately in the cytoplasm of neurons, which participates in slow axoplasmic transport [9]–[10]. NSE is not normally secreted, but when axons are damaged, NSE is upregulated to maintain homeostasis [11]. Therefore, NSE is the only marker that directly assesses functional damage to neurons. For many TBI patients, especially the severe TBI, NSE value keeps high or increases secondarily and leads to a second peak value due to the secondary brain injury. In addition, in patients with widespread brain lesions and more and more serious secondary brain injury, NSE values are persistently elevated. Therefore, the NSE levels not only can reflect the extent of primary brain damage, but also reflect the progression of secondary damage. Accordingly, NSE has excellent theoretical potential as a long-term prognostic biomarker and therapeutic indicator in neurological intensive care [12]–[13]. Several studies have suggested increased NSE concentrations in blood following TBI, indicating a potential clinical role as a biomarker of this injury [14]–[17]. However, its association with outcome remains unclear. NSE is not often measured in clinical practice because it is not considered a standard indicator. Thus, we conducted a meta-analysis to evaluate the prognostic value of serum NSE concentrations after traumatic brain injury.
Methods
Data Sources and Search Strategy
Two investigators searched MEDLINE and EMBASE for relevant articles published up to October 2013 for the following Medical Headings and text words: “NSE,” “neuron specific enolase,” “craniocerebral trauma,” “closed head trauma,” “brain injuries,” “traumatic brain injury,” and related terms. The syntax for the MEDLINE searches was as follows: (NSE[Text Word]) OR (neuron specific enolase[Text Word]) AND ((“brain injuries”[MeSH Terms]) OR (“craniocerebral trauma”[MeSH Terms]) OR (“brain hemorrhage, traumatic”[MeSH Terms]) OR (“brain stem hemorrhage, traumatic”[MeSH Terms]) OR (“subarachnoid hemorrhage, traumatic”[MeSH Terms]) OR (closed head injury[Text Word]) OR (closed head trauma[Text Word]) OR (traumatic brain injury[Text Word]) OR (brain injury[Text Word]) OR (TBI[Text Word]) OR (CHI[Text Word])). We performed this relatively wide search to include the maximum number of relevant patients.
Study Selection
The reference lists of the included studies and review articles were also checked manually for further eligible studies. Full-text publications concerning the relationship of NSE to TBI outcomes were included if the studies contained patients with closed head injury, NSE levels in serum after injury, and GOS or GOSE scores or mortality. Included studies had to report both at least one outcome of interest and NSE concentrations in venous blood or arterial blood, measured quantitatively in the emergency room or the intensive care unit. Searches were restricted to English language literature on human subjects only. Abstracts or meeting proceedings were excluded.
Data Abstraction
Data were extracted independently by two reviewers and any uncertainties or disagreements were resolved by discussion. The following were recorded or calculated: first author, year of publication, study design, age of patients, inclusion criteria, assay, blood sample collection time, cutoff NSE value to distinguish between outcomes, sensitivity and specificity of prediction (if sufficient data were available), main outcome, and relevant results with respect to the key question, including predictive statistics. If certain key factors or data were missing, authors were contacted for clarification. In the case of multiple studies from the same research group, authors were also contacted to ensure unique patients. Because a cutoff of 20 µg/L has been reported independently by several research groups, results in relation to this level were extracted, if possible, to attempt an interpretation of data using the same cutoff.
Risk of Bias of Included Studies
The quality of the selected studies was assessed as recommended in the Standards for the Reporting of Diagnostic Accuracy (STARD) by using QUADAS-2 assessment tool [18].
Statistical Analysis
Statistical analyses were performed using Review Manager version 5.2 (Cochrane Collaboration, Oxford, UK), STATA version 10 (Stata Corp., College Station, TX) and Meta-DiSc version 1.4. All statistical tests were two sided, with P values less than 0.05 demonstrating statistical significance. Mean differences (M.D.s) were used for the analysis of continuous variables (NSE concentrations). The distribution of NSE concentrations was right-skewed and we thus log-transformed them to yield a normal distribution, facilitating analysis and distinction of outcomes between groups [19]. Therefore, a mean difference greater than 0 indicates that mean concentrations are higher in the group with unfavorable outcomes. The I-squared (I2) statistic was used to measure the extent of inconsistency among the results [20]. Heterogeneity was detected using the chi-squared (χ2) test. Because the χ2 test lacks power when the number of studies is small, we considered significant heterogeneity to be present when both the χ2 value was within the 10% level of significance (P<0.10) and the I2 value exceeded 50%. In cases of heterogeneity, summary measures of the effect of NSE on mortality or neurological outcome were obtained by conducting a random-effects meta-analysis of the best-effect estimate available from each study, which assumes that studies were a random sample of a hypothetical population of studies and assigns a weight to each study, taking into account variance within and between studies. Publication bias was assessed using the “funnel plot” technique, based on a graph plotting effect estimates against sample size.
By undertaking a bivariate regression approach, we calculated the pooled estimates of sensitivity (SEN) and specificity (SPE) for NSE as a predictor of mortality and GOS, and constructed hierarchical summary receiver operating characteristic (HSROC) curves [21]. Based on random-effects models, this bivariate approach investigates potential between-study heterogeneity and incorporates the possible correlation between SEN and SPE. Using the pooled SEN and SPE, positive and negative likelihood ratios (PLR and NLR, respectively) were also calculated. Heterogeneity was assessed by testing the inconsistency (I2) of the pooled SEN and SPE. We also computed discrimination threshold values for 100% specificity or 100% sensitivity for each of these studies.
Results
Study Selection
In total, 296 studies were examined and screened for retrieval using the strategy described above. After screening the title and abstract, 202 studies were excluded and 94 full manuscripts were investigated in detail. Based on the inclusion and exclusion criteria, 78 of those studies were excluded, and so 16 studies were eligible for the current review and meta-analysis, consisting of 711 patients (Fig. 1). The characteristics of these studies are presented in Table 1. All included studies were published, peer-reviewed papers.
Figure 1. Identification process for eligible studies.
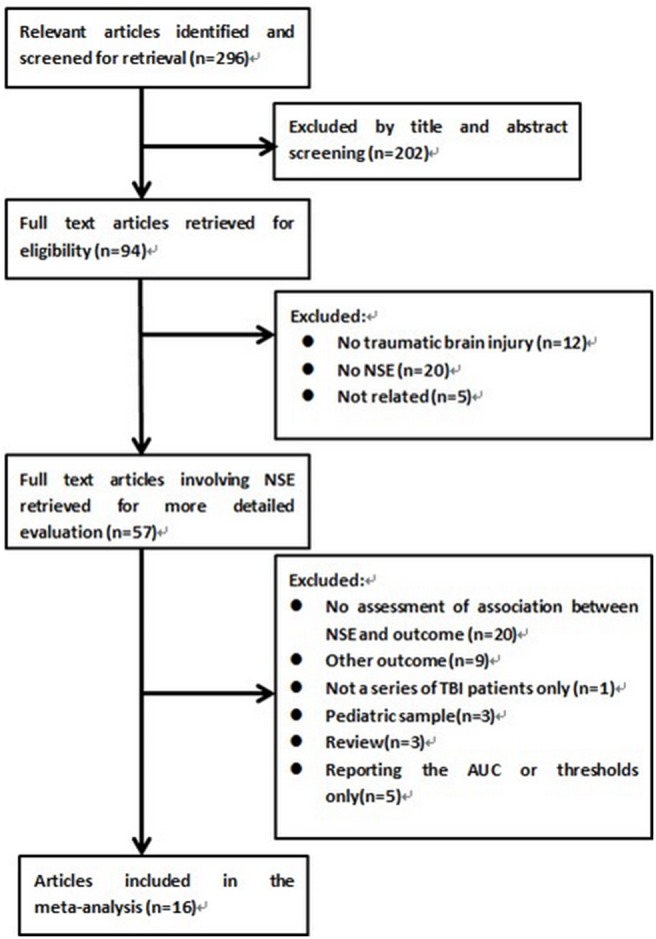
Of the 296 studies initially identified from our electronic search, 16 met the inclusion criteria and were included in this meta-analysis.
Table 1. Characteristics of the studies included in the meta-analysis of the prognostic value of NSE in patients with traumatic brain injury.
| Author,Number ofPatients | PublishedDate | StudyDesign | Inclusion criteria | Age(years)* | Assay | Blood samplecollection time | Sensitivity and Specificity | NSE cutoff | Main outcome |
| Vos et al [27] , n = 78 | 2004 | NR | GCS ≤8 after resuscitation.Admitted within 36 h afterinjury. | 32 (15–81) | LIA | Hospital admission | Reported | 21.7 µg/L | Mortality and GOS at 6 months: 1 deceased, 1–3 unfavourable, 4–5 favourable |
| Li et al [26] , n = 40 | 2004 | Prospectivecohort | GCS ≤8. No severe systemicinjury. No heart or renalfailure. No severe infectionof central nervous system | NR | RIA | 12 hours after injury | Reported | 20/30 µg/L | GOS at 6 months: 1–3 unfavourable, 4–5 favourable |
| Raabe et al [24] , n = 82 | 1999 | Prospectivecohort | GCS ≤8 after resuscitation.Admitted to neurosurgical ICU | 38(16–85) | RIA | Hospital admissionand every 24 h fora maximum of 10consecutive days | Reported | 20/30/100 µg/L | GOS at 6 months: 1–3 unfavourable, 4–5 favourable |
| Stein et al [30] , n = 24 | 2012 | Prospectivecohort | Age >17. Admission withinfirst 6 h after injury. GCSscore <9 on admission.Placement of clinicallyindicated ICP monitor | 30.7±12.3 | ELISA | Hospital admissionand twice daily atstandard times for7 days | Not reported | NR | GOSE at 3 months, 6 months and 1 year: 1–4 unfavourable, 5–8 favourable |
| Woertgen et al [25] , n = 30 | 1997 | Prospectivecohor | GCS ≤8. Admitted between1–6 h after injury. No spinalcord injury. No history ofneurological disease. Noresuscitation or shock | 32(17–73) | RIA | Hospital admission(mean 2.5 hours), 6,12, and 24 hours aftertrauma and every 24hours up to the fifth dayafter injury. | Not reported | NR | GOS at discharge: 1–2 unfavourable,3–5 favourable |
| Dauberschmidt et al [32] , n = 9 | 1983 | NR | Cerebral coma (GlasgowComa Scale: 4 points) aftersevere head trauma | 20–69 | RIA | initial value | Reported | 20 µg/L | Mortality at discharge |
| Baker et al [28] , n = 64 | 2009 | Randomizedcontrolled trial | Glasgow Coma Scale (GCS)score≤8. No primary penetratinginjury, previous intravenoustherapy <50 mL, a time intervalbetween arrival at scene andintravenous access≤4 h,age≥16 years | 41.4±18.8(18.3–87.9) | ELISA | ED admission, andsubsequently at 12, 24,and 48 hpost-resuscitation | Not reported | NR | Mortality at discharge |
| Meric et al [35] , n = 20 | 2010 | Prospectivecohort | Glasgow Coma Scale (GCS)score≤8 | 31(18–88) | ECLIA | Admission | Reported | 20 µg/L | Mortality and GOS at 30 days: 1 deceased, 1–3 unfavourable, 4–5 favourable |
| Guan et al [37] , n = 41 | 2003 | Prospectivecohort | Glasgow Coma Scale (GCS)score≤8.admission within 6 hoursafter injury; closed TBI, nohistory of disease of vital organssuch as heart, brain, and kidney. | 44(5–92) | ELISA | Hospital admission andevery 24 hours thereafterfor a maximum of 10consecutive days | Reported | 60 µg/L | Mortality and GOS at 6 months: 1 deceased, 1–3unfavourable, 4–5 favourable |
| Olivecrona et al [29] , n = 48 | 2009 | Prospectivecohort | Verified head injury, GCS (8 atthe time of sedation and intubation, age between 15 and 70 years, initialcerebral perfusion pressure (CPP)of >10 mm Hg and arrival in ourdepartment within 24 h of the trauma. | 30.5 (15–63) | LIAISON | Hospital admission | Reported | 9.52 µg/L/11.62 µg/L | Mortality and GOS at 3 Months and 12 months: 1 deceased, 1–3 unfavourable, 4–5 favourable |
| McKeating et al [31] , n = 21 | 1998 | NR | GCS 3–13 | 35(17–69) | RIA | On admission, at 24 hours,48 hours and 96 hours | Reported | 20 µg/L | GOS at 6 Months: 1–3 unfavourable, 4–5 favourable |
| Gradisek et al [33] , n = 84 | 2012 | NR | Glasgow Coma Scale≤12 afterresuscitation and was verified byCT within 2 hours of injury. Onlythe patients with GCS≤8 (n = 65, 77%)after resuscitation in the emergencyroom (ER) or those whose GCSdeteriorated to≤8 within 24 hoursafter hospital admission (n = 19, 23%)were included in the study. | 46 (15–87) | LIA | At admission in the ERand then 6, 12, 24, 48,72and 96 hours post-injury | Not reported | NR | Mortality and GOS at 12 months: 1 deceased, 1–3 unfavourable, 4–5 favourable |
| Ross et al [17] , n = 9 | 1996 | NR | Admission within 24 h of severehead injury | 21.5(16–38.5) | RIA | Initial sample | Reported | 20 µg/L | GOS at discharge: 1–3 unfavourable, 4–5 favourable |
| Sogut et al [36] , n = 100 | 2010 | Prospectivecohort | Head trauma as the primary injury;a history of posttraumatic loss ofconsciousness or amnesia; consentprovided by the patient or their legalguardian. | 18.05±13.83 | ECLIA | Within 12 h after thehead injury | Not reported | NR | Mortality in the early posttraumaticperiod |
| Yamazaki et al [34] , n = 17 | 1995 | NR | GCS 3–15 | 45(14–91) | RIA | 1.5–8.0 hours after injury | Reported | 20 µg/L | Mortality at discharge |
| Raabe et al [23] , n = 44 | 1998 | Prospectivecohort | Glasgow Coma Scale (GCS)score≤8 | 41(16–83) | RIA | 6±24 (median 12 hours)after admission | Not reported | NR | GOS at 6 Months: 1–3 unfavourable, 4–5 favourable |
ECLIA = electrochemiluminescence immunoassay; ELISA = enzyme linked immunosorbant assay; LIA = luminescence immunoassay; RIA = radioimmunoassay; GCS = Glasgow coma scale; GOS = Glasgow outcome scale; GOSE = extended Glasgow outcome scale; NR = not reported. *Median (range) or Mean ± standard deviation.
Study Characteristics
Fifteen studies were observational and one was a randomized controlled trial. The number of TBI patients included in the cohorts ranged from 9 to 100. Only one study reported the proportion of patients with isolated TBI, which represented 9% of its sample. The main outcome measures presented were the Glasgow outcome score (GOS) (11 studies), Glasgow outcome score extended (GOSE) (one study), and mortality (9 studies). The time of evaluation of main outcome was at discharge (six studies), 1 month (one study), 3 months (one study), 6 months (six studies), and 12 months after injury (three studies); five studies presented data from multiple time points after injury and eleven studies presented individual patient data. The site of sampling for measurement of serum NSE concentrations was venous (15 studies) or arterial (1 study). Eight studies used the radioimmunoassay (RIA) (total of 252 patients), two used a luminescent immunoassay (LIA) (162 patients), three used enzyme-linked immunosorbent assays (ELISA) (129 patients), two used electrochemiluminescent immunoassays (ECLIA) (120 patients), and the final study used a LIAISON assay (48 patients). Two studies included patients with mild TBI, two included cases of moderate TBI, and twelve included only severe TBI. Fourteen studies presented the initial NSE concentration of serial samples, five presented the peak concentration, and one presented the mean concentration. In 10 of the studies, data concerning a cutoff value of NSE concentration allowed analysis of the discriminative capacity of NSE concentration to predict mortality and neurological outcome. In addition, 12 studies presented the median and interquartile range of NSE concentrations, enabling analysis of the pooled value.
Methodological Quality of Included Studies
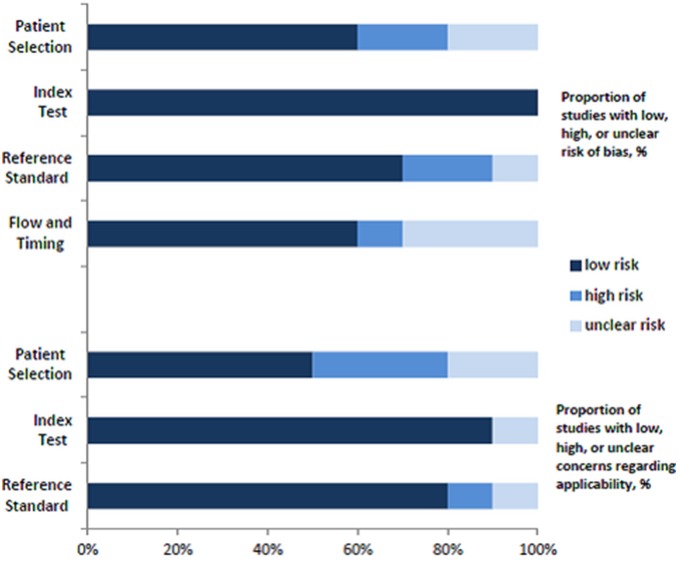
Sixteen studies examined risk of bias and applicability using a modified QUADAS-2 assessment. Figure 2 presents a more complete evaluation of the methodological quality and risk of bias. Outcome assessment was blinded from NSE concentrations in 4 studies.
Figure 2. Risk of bias and applicability concerns of included studies examining role of NSE concentrations in prognosis in patients with traumatic brain injury.
Data Synthesis and Meta-Analysis
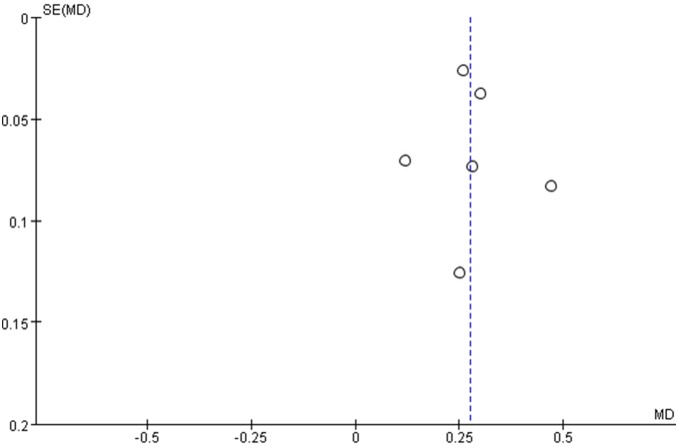
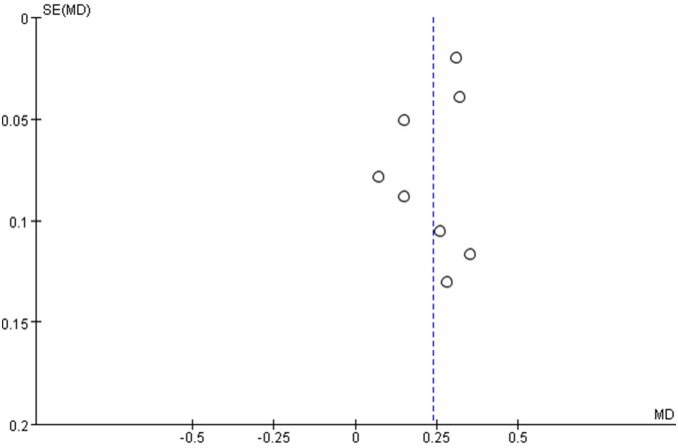
The meta-analysis revealed significant positive associations between serum concentrations of NSE and outcome. Six studies compared NSE concentrations between patients who died and those who survived; NSE concentrations were significantly higher among patients who died (M.D. 0.28, 95% confidence interval 0.21 to 0.34; I2 55%; Fig. 3). In the eight studies that evaluated GOS or GOSE, patients with unfavorable outcomes had significantly higher NSE concentrations than those with favorable outcomes (M.D. 0.24, 95% confidence interval 0.17 to 0.31; I2 64%; Fig. 4). The results were consistent in all sensitivity analyses. In mortality and outcome subgroup analyses, heterogeneity was lower among patients evaluated at the same time post-injury (Tables 2 and 3). Analysis of outcome subgroups also revealed lower heterogeneity among patients with minimally severe injury (Table 3). No publication bias was detected by the funnel plots (Figs. 5 and 6).
Figure 3. Association between NSE (shown as mean (SD) in transformed concentration) and mortality in patients with traumatic brain injury.

Figure 4. Association between NSE (shown as mean (SD) in transformed concentration) and unfavourable outcome in patients with traumatic brain injury.

Table 2. Sensitivity analyses for association of NSE concentrations with mortality in patients with traumatic brain injury.
| No of studies | MD (95% Cl) | I2 (%) | |
| Minimal severity of traumatic brain injury: | |||
| Mild | 2 | 0.37 [0.21, 0.53] | 71 |
| Moderate | 1 | 0.12 [-0.02, 0.26] | – |
| Severe | 3 | 0.26 [0.21, 0.31] | 0 |
| Assay: | |||
| ELISA | 1 | 0.26 [0.21, 0.31] | – |
| RIA | 2 | 0.37 [0.18, 0.56] | 66 |
| LIA | 2 | 0.15 [0.03, 0.27] | 0 |
| ECLIA | 1 | 0.30 [0.23, 0.37] | – |
| Prognostic evaluation time: | |||
| At discharge | 4 | 0.30 [0.24, 0.37] | 50 |
| 6 months | 1 | 0.25 [0.00, 0.50] | – |
| 12 months | 1 | 0.12 [-0.02, 0.26] | – |
| Blood sample type: | |||
| Arterial | 0 | – | – |
| Venous | 6 | 0.28 [0.21, 0.34] | 55 |
| Concentration measurement type: | |||
| Initial concentrations | 5 | 0.28 [0.18, 0.39] | 63 |
| Peak concentrations | 2 | 0.26 [0.21, 0.31] | 0 |
| Mean daily concentrations | 0 | – | – |
| Isolated traumatic brain injury: | |||
| Isolated | 1 | 0.26 [0.21, 0.31] | – |
| Multiple trauma or unspecified | 5 | 0.28 [0.18, 0.39] | 63 |
ECLIA = electrochemiluminescence immunoassay; ELISA = enzyme linked immunosorbant assay; LIA = luminescence immunoassay; RIA = radioimmunoassay.
Table 3. Sensitivity analyses for association of NSE concentrations with unfavourable outcome in patients with traumatic brain injury.
| No of studies | MD (95% Cl) | I2 (%) | |
| Minimal severity of traumatic brain injury: | |||
| Mild | 0 | – | – |
| Moderate | 1 | 0.07 [-0.08, 0.22] | – |
| Severe | 7 | 0.26 [0.20, 0.33] | 50 |
| Assay: | |||
| ELISA | 2 | 0.31 [0.27, 0.35] | 0 |
| RIA | 4 | 0.24 [0.13, 0.35] | 67 |
| LIA | 2 | 0.15 [-0.03, 0.34] | 52 |
| ECLIA | 0 | – | – |
| Prognostic evaluation time: | |||
| At discharge | 1 | 0.15 [0.05, 0.25] | – |
| 6 months | 5 | 0.31 [0.27, 0.34] | 0 |
| 12 months | 2 | 0.15 [-0.05, 0.35] | 48 |
| Sample type: | |||
| Arterial | 1 | 0.28 [0.02, 0.54] | – |
| Venous | 7 | 0.24 [0.16, 0.31] | 69 |
| Concentration measurement type: | |||
| Initial concentrations | 7 | 0.23 [0.15, 0.31] | 69 |
| Peak concentrations | 4 | 0.30 [0.13, 0.47] | 86 |
| Mean daily concentrations | 1 | 0.09 [-0.16, 0.34] | – |
| Isolated traumatic brain injury: | |||
| Isolated | 0 | – | – |
| Multiple trauma or unspecified | 8 | 0.24 [0.17, 0.31] | 64 |
ECLIA = electrochemiluminescence immunoassay; ELISA = enzyme linked immunosorbant assay; LIA = luminescence immunoassay; RIA = radioimmunoassay.
Figure 5. Funnel plot for the studies included to analysis the association between NSE concentration and mortality in patients with traumatic brain injury.
Figure 6. Funnel plot for the studies included to analysis the association between NSE concentration and unfavourable outcome in patients with traumatic brain injury.
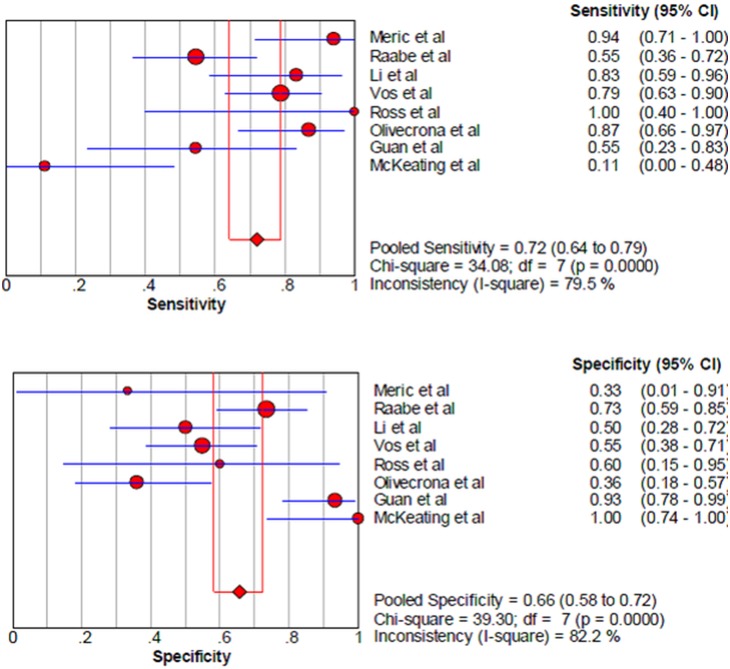
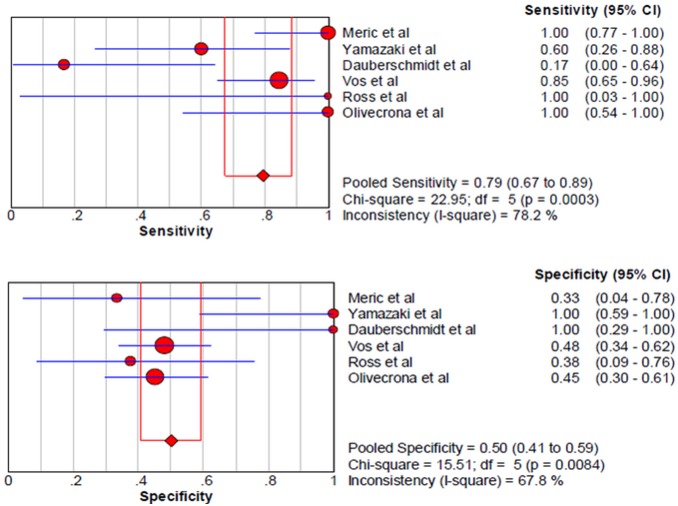
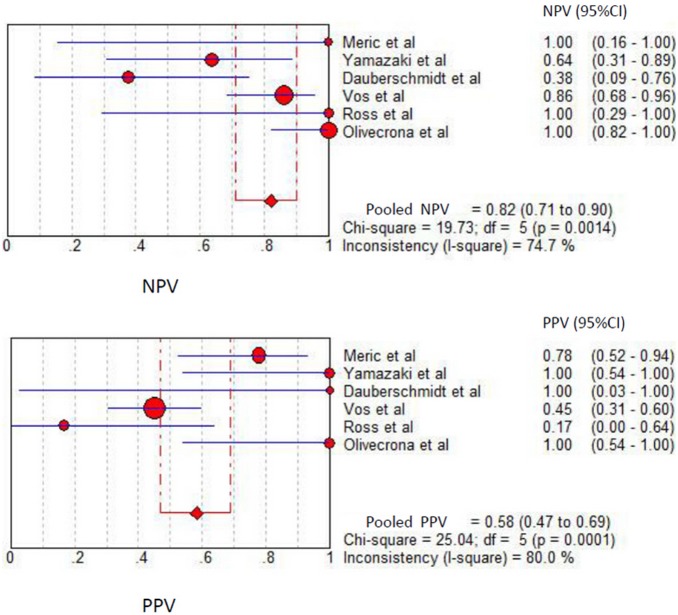
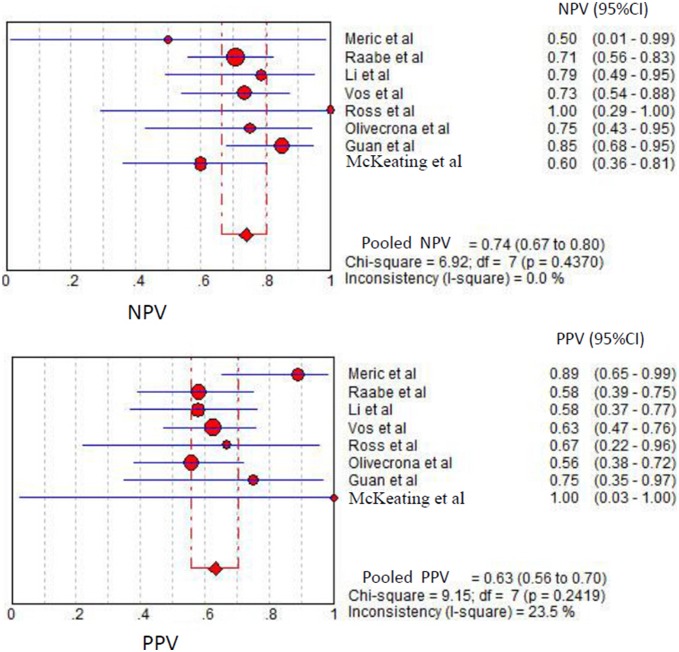
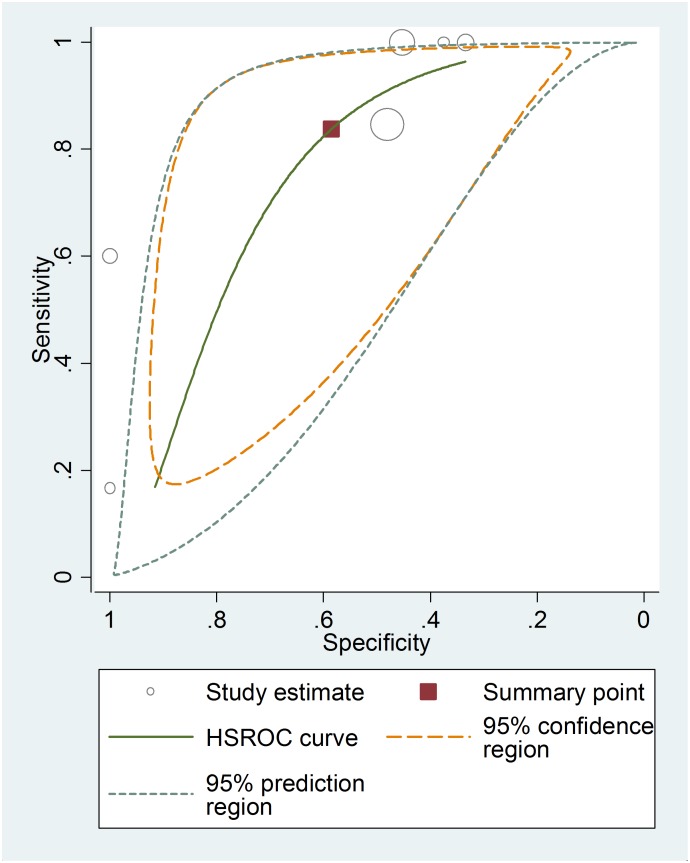
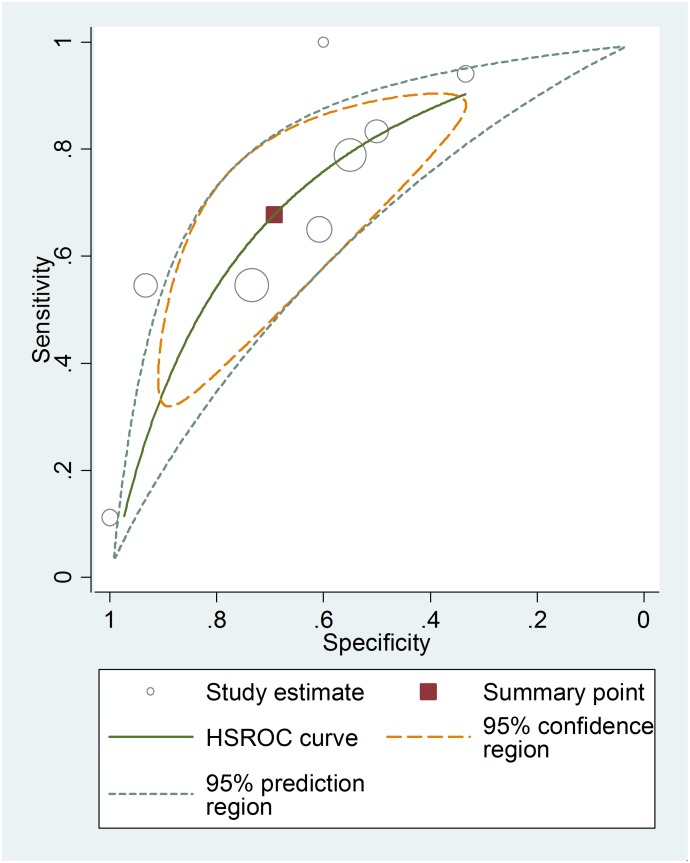
Among the studies presenting sufficient data for calculation, the pooled sensitivity and specificity for unfavorable neurological prognosis (GOS ≤3 or GOSE ≤4) was 0.72 (95% CI 0.64–0.79) and 0.66 (95% CI 0.58–0.72), respectively (eight studies) (Fig. 7). The pooled sensitivity and specificity for mortality was 0.79 (95% confidence interval (CI) 0.67–0.89) and 0.50 (95% CI 0.41–0.59), respectively (six studies) (Fig. 8). The results were consistent in all subgroup analyses. Heterogeneity was not influenced by any of these covariates (Tables 4 and 5). All I2 values were above 50%, indicating substantial heterogeneity among studies for all modalities. In addition, the pooled positive predictive value (PPV) and negative predictive value (NPV) for mortality was 0.58 (95% confidence interval (CI) 0.47–0.69) and 0.82 (95% CI 0.71–0.90), respectively (Fig. 9). The pooled PPV and NPV for unfavorable neurological prognosis was 0.63 (95% CI 0.56–0.70) and 0.74 (95% CI 0.67–0.80), respectively (Fig. 10). The HSROC curve represents the relationship between specificity and sensitivity across studies, revealing any threshold effects. Based on the bivariate approach, which estimates not only the strength but also the shape of the correlation between specificity and sensitivity, a 95% confidence ellipse and a 95% prediction ellipse were drawn (Figs. 11 and 12). The area under the SROC curve (AUC) was 0.73 (95% CI 0.66–0.80) for unfavorable outcome and 0.76 (95% CI 0.62–0.90) for mortality, signifying a moderate discriminatory ability of NSE concentrations.
Figure 7. The pooled sensitivity and specificity to predict unfavourable outcome in patients with traumatic brain injury.
Figure 8. The pooled sensitivity and specificity to predict mortality in patients with traumatic brain injury.
Table 4. Sensitivity analyses for the sensitivity and specificity of NSE concentrations to predict the mortality in patients with traumatic brain injury.
| No of studies | Sensitivity | I2 (%) | Specificity | I2 (%) | |
| Minimal severity of traumatic brain injury: | |||||
| Mild | 1 | 0.6 | – | 1 | – |
| Moderate | 0 | – | – | – | – |
| Severe | 5 | 0.830(0.702–0.919) | 80.5 | 0.468(0.373–0.566) | 25.4 |
| Assay: | |||||
| Liason | 1 | 1 | – | 0.452 | – |
| RIA | 3 | 0.471(0.230–0.722) | 56.9 | 0.722(0.465–0.903) | 81.3 |
| LIA | 1 | 0.846 | – | 0.481 | – |
| ECLIA | 1 | 1 | – | 0.333 | – |
| Prognostic evaluation time: | |||||
| At discharge | 3 | 0.471(0.230–0.722) | 56.9 | 0.722(0.465–0.903) | 81.3 |
| 1 month | 1 | 1 | – | 0.333 | – |
| 3 months | 1 | 1 | – | 0.452 | – |
| 6 months | 1 | 0.846 | – | 0.481 | – |
| 12 months | 1 | 1 | – | 0.45 | – |
| Cutoff: | |||||
| 20 µg/L | 4 | 0.710(0.520–0.858) | 83.8 | 0.625(0.406–0.812) | 77.8 |
| Others | 2 | 0.875(0.710–0.965) | 44.1 | 0.468(0.364–0.574) | 0 |
ECLIA = electrochemiluminescence immunoassay; ELISA = enzyme linked immunosorbant assay; LIA = luminescence immunoassay; RIA = radioimmunoassay.
Table 5. Sensitivity analyses for the sensitivity and specificity of NSE concentrations to predict unfavourable outcome in patients with traumatic brain injury.
| No of studies | Sensitivity | I2 (%) | Specificity | I2 (%) | |
| Minimal severity of traumatic brain injury: | |||||
| Mild | 0 | – | – | – | – |
| Moderate | 1 | 0.111 | – | 1 | – |
| Severe | 7 | 0.757(0.679–0.824) | 67.3 | 0.632(0.556–0.704) | 79.1 |
| Assay: | |||||
| Liason | 1 | 0.870 | – | 0.360 | – |
| RIA | 4 | 0.594(0.464–0.715) | 83.8 | 0.705(0.598–0.797) | 76.7 |
| LIA | 1 | 0.789 | – | 0.550 | – |
| ECLIA | 1 | 0.941 | – | 0.333 | – |
| ELISA | 1 | 0.545 | – | 0.933 | – |
| Prognostic evaluation time: | |||||
| At discharge | 1 | 1 | – | 0.6 | – |
| 1 month | 1 | 0.941 | – | 0.333 | – |
| 3 months | 1 | 0.870 | – | 0.360 | – |
| 6 months | 5 | 0.642(0.545–0.732) | 79.9 | 0.712(0.634–0.783) | 85 |
| 12 months | 1 | 0.650 | – | 0.607 | – |
| Concentration measurement type: | |||||
| Initial concentrations | 7 | 0.767(0.681–0.839) | 78.7 | 0.628(0.541–0.709) | 84 |
| Peak concentrations | 1 | 0.545 | – | 0.735 | – |
| Cutoff: | |||||
| 20 µg/L | 5 | 0.667(0.553–0.768) | 85.5 | 0.692(0.587–0.785) | 72.6 |
| Others | 3 | 0.778(0.664–0.867) | 52.3 | 0.621(0.516–0.719) | 91.5 |
ECLIA = electrochemiluminescence immunoassay; ELISA = enzyme linked immunosorbant assay; LIA = luminescence immunoassay; RIA = radioimmunoassay.
Figure 9. The pooled positive predictive value (PPV) and negative predictive value (NPV) to predict mortality in patients with traumatic brain injury.
Figure 10. The pooled positive predictive value (PPV) and negative predictive value (NPV) to predict unfavourable outcome in patients with traumatic brain injury.
Figure 11. The hierarchical summary receiver operating characteristic (HSROC) curves of NSE to predict mortality in patients with traumatic brain injury.
Figure 12. The hierarchical summary receiver operating characteristic (HSROC) curves of NSE to predict unfavourable outcome in patients with traumatic brain injury.
Considering the five studies in which a cutoff of 20 µg/L for unfavorable neurological prognosis could be evaluated, pooled sensitivity and specificity were 0.67 (95% CI 0.55–0.77) and 0.69 (95% CI 0.59–0.79), respectively. Among the four studies allowing evaluation of the NSE cutoff value of 20 µg/L for mortality, the pooled sensitivity and specificity were 0.71 (95% CI 0.52–0.86) and 0.63 (95% CI 0.41–0.81), respectively. When each study was considered individually, the respective serum thresholds to attain 100% sensitivity for prognosis of death, meaning that all mortality is correctly predicted with no false negatives, ranged from 11.62 to 20 µg/L, with an associated specificity ranging from 0.33 to 0.45. In contrast, the serum threshold to attain 100% sensitivity for prognosis of unfavorable outcome was 20 µg/L, with an associated specificity of 60%.
Discussion
This meta-analysis found a significant association between NSE serum concentration and mortality and neurological outcome in TBI patients. Mortality was associated with significantly higher NSE concentrations (M.D. 0.28, 95% confidence interval 0.21 to 0.34; I2 55%), as was unfavorable outcome (M.D. 0.24, 95% confidence interval 0.17 to 0.31; I2 64%). The serum values associated with 100% sensitivity for mortality and unfavorable outcome were a range of 11.62 to 20 µg/L and 20 µg/L, respectively. Our findings are highly relevant to the prognosis of TBI patients in critical condition.
There are several limitations to our meta-analysis. The major limitation was the relative dearth of studies that met our inclusion criteria. Second, there was considerable heterogeneity for all outcomes of interest. Nonetheless, sensitivity analyses did not identify a variable mediating heterogeneity in Glasgow outcome score and mortality, though many variables, including prognostic evaluation time after injury, severity of injury, measurement type, sampling type, and isolated versus multiple trauma, were assessed. Third, the time of NSE concentration measurement could be a confounding factor. Among studies where more than one sample was collected, NSE concentrations between 12 and 24 h after admission showed a stronger association with outcomes, which could reflect the impact of secondary neurological injuries such as hypotension, hypoxemia, and intracranial hypertension. Fourth, though we carried out our meta-analysis according to high methodological standards [22], the results of the meta-analysis are limited by the quality of studies included. For example, only four studies reported an outcome assessment that was blinded from NSE concentrations, which implies a high risk of bias. Moreover, we cannot exclude potential publication bias. Fifth, we could not perform sensitivity analyses related to age, pupillary reactivity, or the motor component of the Glasgow outcome score, which are known indicators of prognosis, because of variable presentation or absence of these data in included studies. Sixth, the type of NSE assay could have affected the accuracy and precision of the threshold NSE concentrations. Although our sensitivity analyses did not reveal any major impact on the results, some assays were used in only a few studies, thus precluding a robust interpretation of their impact.
Finally, NSE normally increases in the first 12 h after trauma and decreases within hours or days; its half-life is ∼24 h. Secondary increases may occur in patients with fatal outcomes. Although NSE initially appeared to be a promising marker of injury severity owing to a number of theoretical advantages, including its correlation with the number of affected neurons rather than glial cells and its high specificity for the brain [38], like all biomarkers, it has limitations. One of the main problems associated with its use as a marker of brain damage is that NSE concentrations could be affected by hemolysis. Erythrocytes contain a large amount of NSE; hemolysis may, therefore, cause a marked increase of NSE in the blood. Furthermore, an increase in NSE has been documented in patients with multiple traumas without head injury, and in rats with ischemic injury to abdominal organs [39]. Whether patients in the included studies experienced trauma other than head injury was rarely described, precluding any sensitivity analysis. Therefore, this aspect has not been examined and should be considered in future studies.
The strengths of this meta-analysis include the thoroughness of our systematic search, including different databases, and our comprehensive analytical approach that allowed the inclusion of studies presenting not only medians and interquartile ranges, but also means and standard deviations, thus improving the exhaustiveness of the results. Our methods all were based on guidelines for conducting and reporting systematic reviews.
Although previous narrative reviews have illustrated the potential of NSE concentrations for predicting outcome after traumatic brain injury [40]–[41], none of these used systematic review and meta-analysis methods. Extracerebral sources of NSE could lead to overestimation of the severity of the brain lesion in the early phase after TBI in patients with multiple injuries [40]. Only one study included in our meta-analysis enrolled patients without associated multiple traumas. However, the association between NSE concentrations and prognosis was consistent irrespective of other injuries. This result is concordant with observations that NSE concentrations correlate more closely with severity of brain injury than injury to any other organ. Further, serum concentrations of NSE correlate with the extent of brain damage in TBI, ischemic stroke, and intracerebral hemorrhage on computed tomography. Thus, the effect of extracerebral sources of NSE is likely to be minimal. Moreover, we could not explore the confounding effect of severity of extracerebral injuries due to lack of data.
This meta-analysis also examined the discriminative capacity of serum NSE concentrations and found only moderate discriminatory ability to predict mortality and neurological outcome in TBI patients. However, so far the resulting prognostic value of NSE remains low in spite of observed associations. Given the lack of information on TBI patients’ outcomes that trauma medical teams and neurosurgeons faced with decisions about level of care currently have, even a moderately reliable indicator may be useful. Serum NSE could be combined with other predictors such as Glasgow coma scale, age, pupillary reaction, head CT, and data from electrophysiological tests to develop a prognostic model to optimize level of care. However, the relatively higher negative predictive value of NSE to exclude a clinically important brain injury could be useful to determine whether to perform additional diagnostic assessments such as CT scans in TBI patients, thus avoiding exposure to unnecessary radiation, allowing better use of resources, and controlling costs.
Many questions remain unanswered, such as the prognostic cutoff value and the optimal assay and time of sampling, which might affect the cutoff value. With the current level of evidence, we could not determine serum NSE values that distinguish prognoses. Further research is needed to develop a prognostic model with high discriminative capacity based on a combination of variables known to be associated with TBI outcomes.
Conclusions
In this systematic review and meta-analysis of the prognostic value of serum NSE in traumatic brain injury patients, we found that unfavorable outcome and mortality were significantly associated with greater NSE concentrations. In addition, serum NSE has moderate discriminatory ability to predict mortality and neurological outcome. The optimal discrimination cutoff values for NSE and the optimal sampling time remain uncertain, as there were important variations between studies. Further efforts should focus on standardizing assay, identifying optimal cutoff values and sampling time, and on combining NSE concentrations with other prognostic indicators to improve the accuracy of prognostic models to guide level-of-care decisions.
Supporting Information
PRISMA Checklist.
(DOC)
Acknowledgments
The authors thank Dr. GRADISEK who provided some useful information on related studies.
Data Availability
The authors confirm that all data underlying the findings are fully available without restriction. All relevant data are within the paper and its Supporting Information files.
Funding Statement
The authors have no support or funding to report.
References
- 1. Hyder AA, Wunderlich CA, Puvanachandra P, Gururaj G, Kobusingye OC (2007) The impact of traumatic brain injuries: a global perspective. NeuroRehabilitation 22: 341–353. [PubMed] [Google Scholar]
- 2. Roozenbeek B, Maas AIR, Menon DK (2013) Changing patterns in the epidemiology of traumatic brain injury. Nat Rev Neurol 9: 231–236. [DOI] [PubMed] [Google Scholar]
- 3. Turgeon AF, Lauzier F, Burns KE, Meade MO, Scales DC, et al. (2013) Determination of neurological prognosis in adult patients with severe traumatic brain injury: a survey of Canadian intensivists, neurosurgeons and neurologists. Crit Care Med 41: 1086–93. [DOI] [PubMed] [Google Scholar]
- 4. Perel P, Arango M, Clayton T, Edwards P, Komolafe E, et al. (2008) Predicting outcome after traumatic brain injury: practical prognostic models based on large cohort of international patients. BMJ 336: 425–9. [DOI] [PMC free article] [PubMed] [Google Scholar]
- 5. Zitnay GA, Zitnay KM, Povlishock JT, Hall ED, Marion DW, et al. (2008) Traumatic brain injury research priorities: The Conemaugh international brain injury symposium. J Neurotrauma 25: 1135–52. [DOI] [PubMed] [Google Scholar]
- 6. Goncalves CA, Leite MC, Nardin P (2008) Biological and methodological features of the measurement of S100B, a putative marker of brain injury. Clin Biochem 41: 755–63. [DOI] [PubMed] [Google Scholar]
- 7. Papa L, Robinson G, Oli M, Pineda J, Demery J, et al. (2008) Use of biomarkers for diagnosis and management of traumatic brain injury patients. Expert Opin Med Diagn 2: 937–45. [DOI] [PubMed] [Google Scholar]
- 8. Moore BW, McGregor D (1965) Chromatographic and electrophoretic fractionation of soluble proteins of brain and liver. J Biol Chem 240: 1647–53. [PubMed] [Google Scholar]
- 9. Li XY, Feng DF (2009) Diffuse axonal injury Novel insights into detection and treatment. J Clin Neurosci 16: 614–619. [DOI] [PubMed] [Google Scholar]
- 10. De KruijkJR, Leffers P, Menheere PP, Meerhoff S, Twijnstra A (2001) S-100B and neuron-specific enolase in serum of mild traumatic brain injury patients. A comparison with health controls. Acta Neurol Scand 103: 175–179. [DOI] [PubMed] [Google Scholar]
- 11. Wu HM, Huang SC, Hattori N, Glenn TC, Vespa PM, et al. (2004) Selective metabolic reduction in gray matter acutely following human traumatic brain injury. J Neurotrauma 21: 149–161. [DOI] [PubMed] [Google Scholar]
- 12. Begaz T, Kyriacou DN, Segal J, Bazarian JJ (2006) Serum biochemical markers for post-concussion syndrome in patients with mild traumatic brain injury. J Neurotrauma 23: 1201–1210. [DOI] [PubMed] [Google Scholar]
- 13. Gradisek P, Osredkar J, Korsic M, Kremzar B (2012) Multiple indicators model of long-term mortality in traumatic brain injury. Brain Inj 26: 1472–1481. [DOI] [PubMed] [Google Scholar]
- 14. Chabok SY, Moghadam AD, Saneei Z, Amlashi FG, Leili EK, et al. (2012) Neuron-specific enolase and S100BB as outcome predictors in severe diffuse axonal injury. J Trauma Acute Care Surg 72: 1654–1657. [DOI] [PubMed] [Google Scholar]
- 15. Zurek J, Fedora M (2012) The usefulness of S100B, NSE, GFAP, NF-H, secretagogin and Hsp70 as a predictive biomarker of outcome in children with traumatic brain injury. Acta Neurochir (Wien) 154: 93–103. [DOI] [PubMed] [Google Scholar]
- 16. Bohmer AE, Oses JP, Schmidt AP, Perón CS, Krebs CL, et al. (2011) Neuron-specific enolase, S100B, and glial fibrillary acidic protein levels as outcome predictors in patients with severe traumatic brain injury. Neurosurgery 68: 1624–1630. [DOI] [PubMed] [Google Scholar]
- 17. Ross SA, Cunningham RT, Johnston CF, Rowlands BJ (1996) Neuron-specific enolase as an aid to outcome prediction in head injury. Br J Neurosurg 10: 471–476. [DOI] [PubMed] [Google Scholar]
- 18. Whiting PF, Rutjes AW, Westwood ME, Mallett S, Deeks JJ, et al. (2011) QUADAS-2: a revised tool for the quality assessment of diagnostic accuracy studies. Ann Intern Med 155: 529–36. [DOI] [PubMed] [Google Scholar]
- 19. Bland JM, Altman DG (1996) The use of transformation when comparing two means. BMJ 312: 1153. [DOI] [PMC free article] [PubMed] [Google Scholar]
- 20. Higgins JP, Thompson SG, Deeks JJ, Altman DG (2003) Measuring inconsistency in meta-analyses. BMJ 327: 557–60. [DOI] [PMC free article] [PubMed] [Google Scholar]
- 21. Reitsma JB, Glas AS, Rutjes AW, Scholten RJ, Bossuyt PM, et al. (2005) Bivariate analysis of sensitivity and specificity produces informative summary measures in diagnostic reviews. J Clin Epidemiol 58: 982–90. [DOI] [PubMed] [Google Scholar]
- 22. Moher D, Liberati A, Tetzlaff J (2009) Altman DG; PRISMA Group (2009) Preferred reporting items for systematic reviews and meta-analyses: the PRISMA statement. BMJ 339: b2535. [DOI] [PMC free article] [PubMed] [Google Scholar]
- 23. Raabe A, Grolms C, Keller M, Döhnert J, Sorge O, et al. (1998) Correlation of computed tomography findings and serum brain damage markers following severe head injury. Acta Neurochir (Wien) 140: 787–92. [DOI] [PubMed] [Google Scholar]
- 24. Raabe A, Grolms C, Seifert V (1999) Serum markers of brain damage and outcome prediction in patients after severe head injury. Br J Anaesth 13: 56–9. [DOI] [PubMed] [Google Scholar]
- 25. Woertgen C, Rothoerl RD, Holzschuh M, Metz C, Brawanski A (1997) Comparison of serial S-100 and NSE serum measurements after severe head injury. Acta Neurochir (Wien) 139: 1161–5. [DOI] [PubMed] [Google Scholar]
- 26. Li N, Shen JK, Zhao WG, Cai Y, Li YF, et al. (2004) S-100B and neuron specific enolase in outcome prediction of severe head injury. Chin J Traumatol 7: 156–8. [PubMed] [Google Scholar]
- 27. Vos PE, Lamers KJ, Hendriks JC, van Haaren M, Beems T, et al. (2004) Glial and neuronal proteins in serum predict outcome after severe traumatic brain injury. Neurology 62: 1303–10. [DOI] [PubMed] [Google Scholar]
- 28. Baker AJ, Rhind SG, Morrison LJ, Black S, Crnko NT, et al. (2009) Resuscitation with hypertonic saline-dextran reduces serum biomarker levels and correlates with outcome in severe traumatic brain injury patients. J Neurotrauma 26: 1227–40. [DOI] [PubMed] [Google Scholar]
- 29. Olivecrona M, Rodling-Wahlstrom M, Naredi S, Koskinen LO (2009) S-100B and neuron specific enolase are poor outcome predictors in severe traumatic brain injury treated by an intracranial pressure targeted therapy. J Neurol Neurosurg Psychiatry 80: 1241–7. [DOI] [PubMed] [Google Scholar]
- 30. Stein DM, Lindell AL, Murdock KR, Kufera JA, Menaker J, et al. (2012) Use of serum biomarkers to predict cerebral hypoxia after severe traumatic brain injury. J Neurotrauma 29: 1140–9. [DOI] [PubMed] [Google Scholar]
- 31. McKeating EG, Andrews PJ, Mascia L (1998) Relationship of neuron specific enolase and protein S-100 concentrations in systemic and jugular venous serum to injury severity and outcome after traumatic brain injury. Acta Neurochir (Wien) 71(suppl ()) 117–9. [DOI] [PubMed] [Google Scholar]
- 32. Dauberschmidt R, Marangos PJ, Zinsmeyer J, Bender V, Klages G, et al. (1983) Severe head trauma and the changes of concentration of neuron-specific enolase in plasma and in cerebrospinal fluid. Clin Chim Acta 131: 165–70. [DOI] [PubMed] [Google Scholar]
- 33. Gradisek P, Osredkar J, Korsic M, Kremzar B (2012) Multiple indicators model of long-term mortality in traumatic brain injury. Brain Inj 26: 1472–81. [DOI] [PubMed] [Google Scholar]
- 34. Yamazaki Y, Yada K, Morii S, Kitahara T, Ohwada T (1995) Diagnostic significance of serum neuron-specific enolase and myelin basic protein assay in patients with acute head injury. Surg Neurol 43: 267–70. [DOI] [PubMed] [Google Scholar]
- 35. Meric E, Gunduz A, Turedi S, Cakir E, Yandi M (2010) The prognostic value of neuron-specific enolase in head trauma patients. J Emerg Med 38: 297–301. [DOI] [PubMed] [Google Scholar]
- 36. Sogut O, Guloglu C, Orak M, Sayhan MB, Gokdemir MT, et al. (2010) Trauma scores and neuron-specific enolase, cytokine and C-reactive protein levels as predictors of mortality in patients with blunt head trauma. J Int Med Res 38: 1708–20. [DOI] [PubMed] [Google Scholar]
- 37. Guan W, Yang YL, Xia WM, Li L, Gong DS (2003) Significance of serum neuron-specific enolase in patients with acute traumatic brain injury. Chinese journal of traumatology 6: 218–221. [PubMed] [Google Scholar]
- 38. Johnsson P (1996) Markers of cerebral ischemia after cardiac surgery. J Cardiothorac Vasc Anesth 10: 120–6. [DOI] [PubMed] [Google Scholar]
- 39. Pelinka LE, Hertz H, Mauritz W, Harada N, Jafarmadar M, et al. (2005) Nonspecific increase of systemic neuronspecific enolase after trauma: clinical and experimental findings. Shock 24: 119–23. [DOI] [PubMed] [Google Scholar]
- 40. Yokobori S, Hosein K, Burks S, Sharma I, Gajavelli S, et al. (2013) Biomarkers for the Clinical Differential Diagnosis in Traumatic Brain Injury–A Systematic Review. CNS Neuroscience & Therapeutics 19: 556–565. [DOI] [PMC free article] [PubMed] [Google Scholar]
- 41. Giacoppo S, Bramanti P, Barresi M, Celi D, Foti Cuzzola V, et al. (2012) Predictive Biomarkers of Recovery in Traumatic Brain Injury. Neurocrit Care 16: 470–477. [DOI] [PubMed] [Google Scholar]
Associated Data
This section collects any data citations, data availability statements, or supplementary materials included in this article.
Supplementary Materials
PRISMA Checklist.
(DOC)
Data Availability Statement
The authors confirm that all data underlying the findings are fully available without restriction. All relevant data are within the paper and its Supporting Information files.


