There are errors in Figures 3, 4, 5, 6, 7, and Figure S4 of the published article. In several places the units “kb” should read “kDa”. The corrected figures and their legends can be seen here.
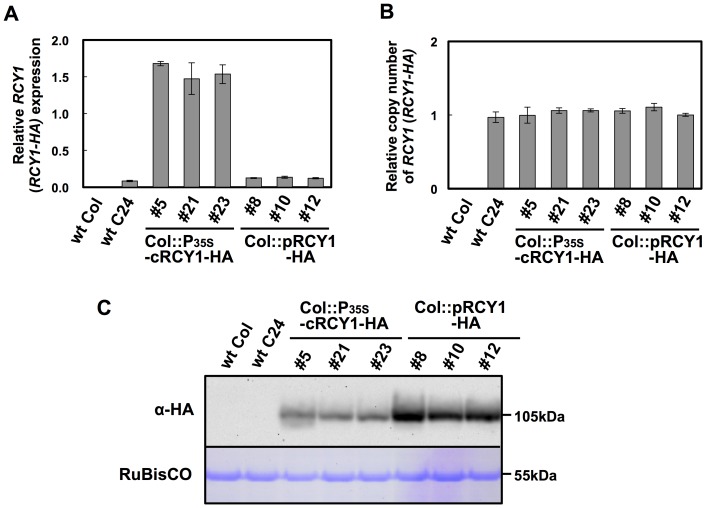
Figure 3. Detection of RCY1 protein, the RCY1transcript, and the RCY1 transgene in three independent Col-0 lines transformed with HA-tagged genomic RCY1 or HA-tagged RCY1 cDNA without introns.
Relative amounts of RCY1 transcripts in wild-type A. thalianaecotypes Col-0 (wt Col) and C24 (wt C24), and three independent lines transformed with HA-tagged genomic RCY1 (Col::pRCY1-HA #8, #10, and #12) or HA-tagged RCY1 cDNA without introns (Col::cRCY1-HA #5, #21 and #23), were measured by quantitative RT-PCR (A). Relative amounts of RCY1-coding transgene DNA in wild-type ecotypes (wt Col and wt C24) and three independent lines of Col::gRCY1-HA and Col::cRCY1-HA were measured by quantitative PCR using each genomic DNA as a template (B). HA-epitope-tagged RCY1 protein (α-HA) in wild-type ecotypes (wt Col and wt C24); Col::gRCY1-HA #8, #10 and #12 lines; and Col::cRCY1-HA #5, #21 and #23 lines was immunologically detected using monoclonal anti-HA epitope antibody. As an internal control for protein sample quantities, the large subunit of RuBisCO was visualized by staining by Coomassie Brilliant Blue R-250 (CBB) (C). For all experiments, three independent plants per vector were analyzed. The averages of relative RCY1transcript amounts ±SE are shown in A and B. In C, a representative photograph is shown. The size of each band was shown at right side of the panel.
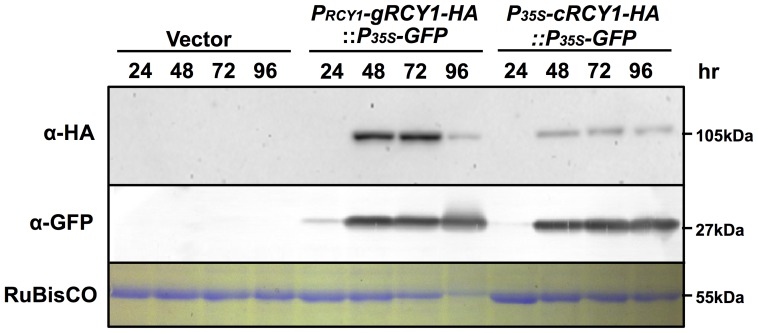
Figure 4. Detection of HA-epitope-tagged RCY1 inN. benthamiana leaves transiently expressing genomic RCY1-HA under control of the native RCY1promoter or the RCY1 cDNA without introns under control of the CaMV 35S promoter.
HA-epitope-tagged RCY1 protein (α-HA) in N. benthamiana leaf tissues transiently expressing PRCY1-gRCY1-HA::P35S-GFP or P35S-gRCY1-HA::P35S-GFP was immunologically detected using monoclonal antibody against the HA epitope at 24, 48, 72, and 96 h after agro-infiltration. GFP accumulation (α-GFP) was also immunologically detected at the same time points using polyclonal antibody against GFP as an internal standard. As an internal control for protein sample quantities, the large subunit of RuBisCO was visualized by staining with CBB. The size of each band was shown at right side of the panel. For all experiments, three independent plants per vector were analyzed and representative data are shown.
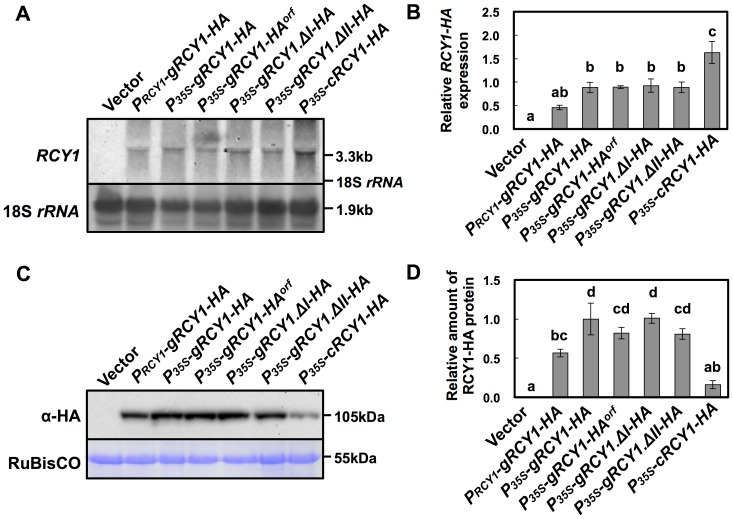
Figure 5. Detection of HA-epitope-tagged RCY1 protein and RCY1 transcript in N. benthamianaleaves transiently expressing a series of RCY1-HAconstructs under control of the RCY1 or CaMV 35S promoters.
RCY1 transcripts in N. benthamiana leaves agro-infiltrated withPRCY1-gRCY1-HA, P35S-gRCY1-HA, P35S-gRCY1-HAorf, P35S-gRCY1.ΔI-HA, P35S-gRCY1.ΔII-HA, or P35S-cRCY1-HA were detected by northern hybridization. pRI201-AN (Vector) was used as an empty-vector control for agro-infiltration. As an internal control for RNA sample quantities, 18S rRNA is shown (A). Relative amounts of RCY1transcripts in each line were measured by quantitative RT-PCR. EFαgene expression was used as a standard for normalization of RCY1expression (B). HA-epitope-tagged RCY1 protein (α-HA) in N. benthamiana leaves transiently expressing PRCY1-gRCY1-HA, P35S-gRCY1-HA, P35S-gRCY1-HAorf, P35S-gRCY1.ΔI-HA, P35S-gRCY1.ΔII-HA, or P35S-cRCY1-HA was immunologically detected using anti-HA monoclonal antibody. As an internal control for protein sample quantities, the large subunit of RuBisCO was visualized by staining with CBB (C). RCY1-HA protein amounts in each line were quantified by band intensity using Quantity One software. For all experiments, four independent plants transiently expressing each vector construct were analyzed (D). The averages of relative RCY1 transcript amounts ±SE are shown in B and D. In A and C, representative photographs are shown. The size of each band and the position of 18S rRNA were shown at right side of the panels. Data were subjected to analysis of variance and treatment means were compared by Tukey's test. Different letters indicate a statistically significant difference in the relative amount of RCY1 transcript (n = 4, P<0.05).
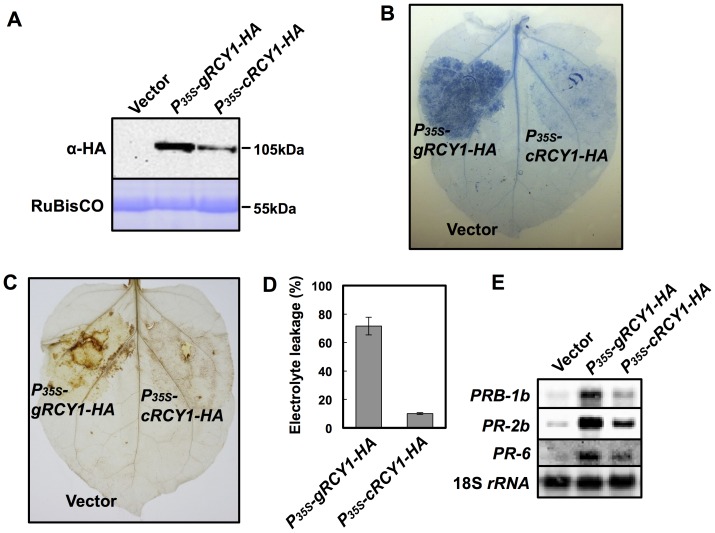
Figure 6. Activation of defense reaction in N. benthamiana leaves transiently expressingP35S-gRCY1-HA and P35S-cRCY1-HA under control of the CaMV 35S promoter.
HA-epitope-tagged RCY1 protein (α-HA) (A) in N. benthamiana leaves transiently expressing P35S-gRCY1-HA, P35S-cRCY1-HA, or pRI201-AN (Vector) as an empty-vector control was immunologically detected using anti-HA monoclonal antibody. As an internal control for protein sample quantities, the large subunit of RuBisCO was visualized by staining with CBB. The size of each band was shown at right side of the panel. In N. benthamiana leaves transiently expressing P35S-gRCY1-HA or P35S-cRCY1-HA, hypersensitive response (HR) cell death was visualized by trypan blue staining (B), and H2O2 production was detected by DAB staining (C). To evaluate HR-cell death quantitatively, electrolyte leakage (D) in N. benthamiana leaves transiently expressing P35S-gRCY1-HA, P35S-cRCY1-HA, or empty-vector control was measured. Expression of the defense-related genesPRB-1b, PR-2b, and PR-6 in N. benthamiana leaf tissue transiently expressing P35S-gRCY1-HA, P35S-cRCY1-HA, or the empty-vector control was analyzed by northern hybridization (E). As an internal control for RNA sample quantities, 18S rRNA was shown.
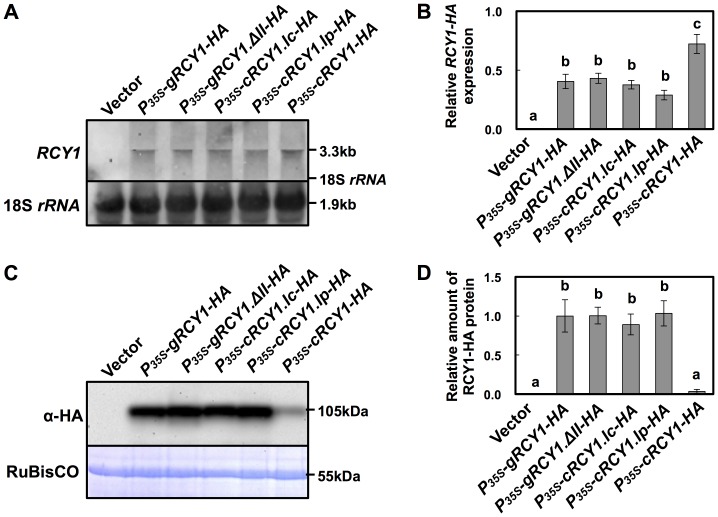
Figure 7. Detection of HA-epitope-tagged RCY1 protein and RCY1 transcript in N. benthamiana leaves transiently expressingRCY1-HA constructs in which the RCY1 introns were replaced with COR15a or PRF3 introns.
RCY1 transcripts in N. benthamiana leaves agro-infiltrated with P35S-gRCY1-HA, P35S-gRCY1.ΔII-HA, P35S-cRCY1.Ic-HA, P35S-cRCY1.Ip-HA, or P35S-cRCY1-HA were detected by northern hybridization. pRI201-AN (Vector) was used as an empty-vector control for agro-infiltration. As an internal control for RNA sample quantities, 18S rRNA is shown (A). Relative amounts of RCY1 transcripts in each line were measured by quantitative RT-PCR (B). HA-epitope-tagged RCY1 protein (α-HA) in N. benthamiana leaves transiently expressing P35S-gRCY1-HA,P35S-gRCY1.ΔII-HA, P35S-cRCY1.Ic-HA, P35S-cRCY1.Ip-HA, or P35S-cRCY1-HA was immunologically detected using anti-HA monoclonal antibody. As an internal control for protein sample quantities, the large subunit of RuBisCO was visualized by staining with CBB (C). RCY1-HA protein amounts in each line were quantified by band intensity using Quantity One software (D). For all experiments, four independent plants transiently expressing each vector construct were analyzed. The averages of relative amounts of RCY1 transcript and protein ±SE are shown in B and D, respectively. In A and C, representative photographs are shown. The size of each band and the position of 18S rRNA were shown at right side of the panels. Data were subjected to analysis of variance and treatment means were compared by Tukey's test. Different letters indicate a statistically significant difference in the relative amount of RCY1 transcript (n = 4, P<0.05).
Supporting Information
Comparison of HA-epitope-tagged COR15a and PRF3 transcript and protein levels among N. benthamiana leaf tissues transiently expressing intron-containing genomic COR15a or PRF3 or COR15a or PRF3 cDNAs without introns. COR15a (A) or PRF3 (B) transcripts in N. benthamiana leaf tissues transiently expressing either the intron-containing genomic COR15a(P35S-gCOR15a-HA) or PRF3 (P35S-gPRF3-HA), or the cDNAs for COR15a (P35S-cCOR15a-HA) or PRF3 (P35S-cPRF3-HA) without introns, were detected by northern hybridization. pRI201-AN (Vector) was used as an empty-vector control. As an internal control for RNA sample quantities, 18S rRNA is shown. The size of each band and the position of 18S rRNA were shown at right side of the panels. COR15a (C) or PRF3 (D) protein amounts in each line were quantified by band intensity using Quantity One software. Four independent plants transiently expressing each vector construct were analyzed. The averages of relative COR15a-HA and PRF3-HA protein amounts ±SE are shown. The COR15a-HA and PRF3-HA proteins in leaf tissues of each line were also detected by immunoblotting (E). As controls, pRI201-AN (Vector), P35S-gRCY1-HA, and P35S-cRCY1-HAwere agro-infiltrated into N. benthamiana leaves. As an internal control for protein sample quantities, the large subunit of RuBisCO was visualized by staining with CBB. In this experiment, 1/50 volume of total protein sample of leaf accumulating COR15a-HA against that of RCY1-HA and PRF3-HA was applied on the gel, since the level of COR15a-HA accumulation was essentially much higher than others. The size of each band and the position of RuBisCO large subunit were shown at right side of the panel.
(Tif)
Reference
- 1. Sato Y, Ando S, Takahashi H (2014) Role of Intron-Mediated Enhancement on Accumulation of an Arabidopsis NB-LRR Class R-protein that Confers Resistance to Cucumber mosaic virus . PLoS ONE 9(6): e99041 doi:10.1371/journal.pone.0099041 [DOI] [PMC free article] [PubMed] [Google Scholar]
Associated Data
This section collects any data citations, data availability statements, or supplementary materials included in this article.
Supplementary Materials
Comparison of HA-epitope-tagged COR15a and PRF3 transcript and protein levels among N. benthamiana leaf tissues transiently expressing intron-containing genomic COR15a or PRF3 or COR15a or PRF3 cDNAs without introns. COR15a (A) or PRF3 (B) transcripts in N. benthamiana leaf tissues transiently expressing either the intron-containing genomic COR15a(P35S-gCOR15a-HA) or PRF3 (P35S-gPRF3-HA), or the cDNAs for COR15a (P35S-cCOR15a-HA) or PRF3 (P35S-cPRF3-HA) without introns, were detected by northern hybridization. pRI201-AN (Vector) was used as an empty-vector control. As an internal control for RNA sample quantities, 18S rRNA is shown. The size of each band and the position of 18S rRNA were shown at right side of the panels. COR15a (C) or PRF3 (D) protein amounts in each line were quantified by band intensity using Quantity One software. Four independent plants transiently expressing each vector construct were analyzed. The averages of relative COR15a-HA and PRF3-HA protein amounts ±SE are shown. The COR15a-HA and PRF3-HA proteins in leaf tissues of each line were also detected by immunoblotting (E). As controls, pRI201-AN (Vector), P35S-gRCY1-HA, and P35S-cRCY1-HAwere agro-infiltrated into N. benthamiana leaves. As an internal control for protein sample quantities, the large subunit of RuBisCO was visualized by staining with CBB. In this experiment, 1/50 volume of total protein sample of leaf accumulating COR15a-HA against that of RCY1-HA and PRF3-HA was applied on the gel, since the level of COR15a-HA accumulation was essentially much higher than others. The size of each band and the position of RuBisCO large subunit were shown at right side of the panel.
(Tif)


