

Abstract
Triple-negative breast cancer (TNBC) is a highly heterogeneous and recurrent subtype of breast cancer that lacks an effective targeted therapy. To identify candidate therapeutic targets, we profiled global gene expression in TNBC and breast tumor-initiating cells with a patient survival dataset. Eight TNBC-related kinases were found to be overexpressed in TNBC cells with stem-like properties. Among them, expression of PKC-α, MET and CDK6 correlated with poorer survival outcomes. In cases co-expressing two of these three kinases, survival rates were lower than in cases where only one of these kinases was expressed. In functional tests, two-drug combinations targeting these three kinases inhibited TNBC cell proliferation and tumorigenic potential in a cooperative manner. A combination of PKC-α−MET inhibitors also attenuated tumor growth in a cooperative manner in vivo. Our findings define three kinases critical for TNBC growth and offer a preclinical rationale for their candidacy as effective therapeutic targets in treating TNBC.
Keywords: Triple-negative breast cancer, breast tumor-initiating cells, bioinformatics, cancer-related kinases, combinatorial therapy, synergism
Introduction
Breast cancers are typically classified into several subtypes: Luminal A and B subtypes of breast cancer that correspond to pathological estrogen receptor (ER)-positive tumors, the human epidermal growth factor receptor 2 (HER2) subtype that corresponds to HER2-overexpressing tumors, and triple-negative/basal-like breast cancer (TNBC/BLBC). BLBC makes up about 15-20% of breast cancers. Recent studies using clinical samples indicate that BLBC shares more than 80% similarity with TNBC, which is negative for ER, progesterone receptor (PR), and HER2 expression (1). In addition, two major subgroups of TNBC characterized on the basis of gene ontologies and differential gene expression profile have been reported: basal-like TNBC driven by genes enriched in cell cycle, cell division, and DNA damage response; and mesenchymal-like driven by genes involved in cell motility, cell differentiation, and growth factor pathways (2). These findings indicate that TNBCs are highly heterogeneous. Although subtyping allows for better prediction of the response of each subtype to specific molecular targets, the therapeutic benefits in clinical trial are still unclear. Here, we will use TNBC as a general term to broadly represent the TNBC/BLBC subtype.
TNBC patients initially respond to conventional chemotherapy, but the disease frequently relapses and leads to worse outcome than patients with hormone receptor-positive subtypes (3). The low survival rate of TNBC patients is also due to high metastasis rates and lack of effective treatment after a relapse (4). Currently, no effective targeted therapies are available for patients with TNBC because of TNBC's lack of expression of hormone receptors and HER2 amplification (1, 5).
A cancer stem cell (CSC) or tumor-initiating cell (TIC) hypothesis has been proposed to account for treatment failure and recurrence in patients with TNBC (6). Breast TICs (BTICs) make up a small subpopulation of cells inside tumors that are resistant to conventional therapy and are capable of reinitiating tumor growth after treatment (7-9);these cell scan be enriched by flow cytometry using specific cell surface markers such as CD44+ and CD24-/low (10) and ALDH1high (11). Accumulating evidence suggests that BTICs are responsible for tumor initiation, progression, and drug resistance (12, 13). Residual breast tumor cells that survive after conventional treatment may contain a high proportion of cells with both tumor-initiating and mesenchymal features (7, 14). In line with these BTIC features, TNBC also exhibits stem cell signatures and epithelial-mesenchymal transition characteristics with high expression of mesenchymal markers (1, 15). We hypothesized that BTICs and disease recurrence may activate common pathways and contribute to the resistance of TNBC.
Based on the Cancer Genome Atlas (TCGA) analysis, the mutation rates of genes other than TP53 (80%) or PIK3CA (9%) are less than 5% in TNBC (16). However, there is no effective way to address loss/mutations of p53 in the clinic at this moment, and the effects of PI3K pathway inhibitors in clinical trials are yet to be seen (17-20). MicroRNA-regulated gene expression has been implicated in cancer progression (21), suggesting that in addition to DNA alteration (mutation or amplification), microRNA regulation may contribute to TNBC progression by turning on certain oncogenic gene expression. In order to find other novel therapeutic targets, we performed an unbiased two-stage bioinformatics analysis (cell and patient based) of TNBC/BTIC (mRNA and microRNA) databases and of patient survival data to identify key oncogenic molecules in TNBC, with a particular focus on those targeted by drugs that are currently in oncology clinical trials. Through this analysis, we identified eight kinases linking TNBC and CSCs.
Materials and Methods
Drugs
Crizotinib was purchased from LC Laboratories (C-7900), safingol from Matreya LLC (1807) or Sigma (D4681), L-threo-dihydrosphingosine from Santa Cruz Biotechnology (CAS 73938-69-9), and PD-0332991 from Sigma (PZ0199).
Cell Lines
MDA-MB-231, Hs578T, BT549, MDA-MB-468, T47D, MCF7, and SK-BR-3 cells were grown in DMEM-F12 medium (Caisson Laboratories, Inc.) supplemented with 10% fetal bovine serum, penicillin (50 U ml–1), and streptomycin (50 U ml–1). Immortal normal mammary epithelial cells (MCF10A) were cultured in DMEM-F12 medium supplemented with 5% horse serum, penicillin (50 U ml–1), streptomycin (50 U ml–1), epidermal growth factor (20 ng ml–1), insulin (10 μg ml–1), cholera toxin (1 ng ml–1), and hydrocortisone. BT20 cells were grown in DMEM medium (Caisson Laboratories, Inc.) supplemented with 10% fetal bovine serum, penicillin (50 U ml–1), streptomycin (50 U ml–1), and nonessential amino acids. Cell lines were validated by short tandem repeat (STR) DNA fingerprinting using the Amp FLSTR Identifiler kit according to the manufacturer's instructions (Applied Biosystems catalog no. 4322288). The STR profiles were compared with known American Type Culture Collection fingerprints (ATCC.org) and with data in the Cell Line Integrated Molecular Authentication (CLIMA) database version 0.1.200808 (22). The STR profiles matched known DNA fingerprints or were unique.
Analysis of Public Gene Expression Data
The following databases were used to compare TNBC data with non-TNBC data: E-MTAB-327 (microRNA expression profiling by array of NCI-60 human cancer cell lines), GSE25037 (microRNA expression profiling in CD24-/lowCD44+ and non-CD24-/lowCD44+ human mammary epithelial cell populations), CCLE data on breast cancer cell mRNA expression (23), and GSE7513 (human breast tumor sample data were sorted to select cells that were CD44+ and CD24-/low). The log2 ratio of TNBC versus non-TNBC data from public microarray databases was determined using NetWalker software (24). Gene expression profiles, pathways, and cross talk were analyzed with the Ingenuity Pathway Analysis System.
Hierarchical Clustering
Clustering was analyzed with an integrated pair of programs, Cluster and TreeView (25), for analyzing and visualizing the results of complex microarray experiments, and the median adjusted values were used to create expression files. The hierarchical clustering algorithm used is based closely on the average-linkage method of Sokal and Michener (26). For any set of TNBC-related kinases, an upper-diagonal similarity matrix was computed by using average-linkage clustering, which contained similar scores for all pairs of genes. This algorithm was determined by computing a dendrogram assembling all elements into a single tree, as described by Eisen et al. (25). The software application of this algorithm was obtained from M. B. Eisen (25).
Display
The heat map was represented graphically by coloring each cell on the basis of the measured fluorescence ratio. Log ratios of 0 (a ratio of 1.0 indicates that the genes are unchanged) were colored in black, positive log ratios were colored in red, and negative log ratios were colored in green (with darker colors corresponding to higher ratios).
Quantitative Real-Time PCR
Total RNAs from different breast cancer cells were extracted by using the RNeasy kit (Qiagen). RNAs were reverse transcribed by using the Superscript II kit (Invitrogen). Real-time polymerase chain reaction (PCR) was then performed using the iCycler (Bio-Rad). RNA levels were quantitated and normalized to GAPDH by subtracting the cycling threshold for the control from the cycling threshold for the target. Primers were as follows: LYN: 5′-TTCTGGTCTCCGAGTCACTCA-3′ and 5′-GCCGTCCACTTAATAGGGAACT-3′ MAP4K4: 5′-CCAATGGCAACTCCGAGTCTGT-3′ and 5′- GGGTCACTGAAGGAATGGGATC-3′ FYN: 5′- ACAAAACTGACGGAGGAGAGG-3′ and 5′-GAAGCTGGGGTAGTGCTGAG-3′ MET: 5′- TGTGTGGTCCTTTGGCGTGCTC-3′ and 5′-GGCGCATTTCGGCTTTAGGGTG-3′ RPS6KA3: 5′-CGAGGTCATACTCAGAGTGCTG-3′ and 5′-ACTGTGGCATTCCAAGTTTGGCT-3′ PRKCA: 5′-GCCTATGGCGTCCTGTTGTATG-3′ and 5′-GAAACAGCCTCCTTGGACAAGG-3′ CDK6: 5′- GGATAAAGTTCCAGAGCCTGGAG-3′ and 5′-GCGATGCACTACTCGGTGTGAA-3′ PIK3CD: 5′-TGCCAAACCACCTCCCATTCCT-3′ and 5′-CATCTCGTTGCCGTGGAAAAGC-3′
Western Blotting
Western blotting was carried out as described previously (27) with anti-LYN (Santa Cruz Biotechnology), anti-MAP4K4 (GeneTex), anti-FYN (Cell Signaling), anti-MET (Cell Signaling), anti-RPS6KA3 (Cell Signaling), anti-PRKCA (BD Biosciences), anti-CDK6 (Abcam), and anti-PIK3CD (GeneTex) antibodies. The membranes were stripped and reprobed with an anti-α-tubulin mouse monoclonal antibody (Sigma) as a loading control.
Patient Overall Survival Analysis
The NKI-295 database (28) was used for analysis of TNBC-related gene expression and overall survival. A gene expression level within the first quartile was defined as positive. Survival curves were estimated by the Kaplan-Meier method, and survival rates in different groups were compared by the log-rank test. The data were analyzed using statistical software SPSS version 17.0. A p value ≤ 0.05 was defined as statistically significant.
Cell Viability Assay
Cells were seeded in 96-well plates at an initial density of 2 × 10³ per well. At each time point, cells were stained with 100 μL of sterile 3-(4,5-dimethylthiazol-2-yl)-2,5-diphenyltetrazolium bromide (MTT; 0.5 mg/mL; Sigma) for 2 hours at 37°C, followed by removal of the culture medium and addition of 100 μL of dimethyl sulfoxide. Absorbance was measured at 570 nm, using 655 nm as the reference wavelength. All experiments were carried out in triplicate.
Anchorage-Independent Colony Growth
Two thousand cells were trypsinized and suspended in 2 mL of complete medium plus 0.3% agar (Sigma). The cell/agar mixture was plated on top of a layer of 1% agar in complete medium. After 21 days, viable colonies that were larger than 0.1 mm or 0.05 mm in diameter were counted using ImageJ software. Experiments were carried out for each cell line in triplicate.
Colony Formation Assay
Cells were plated in 6-well plates (2∼5 × 10² cells/well) and cultured for 10 days. Colonies were stained with 1% crystal violet for 10 min after fixation with 4% paraformaldehyde for 5 min.
Dual Drug Combination Assay
Breast cancer cells were plated in 96-well plates (BD Biosciences) and treated with various concentrations of kinase inhibitors, either alone or in combination, for 48 hours. Cell viability was determined using the MTT assay. Synergistic effects were determined by using the Chou-Talalay method to calculate the CI (29).
Flow Cytometric Analysis
Cells were harvested, washed with cold phosphate-buffered saline, and processed for CD24 and CD44 surface markers. Allophycocyanin-conjugated anti-CD44 (BD Biosciences) and phycoerythrin‐conjugated anti-CD24 (BD Biosciences) antibodies were used. To measure the levels of CD44+CD24-/low cells, MDA-MB-231, MCF7, and BT20 cells stained with fluorescein isothiocyanate-conjugated anti-CD44 antibody and phycoerythrin-conjugated anti-CD24 antibody (both at 1:50) were sorted at the Flow Cytometry and Cellular Imaging Core Facility of The University of Texas MD Anderson Cancer Center.
Mouse Studies
All animal procedures were conducted under the guidelines approved by the Institutional Animal Care and Use Committee at MD Anderson Cancer Center. Athymic mice (Harlan Laboratories) were used as hosts for tumor xenografts. MDA-MB-231 cells with luciferase and green fluorescent protein expression were used for tumor injection. Mice were divided according to the mean tumor volume in each group when the diameter of tumor size reached 4 mm. Based on our experience with in vitro tumorigenic analyses (Figure 6A and B), we observed synergism when at least one single kinase inhibitors reached 50% of cell killing effect. To find synergistic effect in vivo, the doses of single-drug treatments were also chosen at 50% inhibition. The ED50 (50% effective dose) of crizotinib and safingol was estimated by a dose-titration experiment (data not shown) and comparable to previous reports in other cancer cell lines (28, 29). Crizotinib was prepared by dissolving the drug in 50 mM sodium acetate buffer (pH 4.6) (30) and administered orally at 8 mg/kg every other day (31). L-threo-dihydrosphingosine was prepared by dissolving the drug in 5% dextrose containing lactic acid, with pH adjusted to 4.4 (32), and was injected intravenously at 20 mg/kg twice a week (33). Tumors were measured twice weekly with a caliper, and tumor volume was calculated as (width 2 × length)/2. Tumor volume measured during drug treatment was normalized to the volume prior to treatment. The CI was calculated as survival rate (drugs A+B) / (survival rate (drug A)x survival rate (drug B)).
Figure 6.

Dual-drug combinations of PKC-α, MET, and CDK6 inhibitors synergistically suppressed clonogenic and anchorage-independent growth in vitro and in an animal model.(A) The number of colony-forming cells was determined by clonogenic assay in BT549 and MDA-MB-231cells. Cells were treated with safingol (SA; 0.75 μM), crizotinib (Cr; 0.75 μM), and PD0332991 (PD; 0.75 μM), separately or in combination, for 10 days. (B) The number of colony-forming cells was determined by anchorage-independent growth analysis in MDA-MB-231 and BT549 cells. Cells were treated with safingol (0.5 μM), crizotinib (0.5 μM), and PD0332991 (0.2 μM), separately or in combination, for 21 days. Representative images from the clonogenic and anchorage-independent growth assays (carried out as described in Methods) are shown. The data on the right are means with standard deviations for three independent experiments. *, p < 0.05 for differences between combination and single-drug treatments.(C) Representative images of immunohistochemical staining of PKC-α expression in human TNBC tissues (left panels). TNBC tissue array analysis of overall survival in PKC-α-overexpressing patients. To ensure objectivity, the ACIS III automated cellular imaging system (Dako) was used for tissue scoring and quantification. All correlations between kinase expression levels were analyzed using SPSS version 15.0 statistical software (right panel). The overall survival durations after surgery were analyzed using a Kaplan-Meier plot. The Cox proportional hazards regression model was used to assess prognostic factors for overall survival. Cum, cumulative.(D) Seven days after transplantation of MDA-MB-231 cells expressing luciferase and green fluorescent protein, mice were treated with safingol at 20 mg/kg intravenously twice a week and/or crizotinib at 8 mg/kg orally every day. Tumor volume (V) was measured on days 8, 12, 15, 19, and 21 and was normalized to the tumor volume in untreated mice (V0). Error bars indicate standard deviations (n = 5). CTL, control; Inh., inhibition. (E) Body weight of mice described in (D). Data represent mean ± SD. n = 5. *p < 0.05 compared with the control group.
Patient Tissue Samples
The TNBC specimens (n = 107) used for our immunohistochemistry and survival analyses were originally obtained from patients undergoing surgical resection of breast cancer as primary treatment at MD Anderson Cancer Center or Mackay Memorial Hospital (Taipei, Taiwan) between 1995 and 2009. The specimens were used in accordance with the protocols approved by the Institutional Review Board of MD Anderson Cancer Center. Written informed consent was obtained from patients in all cases at the time of resection.
Results
Eight TNBC-related kinases are commonly overexpressed in TNBC subtypes and BTIC populations
To identify cancer-related kinases that are overexpressed in TNBC and BTICs, we performed a two-stage bioinformatics analysis of both cell line data and patient data. The study design is outlined in Figure 1A. The first stage was a cell-based analysis of data from two mRNA databases (14, 23) and two microRNA databases (34, 35) to identify oncogenes involved in TNBC. Breast cancer gene expression profile data were from the Cancer Cell Line Encyclopedia (CCLE)(23)and NCI-60 datasets (34), and BTIC gene expression profile data were from isolated human breast tumors (14), a mammary epithelial cell line, and primary human mammalian epithelial cells (35), representing the heterogeneity of TNBC. We focused on cancer-related kinases, as they are ideal drug targets, and by filtering microRNA targets with the Ingenuity Pathway Analysis System, we identified twenty-three kinases that were predicted to be upregulated in BTICs and TNBC (Table 1). We then validated the mRNA expression patterns of these twenty-three kinases by hierarchical clustering of expression levels in 56 breast cancer cell lines (CCLE)and identified thirteen kinases that had higher expression in TNBC cell lines (n=26) than in non-TNBC cell lines (n=30) (Fig. 1B).
Figure 1.

Thirteen druggable targets for aggressive TNBC were identified by bioinformatics analysis of TNBC and BTIC databases. (A) Schematic representation of the TNBC bioinformatics analysis. (B) Breast cancer cell lines were grouped by mRNA subtype according to ERBB2, ESR1, and PGR mRNA expression levels into non-TNBC (n=30) and TNBC (n=26) cells. The graph on the right was generated from original and log2-transformed mRNA expression levels of TNBC-related kinases in breast cancer subtypes. Genes highly expressed in TNBC cells (ERBB2, ESR1, and PGR) are boldfaced. The heat map represents color-coded expression levels of differentially expressed genes in all breast cancer cell lines tested. The color scale ranges from saturated green for log ratios of -2.0 and below to saturated red for log ratios of 2.0 and above. (C) Twenty TNBC cell lines were subtyped according to previously published criteria (2), and six luminal breast cancer cell lines were selected as controls. The color scale ranges from saturated green for log ratios of -2.0 and below to saturated red for log ratios of 2.0 and above. The average expression levels of the 13 TNBC-related kinases are shown in the top row.
Table 1.
Twenty-three kinases identified in the cell-based analysis.
| Symbol | Entrez Gene Name | Drug(s) |
|---|---|---|
| CDK6 | cyclin-dependent kinase 6 | PD-0332991, flavopiridol |
| DGKA | diacylglycerol kinase, alpha 80kDa | |
| EPHA4 | EPH receptor A4 | |
| FLT1 | fms-related tyrosine kinase 1 (vascular endothelial growth factor/vascular permeability factor receptor) | Sunitinib, pazopanib, axitinib, CEP 7055, vandetanib |
| FYN | FYN oncogene related to SRC, FGR, YES | Dasatinib |
| HIPK2 | Homeodomain interacting protein kinase 2 | |
| ITK | IL2-inducible T-cell kinase | |
| JAK1 | Janus kinase 1 | Ruxolitinib |
| KSR1 | Kinase suppressor of ras 1 | |
| LYN | v-yes-1 Yamaguchi sarcoma viral related oncogene homolog | |
| MAP3K8 | Mitogen-activated protein kinase kinase kinase 8 | |
| MAP4K4 | mitogen-activated protein kinase kinase kinase kinase 4 | |
| MAP4K5 | mitogen-activated protein kinase kinase kinase kinase 5 | Vemurafenib |
| MAPK7 | mitogen-activated protein kinase 7 | |
| MET | met proto-oncogene (hepatocyte growth factor receptor) | Crizotinib |
| PIK3CD | phosphoinositide-3-kinase, catalytic, delta polypeptide | SF 1126, PX-866, NVP-BEZ235, GDC-0941, BKM120, XL147, CAL-101 |
| PIP4K2A (PIP5K2A) | phosphatidylinositol-5-phosphate 4-kinase, type II, alpha | |
| PRKCA | protein kinase C, alpha | L-threo-safingol, ingenol 3-angelate |
| PRKCE | protein kinase C, epsilon | ingenol 3-angelate |
| RPS6KA3 | ribosomal protein S6 kinase, 90kDa, polypeptide 3 | |
| STK4 | serine/threonine kinase 4 | |
| TLK1 | tousled-like kinase 1 | |
| TRIO | triple functional domain (PTPRF interacting) |
NOTE: Twenty-three TNBC related kinases were analyzed through core, compare and microRNA target filter analysis from 2000-2012 Ingenuity Systems, Inc.
To determine whether these thirteen kinases are associated with a specific TNBC subgroup, we examined their expression levels in twenty TNBC cell lines including ten basal-like, eight mesenchymal-like, and two unclassified according to previously published criteria (2). We found that the average expression levels of these thirteen kinases were elevated in one unclassified, six of ten basal-like, and all eight mesenchymal-like TNBC subtypes compared with expression levels in the luminal breast cancer subtype (Fig. 1C). The results indicated that mRNA expression levels of these thirteen kinases are higher in most TNBCs tested, especially in the mesenchymal-like subtype.
To validate the above findings, we compared them RNA and protein expression levels of the thirteen kinases in breast cancer cell lines;among these, the mRNA expression levels of eight (CDK6, FYN, LYN, MET, PRKCA, RPS6KA3, MAP4K4, and PIK3CD) were significantly higher in at least two of four TNBC cell lines (BT549, Hs578T, MDA-MB-231, and MDA-MB-468) compared with expression levels in a non-TNBC cell line (T47D)(Fig. 2A and Supplementary Fig. S1). Western blot analysis indicated that expression levels of MET, PKC-α (from PRKCA), RSK-2 (from RPS6KA3), LYN, FYN, and CDK6 were higher in most of six TNBC cell lines tested than in six non-TNBC cell lines (Fig. 2B). Although the levels of PIK3CD (which encodes PI3K δ) and MAP4K4 mRNA were higher in TNBC cell lines than in non-TNBC cell lines, the protein expression levels were not. Generally, the protein levels of these eight kinases were overexpressed in most TNBC cell-lines tested; therefore, they served as a basis for further experimental analysis.
Figure 2.
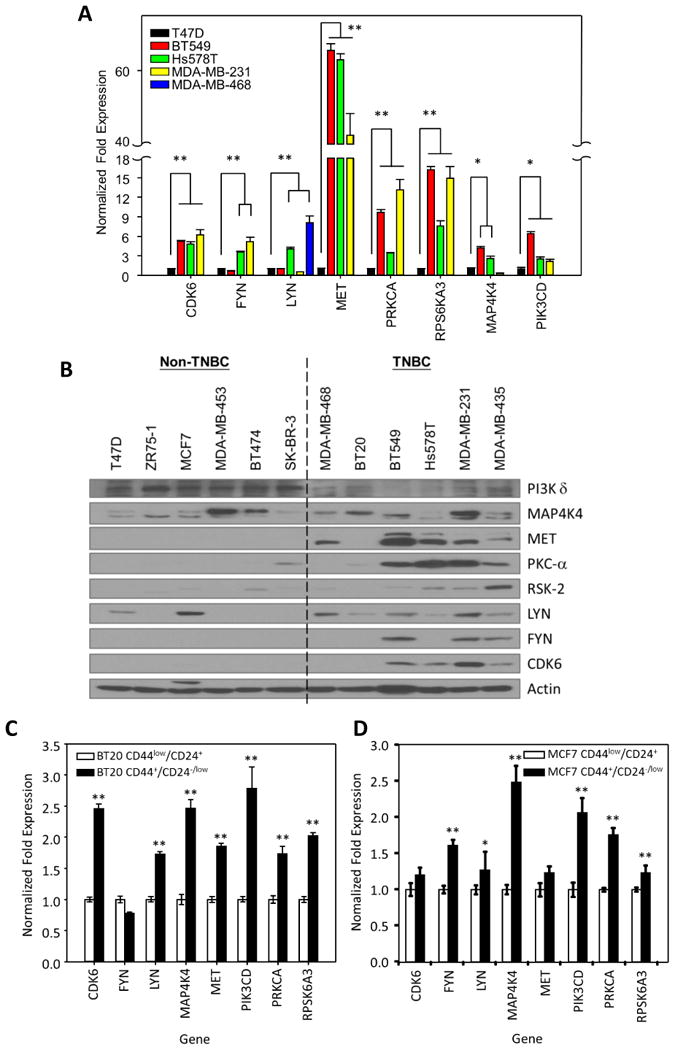
Eight TNBC-related kinases are overexpressed in TNBC cell lines and stem cell population. (A) Quantitative PCR analysis of the expression of the indicated TNBC-related kinases in TNBC cells compared with expression in non-TNBC cells (T47D). (B) Immunoblots of protein expression levels of TNBC-related kinases in a panel of breast cancer cell lines. (C) Quantitative PCR analysis of the expression levels of TNBC-related kinases in stem cell populations (CD24-/low CD44+) from BT20 (left) and MCF7 (right) breast cancer cells compared with expression in non-stem cell populations (CD24+ CD44low). Data are means with standard deviations (n = 3). *, p < 0.05; **, p < 0.005.
To evaluate the expression levels of the eight kinases in BTICs, we isolated CD44+/CD24-/low stem cells from a TNBC cell line (BT20) by flow cytometry. CDK6, LYN, MAP4K4, MET, PIK3CD, PRKCA, and RPS6KA3 mRNA levels were upregulated in the isolated CD44+/CD24-/low sub populations from TNBC cell line (BT20 cells, Fig. 2C) compared with the levels in CD44low/CD24+nonstem cells. Interestingly, FYN, LYN, MAP4K4, PIK3CD, PRKCA, and RPS6KA3 mRNA levels were also upregulated in the isolated CD44+/CD24-/low sub populations from the non-TNBC cell line (MCF7 cells, Fig. 2D), suggesting that the eight kinases are commonly overexpressed in BTICs. Because the increased expression of the eight kinases is likely an important feature of TNBC, we named them “TNBC-related kinases.”
Expression of TNBC-related kinases correlates with TNBC clinical subtypes
The second stage of our bioinformatics analysis (Fig. 1A) was to determine whether the eight TNBC-related kinases correlated with TNBC clinical subtypes. We examined mRNA expression levels of the TNBC-related kinases in the data from TCGA breast invasive carcinoma patient cohort (16). We used ERBB2, ESR1 (which encodes ER), and PGR (which encodes PR) gene expression patterns to distinguish TNBC patients from non-TNBC patients. The hierarchical clustering algorithm used is based closely on the average-linkage method, indicating that the mRNA expression levels of the eight TNBC-related kinases highly correlated with TNBC (Fig. 3A). Box plots were generated from the original log2-transformed mRNA expression levels of the eight kinases by breast cancer subtype on the basis of the mRNA expression levels of ESR1, PGR, and ERBB2. These findings indicate that expression of the TNBC-related kinases is strongly associated with TNBC vs. non-TNBC (Fig. 3B). The histogram PNG files show how cutoffs were set based on unbiased and automatic K-Means algorithm for the separation of TNBC and non-TNBC tumors (Fig. 3C). Taken together, the results of both cell and patient data base analyses suggest that TNBC-related kinases likely play important roles in the aggressive behavior of TNBC.
Figure 3.

Cluster analysis identified eight TNBC-related kinases overexpressed in TNBC cells from the TCGA breast invasive carcinoma patient cohort. (A) Hierarchical clustering analysis of eight TNBC-related kinases that distinguish TNBC from other human breast tumors (n = 753). Breast cancer patients were categorized by mRNA subtype as non-TNBC patients (n = 613) and TNBC patients (n = 140) according to expression of ERBB2, ESR1, and PGR (encoding HER2, ER, and PR, respectively). The color scale ranges from saturated green for log ratios of -2.0 and below to saturated red for log ratios of 2.0 and above. Red represents high gene expression (>2), and green represents low gene expression (<2).(B) Box plot generated from original and log2-transformed mRNA expression levels of TNBC-related kinases in TNBC patients and non-TNBC patients by ESR1, PGR, and ERBB2 mRNA sub typing. (C) Data were clustered by the standard K-means clustering algorithm to separate ESR1-high and ESR1-low expression, and PGR-high and PGR-low expression tumors. Cutoffs were set automatically (indicated by red line).
Overexpression of PRKCA, MET, and CDK6 correlates with poor prognosis in TNBC patients
To identify the most suitable therapeutic targets among the eight TNBC-related kinases for TNBC, we analyzed the relationship between the TNBC-related kinases and overall survival in breast cancer patients. Using an online Kaplan-Meier plotter (36), three out of the eight kinases (PRKCA, MET, and CDK6) that showed high expression were associated with shorter overall survival in patients with TNBC (p = 0.019, 0.02, and 0.073, respectively; Fig. 4A and data not shown) based on the univariate analysis with selected probes. Consistently, an other data analysis from breast cancer cohort NKI-295 (28) with selected cutoffs also indicated that PRKCA, MET, and CDK6 expression levels were correlated with worse overall survival (p = 0.003, 0.086, and 0.002, respectively; Fig. 4B). Furthermore, high expression of PRKCA/MET (p = 0.018), PRKCA/CDK6 (p < 0.0001), or CDK6/MET (p = 0.005) correlated with more adverse survival outcomes than each one alone in breast cancer patients (Fig. 4C). Interestingly, the survival rates of breast cancer patients in whom three kinases PRKCA/MET/CDK6 were coexpressed were not worse than in whom two kinases were coexpressed (data not shown), providing a rationale to investigate whether the dual-drug combinations sufficiently impede TNBC progression. Together, these results suggest that expression of PRKCA, MET, or CDK6 has the potential to serve as a prognostic marker and therapeutic target for breast cancer, especially TNBC.
Figure 4.
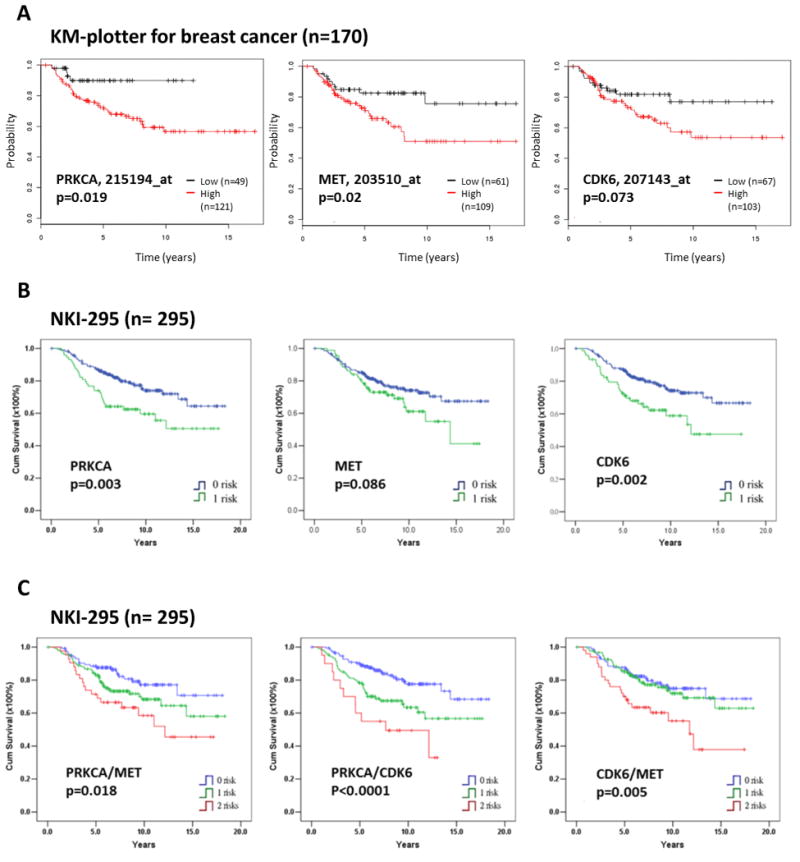
PRKCA, MET, and CDK6 expression levels are negatively correlated with probability of survival in breast cancer patients. (A) Kaplan-Meier (KM) estimates of overall survival for patients with basal-like breast cancer in relation to PRKCA, MET or CDK6 mRNA expression level from KM plotter analysis (36) using auto-selected best cutoffs to group patients. A statistical analysis of time-to-event data with the expression of PRKCA (hazard ratio, 3.21; 95% confidence interval, 1.15–9), MET (hazard ratio, 2.2; 95% confidence interval, 1.11–4.36, and CDK6 (hazard ratio, 1.81; 95% confidence interval, 0.94–3.51) were estimated. Kaplan-Meier plots of patient survival stratified by gene expression level (high/low) with selected probes are shown in Figure. Black line represents low expression; red line high expression. (B) Kaplan-Meier overall survival curves in relation to PRKCA, MET, and CDK6 expression levels in breast cancer patients. (C) Kaplan-Meier overall survival curves in relation to coexpression of PRKCA/MET, PRKCA/CDK6, and CDK6/MET in breast cancer patients. The NKI-295 database (28) was used for PRKCA, MET, CDK6, PRKCA/MET, PRKCA/CDK6, and CDK6/MET gene expression analysis and overall survival. A gene expression level within the first quartile was defined as positive. Blue line represents non-expression; green line single-expression; red line dual-expression. Cum, cumulative.
Dual-drug combinations of PKC-α, MET, and CDK6 inhibitors synergistically inhibit TNBC cell proliferation
Given that expression of two of the three kinases PKC-α, MET, and CDK6 was more highly correlated with patient survival than was expression of any one of the three kinases alone and that PRKCA/MET/CDK6 were not worse than in whom two kinases were coexpressed, we investigated the anti-TNBC efficacies of dual-drug combinations of safingol (a PKC-α and sphingosine kinase 1inhibitor), crizotinib (a MET inhibitor), and PD0332991 (a CDK4/6 inhibitor)—drugs that either are in clinical trials or have been approved by the Food and Drug Administration (and therefore could be readily tested in combination in clinical trials). As shown in Figure 5A, when two of the three kinase inhibitors were combined, the synergistic cytotoxic effects seemed to be higher in TNBC cells than in non-TNBC cells. In addition, normal epithelial cells (MCF10A) exhibited more resistance of all the dual-drug combinations under similar treatments conditions, suggesting that these dual-drug combinations preferentially kill TNBC cells over non-TNBC cancer cells or normal breast epithelial cells. To further demonstrate whether cancer stem cell population is more sensitive to the combination therapy, drug-treated MDA-MB-231 cells were subjected to fluorescence-activated cell sorting to determine the percentage of CD44+/CD24-/low population and assess the cells' ability to form mammospheres. As shown in Figure S2A, MDA-MB-231 cells treated with DMSO contained 81±5% CD44+/CD24-/low population while those treated with combination of safingol—crizotinib, safingol—PD0332991, or crizotinib—PD0332991 contained significantly less (34±12%, 24±12%, or 26±10% respectively). In addition, all three combinations and single drug treatments caused a decrease in mammosphere formation (Fig. S2B). Taken together, these findings support the notion that the stem-like MDA-MB-231 cells were more sensitive to these three dual-drug combinations than their non-stem like counterparts.
Figure 5.
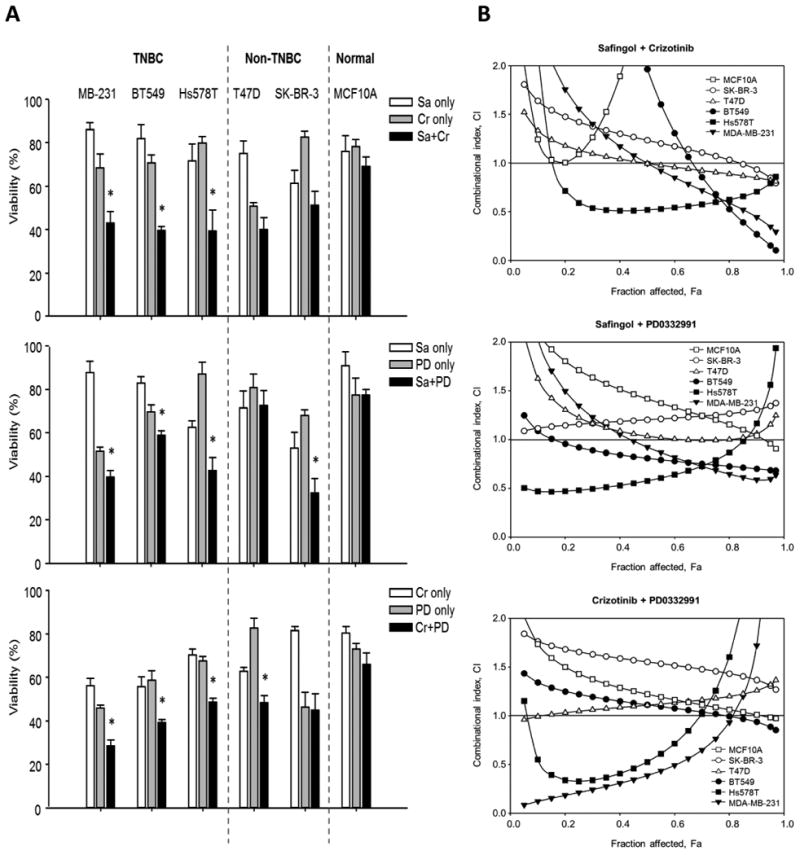
Dual drug combinations of PKC-α, MET, and CDK6 inhibitors synergistically inhibit TNBC cell growth. (A) TNBC cells (MDA-MB-231, BT549, and Hs578T), non-TNBC cells (T47D and SK-BR-3), and normal epithelial cells (MCF10A) were used to determine the specificities of the cytotoxic effects of safingol (SA), crizotinib (Cr), and PD0332991 (PD) in dual-drug combinations. Cells (1x10³ to 3x10³) were plated in 96-well plates, and cell growth was determined by MTT assay 2 days after cells were treated with an inhibitor or a combination of inhibitors.(B) CI plots for the dual-drug combinations of inhibitors in six breast cancer cells lines. Cells were treated with combinations of safingol (0, 0.5, 1, 2, 3, 4, or 5 μM), crizotinib (0, 1, 2, 3, 4, 5, or 6 μM), and PD0332991 (0, 1, 2, 4, 6, 8, or 10 μM) for 48 hours. Open and closed symbols represent non-TNBC and TNBC cells, respectively. CI values were plotted as a function of fractional inhibition as determined by MTT analysis and computer simulation (CompuSyn) for the Fa (fraction affected) range of 0.10 to 0.95. CIs of <1, 1, and >1 indicate synergism, additive effect, and antagonism, respectively. At least three independent experiments with three replicates were performed.
To further validate the synergistic killing effects of dual-drug combinations targeting PKC-α, MET, and CDK6, we carried out drug interaction analysis using the Chou-Talalay method to determine the combination index (CI) (37). TNBC cells were treated with safingol, crizotinib, or PD0332991 alone or in combination (safingol plus crizotinib, safingol plus PD0332991, or crizotinib plus PD0332991) at various concentrations. The CIs of the dual drug combinations are shown in Figure 5B; CI values of <1, =1, and >1 indicate that the two drugs in the combination have synergistic, additive, or antagonistic effects, respectively. All three dual-drug combinations synergistically inhibited TNBC cell proliferation, especially at the highest effective doses, which killed most cancer cells. The greatest synergism (CI) for the safingol-crizotinib combination was observed in MDA-MB-231 and BT549 cells at 95% effective doses with CI values of 0.35 and 0.15, respectively. However, for the crizotinib-PD0332991 combination, the greatest synergism observed in MDA-MB-231 and Hs578T cells was only at 50% effective doses with CI values of 0.39 and 0.53, respectively (Table 2). According to these results, the combination with the best therapeutic effect was safingol-crizotinib with the strongest synergism, followed by safingol-PD0332991 and crizotinib-PD0332991 in that order. Interestingly, the safingol-crizotinib combination treatment also showed a slight synergism in non-TNBC cancer cells (0.82 at 95% effective doses in T47D cells) and strong antagonistic effect in normal epithelial cells. These findings further indicate that these dual-drug combinations, especially safingol-crizotinib, may be effective against TNBC progression.
Table 2.
CIs of dual-drug combinations in different breast cancer cells.
| Drug combination | CI | |||
|---|---|---|---|---|
|
|
||||
| ED50 | ED75 | ED90 | ED95 | |
|
| ||||
| MDA-MB-231 | ||||
| Sa-Cr | 1.00 | 0.66 | 0.44 | 0.35 |
| Sa-PD | 1.03 | 0.70 | 0.57 | 0.57 |
| Cr-PD | 0.39 | 0.76 | 1.72 | 3.27 |
| BT549 | ||||
| Sa-Cr | 1.96 | 0.68 | 0.27 | 0.15 |
| Sa-PD | 0.81 | 0.74 | 0.70 | 0.69 |
| Cr-PD | 1.11 | 1.02 | 0.94 | 0.89 |
| Hs578T | ||||
| Sa-Cr | 0.52 | 0.60 | 0.71 | 0.79 |
| Sa-PD | 0.58 | 0.79 | 1.17 | 1.56 |
| Cr-PD | 0.53 | 1.26 | 3.20 | 6.05 |
| SK-BR-3 | ||||
| Sa-Cr | 1.23 | 1.07 | 0.93 | 0.84 |
| Sa-PD | 1.20 | 1.25 | 1.30 | 1.34 |
| Cr-PD | 1.55 | 1.45 | 1.36 | 1.31 |
| T47D | ||||
| Sa-Cr | 0.99 | 0.90 | 0.85 | 0.82 |
| Sa-PD | 1.04 | 0.99 | 1.06 | 1.15 |
| Cr-PD | 1.11 | 1.18 | 1.26 | 1.32 |
| MCF10A | ||||
| Sa-Cr | 3.03 | 13.10 | 59.89 | 168.96 |
| Sa-PD | 1.42 | 1.20 | 1.04 | 0.96 |
| Cr-PD | 1.22 | 1.09 | 1.01 | 0.98 |
Note: TNBC cells (MDA-MB-231, BT549, and Hs578T), non-TNBC cells (T47D and SK-BR-3), and normal epithelial cells (MCF10A) were used to determine the CI index of safingol (SA), crizotinib (Cr), and PD0332991 (PD) in dual-drug combinations. CIs of <1, 1, and >1 indicate synergism, additive effect, and antagonism, respectively. ED, effective dose. CI index <0.9 was labeled as bold text.
Combined inhibition of PKC-α and MET suppressesTNBC tumorigenesis in vitro and in vivo
Next, we examined the effects of the dual drug combinations on the tumorigenic potential of TNBC cells. All three combinations efficiently inhibited colony-forming ability in BT549 cells (Fig. 6A). Safingol combined with crizotinib or PD0332991 suppressed anchorage-independent colony formation more efficiently than did any one of the drugs by it self in both MDA-MB-231 and BT549 cells (Fig. 6B). However, crizotinib combined with PD0332991 did not inhibit anchorage-independent growth more efficiently than PD0332991 alone; suggesting that inhibition of PKC-α activity is required for optimal killing of TNBC cells. Indeed, PKC-α was recently identified as a central signaling node in non-CSC to CSC transformation and has been proposed as a potential therapeutic target for breast cancer (38). We further examined PKC-α expression and patient outcomes with a TNBC tissue microarray by immunohistochemistry analysis, with results indicating that the survival rate was worse in TNBC patients with high levels of PKC-α expression than those with low levels (p = 0.045; Fig. 6C). Collectively, our findings suggest that PKC-α is a unique prognostic indicator of TNBC patient survival.
Given that the safingol-crizotinib combination consistently showed synergistic killing effect from multiple in vitro assays, we further evaluated the efficacy of the safingol-crizotinib combination in a TNBC orthotopic xenograft mouse model. In agreement with results from our in vitro assays, the safingol-crizotinib combination was more effective in reducing tumor growth than was either single-drug treatment or vehicle control treatment (Fig. 6D). The inhibition efficiency in mice was 68% for the combination (CI = 0.43) but only 6% (p = 0.006) and 21% (p = 0.002) for safingol alone and crizotinib alone, respectively. We did not observe any significant body weight changes when mice were treated with the safingol or crizotinib alone or in combination (Fig. 6E). These results suggest that the dual-drug combination of PKC-α with MET may be effective against TNBC and could be readily applied for marker-guided clinical trials as inhibitors of the TNBC-related kinases are available in clinical trials or have been approved by FDA.
Discussion
Our analysis with multiple cell line and patient databases identified eight TNBC-related kinases—MET, FYN, PKC-α, MAP4K4, LYN, PI3K δ, CDK6, and RSK-2—that are commonly overexpressed in TNBC/BTICs. Of these eight kinases, PKC-α, MET and CDK6 associated with the worst survival outcomes in breast cancer patients. Dual-drug combinations that target these three kinases synergistically inhibited TNBC cell proliferation and in vitro tumorigenic potential. The combination that showed the strongest synergism (PKC-α and MET inhibition) also synergistically (CI = 0.43, Fig. 6D) attenuated tumor growth in vivo. Our findings suggest that combining drugs already in use may accelerate the availability of marker-guided therapy for TNBC.
Currently, the most promising clinical target for TNBC is the enzyme PARP, a member of the family of nuclear enzymes involved in the detection and repair of DNA damage (39). There are at least five PARP inhibitors that are in clinical trials, and among them, BSI-201 (40) (Iniparib) and AZD2281 (41) (olaparib) have been evaluated in multiple clinical trials in women with metastatic breast cancer. However, the results indicated that the reduced rate of tumor regression was observed mostly in patients with the BRCA1 or BRCA2 mutations (42). Thus, efficacy of PARP inhibitors in patients with TNBC is still nuclear (43). Recent encouraging data showed that inhibition of PI3K impairs DNA homologous recombination and sensitizes TNBC without BRCA mutations to poly(ADP-ribose) inhibition (44). However, this mechanism has yet to be tested in patients, and important questions remain unanswered.
TNBC is the most heterogeneous subtype of breast cancer, and since no individual cell line represents the heterogeneity of TNBC, it is difficult to find an appropriate TNBC model, The well-established cell-based systems, such as the BPLER cancer cell line derived from human primary breast epithelial cells, have a TNBC-like phenotype in vitro and are highly enriched for BTICs (45). Although BPLER mimics TNBC, this system is most appropriate for the basal-like TNBC subtype, which accounts for about half of TNBC cases (46). In identifying thirteen TNBC-related kinases that are expressed in most TNBC subtypes (Fig. 1C), including the basal-like and mesenchymal-like subtypes, our study overcame some of the limitations associated with TNBC heterogeneity.
In the absence of major growth stimulation on their surface, TNBC cells may rely on downstream signaling to compensate for the loss of cell surface signaling to support cell growth. Kinases are ideal target molecules, as they transmit signals; control complex cellular processes; and are frequently activated in cancer by mutation, constitutive activation, or overexpression. A gene expression profiling study of 102 human breast tumors identified several kinases as druggable targets in ER-negative breast cancer (47). The identification of LYN, MAP4K4, MET, and RPS6KA3 kinases in both that study and ours suggests that these kinases are common regulators in TNBC. We further showed that dual drug combinations using PKC-α, CDK6, and MET kinase inhibitors enhanced the killing on TNBC cells, reduced the tumorigenic phenotype of cells in vitro, and synergistically impeded tumor growth in vivo. These results further attest to the critical role these kinases play in transmitting oncogenic signaling in TNBC. It may be worthwhile to test the efficacy of other dual-drug combinations in an animal model. However, our findings indicate that the combination of PKC-α and MET inhibitors is efficacious against tumors in mice and should be tested in TNBC patients.
Our study, together with the previous reports, suggests that PKC-α plays an important role in both TNBC and BTICs. An inverse relationship between PKC-α activity and ER expression in human breast cell lines and tumors was firmly established over 25 years ago, with ER-negative cells expressing significantly higher levels of PKC-α than the levels expressed in ER-positive cancer cells (48). PKC-α overexpression has also been suggested to play a role in growth signaling when breast cancer shifts from hormone dependence to hormone independence (49). More recently, PDGFR/PKC-α/FRA1 signaling was identified upon activation of epithelial-mesenchymal transition from non CSCs to CSCs, and inhibition of either PKC-α or FRA1 was suggested to have potential therapeutic value in aggressive breast cancer (38). Although the role of PKC-α in breast cancer has been established, none of the clinical trials using PKC-α inhibitors specifically targeted TNBC, ER-negative breast cancer or metastatic breast cancer. Our study has demonstrated an association between PKC-α and TNBC both in cell lines and in patient tumors, and our findings indicate that PKC-α is a unique prognostic marker and a potential therapeutic target for TNBC.
Supplementary Material
Acknowledgments
We thank Arthur Gelmis from Scientific Publications at MD Anderson for editing the manuscript, and Su Zhang, Jian Guan Shi, Zhenbo Han, Jin-Fong Lee and Junyan Wang for technical assistance. STR DNA fingerprinting was performed at the Cancer Center Support Grant-funded Characterized Cell Line Core Facility of MD Anderson Cancer Center (NCI grant CA016672).
Grant Support: This study was funded in part by: National Institutes of Health grants (CA109311, CA099031, and CCSG CA16672); National Breast Cancer Foundation, Inc.; Breast Cancer Research Foundation; The University of Texas MD Anderson-China Medical University and Hospital Sister Institution Fund (to M.-C. Hung); Ministry of Health and Welfare, China Medical University Hospital Cancer Research Center of Excellence (MOHW103-TD-B-111; Taiwan), the Program for Stem Cell and Regenerative Medicine Frontier Research (NSC102-2321-B-039; Taiwan), International Research-Intensive Centers of Excellence in Taiwan (NSC103-2911-I-002); and Center for Biological Pathways; Postdoctoral Research Abroad Program (grant 101IP999900059 from the National Science Council of Taiwan; to Y.-H. Hsu).
Footnotes
Disclosure of Potential Conflicts of Interest: The authors have no conflicts of interest to disclose.
Authors' Contributions: Conception and design: Y.-H. Hsu and M.-C. Hung.
Development of methodology: Y.-H. Hsu, J. Yao, and M.-C. Hung.
Acquisition of data (provision of animals and facilities, enrollment and management of patients): Y.-H. Hsu, T.-J. Wu, L.-C. Chan, M.-K. Chen, Y.-F. Fang, Y. Wei, J. Shen, W.-C. Huang, C.-L. Liu, Y.-C. Chang, Y. Wu, and A. A. Sahin.
Analysis and interpretation of data (statistical analysis, biostatistics, computational analysis): Y.-H. Hsu, T.-J. Wu, J. Yao, Y. Wei, and M.-C. Hung.
Writing, review, and/or revision of the manuscript: Y.-H. Hsu, J. L. Hsu, J. Yao, and M.-C. Hung.
Administrative, technical, or material support (reporting or organizing data, constructing databases): Y.-H. Hsu, C.-W. Li, J. Shen, M.-Y. Wang, W.-C. Huang, C.-L. Liu, Y.-C. Chang, Y. Wu, and A. A. Sahin.
Study supervision: Anil Sood, Gordon B. Mills, Dihua Yu, G. N. Hortobagyi and M.-C. Hung.
References
- 1.Foulkes WD, Smith IE, Reis-Filho JS. Triple-negative breast cancer. N Engl J Med. 2010;363:1938–48. doi: 10.1056/NEJMra1001389. [DOI] [PubMed] [Google Scholar]
- 2.Lehmann BD, Bauer JA, Chen X, Sanders ME, Chakravarthy AB, Shyr Y, et al. Identification of human triple-negative breast cancer subtypes and preclinical models for selection of targeted therapies. J Clin Invest. 2011;121:2750–67. doi: 10.1172/JCI45014. [DOI] [PMC free article] [PubMed] [Google Scholar]
- 3.Dent R, Trudeau M, Pritchard KI, Hanna WM, Kahn HK, Sawka CA, et al. Triple-negative breast cancer: clinical features and patterns of recurrence. Clin Cancer Res. 2007;13:4429–34. doi: 10.1158/1078-0432.CCR-06-3045. [DOI] [PubMed] [Google Scholar]
- 4.Carey L, Winer E, Viale G, Cameron D, Gianni L. Triple-negative breast cancer: disease entity or title of convenience? Nat Rev Clin Oncol. 2010;7:683–92. doi: 10.1038/nrclinonc.2010.154. [DOI] [PubMed] [Google Scholar]
- 5.Liedtke C, Mazouni C, Hess KR, Andre F, Tordai A, Mejia JA, et al. Response to neoadjuvant therapy and long-term survival in patients with triple-negative breast cancer. J Clin Oncol. 2008;26:1275–81. doi: 10.1200/JCO.2007.14.4147. [DOI] [PubMed] [Google Scholar]
- 6.Dick JE. Stem cell concepts renew cancer research. Blood. 2008;112:4793–807. doi: 10.1182/blood-2008-08-077941. [DOI] [PubMed] [Google Scholar]
- 7.Li X, Lewis MT, Huang J, Gutierrez C, Osborne CK, Wu MF, et al. Intrinsic resistance of tumorigenic breast cancer cells to chemotherapy. J Natl Cancer Inst. 2008;100:672–9. doi: 10.1093/jnci/djn123. [DOI] [PubMed] [Google Scholar]
- 8.Park CY, Tseng D, Weissman IL. Cancer stem cell-directed therapies: recent data from the laboratory and clinic. Mol Ther. 2009;17:219–30. doi: 10.1038/mt.2008.254. [DOI] [PMC free article] [PubMed] [Google Scholar]
- 9.Gupta PB, Onder TT, Jiang G, Tao K, Kuperwasser C, Weinberg RA, et al. Identification of selective inhibitors of cancer stem cells by high-throughput screening. Cell. 2009;138:645–59. doi: 10.1016/j.cell.2009.06.034. [DOI] [PMC free article] [PubMed] [Google Scholar]
- 10.Al-Hajj M, Wicha MS, Benito-Hernandez A, Morrison SJ, Clarke MF. Prospective identification of tumorigenic breast cancer cells. Proc Natl Acad Sci U S A. 2003;100:3983–8. doi: 10.1073/pnas.0530291100. [DOI] [PMC free article] [PubMed] [Google Scholar]
- 11.Ginestier C, Hur MH, Charafe-Jauffret E, Monville F, Dutcher J, Brown M, et al. ALDH1 is a marker of normal and malignant human mammary stem cells and a predictor of poor clinical outcome. Cell Stem Cell. 2007;1:555–67. doi: 10.1016/j.stem.2007.08.014. [DOI] [PMC free article] [PubMed] [Google Scholar]
- 12.Reya T, Morrison SJ, Clarke MF, Weissman IL. Stem cells, cancer, and cancer stem cells. Nature. 2001;414:105–11. doi: 10.1038/35102167. [DOI] [PubMed] [Google Scholar]
- 13.Rossi DJ, Jamieson CH, Weissman IL. Stems cells and the pathways to aging and cancer. Cell. 2008;132:681–96. doi: 10.1016/j.cell.2008.01.036. [DOI] [PubMed] [Google Scholar]
- 14.Creighton CJ, Li X, Landis M, Dixon JM, Neumeister VM, Sjolund A, et al. Residual breast cancers after conventional therapy display mesenchymal as well as tumor-initiating features. Proc Natl Acad Sci U S A. 2009;106:13820–5. doi: 10.1073/pnas.0905718106. [DOI] [PMC free article] [PubMed] [Google Scholar]
- 15.Sotiriou C, Pusztai L. Gene-expression signatures in breast cancer. N Engl J Med. 2009;360:790–800. doi: 10.1056/NEJMra0801289. [DOI] [PubMed] [Google Scholar]
- 16.Cancer Genome Atlas N. Comprehensive molecular portraits of human breast tumours. Nature. 2012;490:61–70. doi: 10.1038/nature11412. [DOI] [PMC free article] [PubMed] [Google Scholar]
- 17.Bendell JC, Rodon J, Burris HA, de Jonge M, Verweij J, Birle D, et al. Phase I, dose-escalation study of BKM120, an oral pan-Class I PI3K inhibitor, in patients with advanced solid tumors. J Clin Oncol. 2012;30:282–90. doi: 10.1200/JCO.2011.36.1360. [DOI] [PubMed] [Google Scholar]
- 18.Moreno Garcia V. A phase I study evaluating GDC-0941, an oral phosphoinositide-3 kinase (PI3K) inhibitor, in patients with advanced solid tumors or multiple myeloma. J Clin Oncol. 2011;29:a3021. [Google Scholar]
- 19.Wagner A. A first-in-human phase I study to evaluate GDC-0980, an oral PI3K/mTOR inhibitor, administered QD in patients with advanced solid tumors. J Clin Oncol. 2011;29:a3020. [Google Scholar]
- 20.Yap TA. First-in-man clinical trial of the oral pan-AKT inhibitor MK-2206 in patients with advanced solid tumors. J Clin Oncol. 2011;29:4688–95. doi: 10.1200/JCO.2011.35.5263. [DOI] [PubMed] [Google Scholar]
- 21.Engels BM, Hutvagner G. Principles and effects of microRNA-mediated post-transcriptional gene regulation. Oncogene. 2006;25:6163–9. doi: 10.1038/sj.onc.1209909. [DOI] [PubMed] [Google Scholar]
- 22.Romano P, Manniello A, Aresu O, Armento M, Cesaro M, Parodi B. Cell Line Data Base: structure and recent improvements towards molecular authentication of human cell lines. Nucleic Acids Res. 2009;37:D925–32. doi: 10.1093/nar/gkn730. [DOI] [PMC free article] [PubMed] [Google Scholar]
- 23.Barretina J, Caponigro G, Stransky N, Venkatesan K, Margolin AA, Kim S, et al. The Cancer Cell Line Encyclopedia enables predictive modelling of anticancer drug sensitivity. Nature. 2012;483:603–7. doi: 10.1038/nature11003. [DOI] [PMC free article] [PubMed] [Google Scholar]
- 24.Komurov K, Dursun S, Erdin S, Ram PT. NetWalker: a contextual network analysis tool for functional genomics. BMC Genomics. 2012;13:282. doi: 10.1186/1471-2164-13-282. [DOI] [PMC free article] [PubMed] [Google Scholar]
- 25.Eisen MB, Spellman PT, Brown PO, Botstein D. Cluster analysis and display of genome-wide expression patterns. Proc Natl Acad Sci U S A. 1998;95:14863–8. doi: 10.1073/pnas.95.25.14863. [DOI] [PMC free article] [PubMed] [Google Scholar]
- 26.Sokal RR, Michener CD, Kansas Uo. A Statistical Method for Evaluating Systematic Relationships. University of Kansas; 1958. [Google Scholar]
- 27.Bolt MW, Mahoney PA. High-efficiency blotting of proteins of diverse sizes following sodium dodecyl sulfate-polyacrylamide gel electrophoresis. Anal Biochem. 1997;247:185–92. doi: 10.1006/abio.1997.2061. [DOI] [PubMed] [Google Scholar]
- 28.van de Vijver MJ, He YD, van't Veer LJ, Dai H, Hart AA, Voskuil DW, et al. A gene-expression signature as a predictor of survival in breast cancer. N Engl J Med. 2002;347:1999–2009. doi: 10.1056/NEJMoa021967. [DOI] [PubMed] [Google Scholar]
- 29.Chou TC. Drug combination studies and their synergy quantification using the Chou-Talalay method. Cancer Res. 2010;70:440–6. doi: 10.1158/0008-5472.CAN-09-1947. [DOI] [PubMed] [Google Scholar]
- 30.Kentsis A, Reed C, Rice KL, Sanda T, Rodig SJ, Tholouli E, et al. Autocrine activation of the MET receptor tyrosine kinase in acute myeloid leukemia. Nat Med. 2012;18:1118–22. doi: 10.1038/nm.2819. [DOI] [PMC free article] [PubMed] [Google Scholar]
- 31.Zou HY, Li Q, Lee JH, Arango ME, McDonnell SR, Yamazaki S, et al. An orally available small-molecule inhibitor of c-Met, PF-2341066, exhibits cytoreductive antitumor efficacy through antiproliferative and antiangiogenic mechanisms. Cancer Res. 2007;67:4408–17. doi: 10.1158/0008-5472.CAN-06-4443. [DOI] [PubMed] [Google Scholar]
- 32.Kedderis LB, Bozigian HP, Kleeman JM, Hall RL, Palmer TE, Harrison SD, Jr, et al. Toxicity of the protein kinase C inhibitor safingol administered alone and in combination with chemotherapeutic agents. Fundamental and applied toxicology : official journal of the Society of Toxicology. 1995;25:201–17. doi: 10.1006/faat.1995.1056. [DOI] [PubMed] [Google Scholar]
- 33.Tan KB, Ling LU, Bunte RM, Chng WJ, Chiu GN. In vivo efficacy of a novel liposomal formulation of safingol in the treatment of acute myeloid leukemia. Journal of controlled release : official journal of the Controlled Release Society. 2012;160:290–8. doi: 10.1016/j.jconrel.2011.11.002. [DOI] [PubMed] [Google Scholar]
- 34.Sokilde R, Kaczkowski B, Podolska A, Cirera S, Gorodkin J, Moller S, et al. Global microRNA analysis of the NCI-60 cancer cell panel. Mol Cancer Ther. 2011;10:375–84. doi: 10.1158/1535-7163.MCT-10-0605. [DOI] [PubMed] [Google Scholar]
- 35.Chang CJ, Chao CH, Xia W, Yang JY, Xiong Y, Li CW, et al. p53 regulates epithelial-mesenchymal transition and stem cell properties through modulating miRNAs. Nat Cell Biol. 2011;13:317–23. doi: 10.1038/ncb2173. [DOI] [PMC free article] [PubMed] [Google Scholar]
- 36.Gyorffy B, Lanczky A, Eklund AC, Denkert C, Budczies J, Li Q, et al. An online survival analysis tool to rapidly assess the effect of 22,277 genes on breast cancer prognosis using microarray data of 1,809 patients. Breast Cancer Res Treat. 2010;123:725–31. doi: 10.1007/s10549-009-0674-9. [DOI] [PubMed] [Google Scholar]
- 37.Chou TC, Talalay P. Quantitative analysis of dose-effect relationships: the combined effects of multiple drugs or enzyme inhibitors. Advances in enzyme regulation. 1984;22:27–55. doi: 10.1016/0065-2571(84)90007-4. [DOI] [PubMed] [Google Scholar]
- 38.Tam Wai L, Lu H, Buikhuisen J, Soh Boon S, Lim E, Reinhardt F, et al. Protein Kinase C ± Is a Central Signaling Node and Therapeutic Target for Breast Cancer Stem Cells. Cancer cell. 2013;24:347–64. doi: 10.1016/j.ccr.2013.08.005. [DOI] [PMC free article] [PubMed] [Google Scholar]
- 39.Ashworth A. A synthetic lethal therapeutic approach: poly(ADP) ribose polymerase inhibitors for the treatment of cancers deficient in DNA double-strand break repair. J Clin Oncol. 2008;26:3785–90. doi: 10.1200/JCO.2008.16.0812. [DOI] [PubMed] [Google Scholar]
- 40.BiPar Sciences presents interim phase 2 results for PARP inhibitor BSI-201 at San Antonio Breast Cancer Symposium. Cancer Biol Ther. 2009;8:2–3. doi: 10.4161/cbt.8.1.7613. [DOI] [PubMed] [Google Scholar]
- 41.Liu JF, Tolaney SM, Birrer M, Fleming GF, Buss MK, Dahlberg SE, et al. A Phase 1 trial of the poly(ADP-ribose) polymerase inhibitor olaparib (AZD2281) in combination with the anti-angiogenic cediranib (AZD2171) in recurrent epithelial ovarian or triple-negative breast cancer. European Journal of Cancer. 2013;49:2972–8. doi: 10.1016/j.ejca.2013.05.020. [DOI] [PMC free article] [PubMed] [Google Scholar]
- 42.Hutchinson L. Targeted therapies: PARP inhibitor olaparib is safe and effective in patients with BRCA1 and BRCA2 mutations. Nat Rev Clin Oncol. 2010;7:549. doi: 10.1038/nrclinonc.2010.143. [DOI] [PubMed] [Google Scholar]
- 43.Dent RA, Lindeman GJ, Clemons M, Wildiers H, Chan A, McCarthy NJ, et al. Phase I trial of the oral PARP inhibitor olaparib in combination with paclitaxel for first- or second-line treatment of patients with metastatic triple-negative breast cancer. Breast Cancer Res. 2013;15:R88. doi: 10.1186/bcr3484. [DOI] [PMC free article] [PubMed] [Google Scholar]
- 44.Ibrahim YH, Garcia-Garcia C, Serra V, He L, Torres-Lockhart K, Prat A, et al. PI3K Inhibition Impairs BRCA1/2 Expression and Sensitizes BRCA-Proficient Triple-Negative Breast Cancer to PARP Inhibition. Cancer discovery. 2012;2:1036–47. doi: 10.1158/2159-8290.CD-11-0348. [DOI] [PMC free article] [PubMed] [Google Scholar]
- 45.Ince TA, Richardson AL, Bell GW, Saitoh M, Godar S, Karnoub AE, et al. Transformation of different human breast epithelial cell types leads to distinct tumor phenotypes. Cancer Cell. 2007;12:160–70. doi: 10.1016/j.ccr.2007.06.013. [DOI] [PubMed] [Google Scholar]
- 46.Petrocca F, Altschuler G, Tan SM, Mendillo ML, Yan H, Jerry DJ, et al. A Genome-wide siRNA Screen Identifies Proteasome Addiction as a Vulnerability of Basal-like Triple-Negative Breast Cancer Cells. Cancer Cell. 2013;24:182–96. doi: 10.1016/j.ccr.2013.07.008. [DOI] [PMC free article] [PubMed] [Google Scholar]
- 47.Speers C, Tsimelzon A, Sexton K, Herrick AM, Gutierrez C, Culhane A, et al. Identification of novel kinase targets for the treatment of estrogen receptor-negative breast cancer. Clin Cancer Res. 2009;15:6327–40. doi: 10.1158/1078-0432.CCR-09-1107. [DOI] [PMC free article] [PubMed] [Google Scholar]
- 48.Borner C, Wyss R, Regazzi R, Eppenberger U, Fabbro D. Immunological quantitation of phospholipid/Ca2+-dependent protein kinase of human mammary carcinoma cells: inverse relationship to estrogen receptors. Int J Cancer. 1987;40:344–8. doi: 10.1002/ijc.2910400310. [DOI] [PubMed] [Google Scholar]
- 49.Tonetti DA, Chisamore MJ, Grdina W, Schurz H, Jordan VC. Stable transfection of protein kinase C alpha cDNA in hormone dependent breast cancer cell lines. Brit J Cancer. 2000;83:782–91. doi: 10.1054/bjoc.2000.1326. [DOI] [PMC free article] [PubMed] [Google Scholar]
Associated Data
This section collects any data citations, data availability statements, or supplementary materials included in this article.