

Abstract
Objectives:
We sought to examine whether a posterior distribution of white matter hyperintensities (WMH) is an independent predictor of pathologically confirmed cerebral amyloid angiopathy (CAA) and whether it is associated with MRI markers of CAA, in patients without lobar intracerebral hemorrhage.
Methods:
We developed a quantitative method to measure anteroposterior (AP) distribution of WMH. A retrospective cohort of patients without intracerebral hemorrhage and with pathologic evaluation of CAA was examined to determine whether posterior WMH distribution was an independent predictor of CAA (n = 59). The relationship of AP distributions of WMH to strictly lobar microbleeds (MBs) (n = 259) and location of dilated perivascular spaces (DPVS) (n = 85) was examined in a separate cohort of patients evaluated in a memory clinic.
Results:
A more posterior WMH distribution was found to be an independent predictor of pathologic evidence of CAA (p = 0.001, odds ratio [95% confidence interval] = 1.19 [1.07–1.32]), even in the subgroup without lobar MBs (p = 0.016, odds ratio [95% confidence interval] = 1.18 [1.03–1.36]). In the memory clinic cohort, strictly lobar MBs were independently associated with more posterior WMH distribution (p = 0.009). AP distribution of WMH was also associated with location of DPVS (p = 0.001), in that patients with predominant DPVS in the white matter over the basal ganglia harbored a more posterior WMH distribution.
Conclusions:
Our results suggest that AP distribution of WMH may represent an additional marker of CAA, irrespective of the presence of lobar hemorrhages.
Classification of evidence:
This study provides Class III evidence that there is a significant association between the AP distribution of WMH on MRI with the presence of pathologically confirmed CAA pathology.
Although large lobar intracerebral hemorrhage (ICH) is a classic manifestation of cerebral amyloid angiopathy (CAA)1,2 and can often be used to identify patients with the disease, increasing evidence suggests that many patients with CAA may never have ICH. These individuals may be asymptomatic,3,4 have cognitive impairment,5 or have transient neurologic symptoms.6 MRI markers of cerebral small-vessel disease could be used to identify CAA in patients without ICH. For example, strictly lobar microbleeds (MBs) are highly suggestive of the disease.4,7,8 Accumulating evidence also suggests that dilated perivascular spaces (DPVS) in the white matter (WM-DPVS) may also be associated with CAA.9–11
Anteroposterior (AP) distribution of white matter hyperintensities (WMH) varies across different populations. Frontal predominance of WMH has been observed in normal elderly,12 whereas occipital predominance of WMH has been observed in patients with CAA-related ICH.13–15 However, a reliable quantitative method to assess AP distribution of WMH in patients with CAA who do not have ICH has not been established. Also, the precise relationship of WMH distribution with other neuroimaging markers of CAA has not been explored.
In this study, we developed a quantitative method to assess the AP distribution of WMH in patients without ICH. We aimed to determine whether a posterior distribution of WMH can be an independent predictor of pathologic evidence of CAA. In addition, we hypothesized that a posterior distribution of WMH would correlate with a strictly lobar pattern of MB, and with a high burden of WM-DPVS.
METHODS
Primary research question.
Can posterior WMH distribution be a predictor of pathologic evidence of CAA? This study provides Class III evidence that there is a significant association between the AP distribution of WMH on MRI with the presence of pathologically confirmed CAA: the mean AP center of WMH in CAA vs non-CAA subjects was 7.52 vs 16.86; odds ratio (OR) (95% confidence interval [CI]) = 1.19 (1.07–1.32) (p = 0.001).
Study population.
This study consists of 2 parts: a retrospective cohort study of the association between WMH distribution and pathologic evidence of CAA, and a cross-sectional study of the association between WMH distribution and MRI markers of CAA.
AP distribution of WMH in relation to CAA pathology.
Patients were derived from a cohort that is part of an ongoing study examining the diagnostic value of lobar hemorrhages for CAA and was drawn from patients seen at the Massachusetts General Hospital between 1998 and 2012 fulfilling the following criteria: age older than 55 years, existence of at least one brain MRI with hemosiderin-specific sequences, and existence of either brain biopsy or brain autopsy with CAA assessment. CAA was defined as the presence of any degree of vascular amyloid deposition (Vonsattel grade ≥1).16 MRI study closest to date of pathologic study was examined. Only cases without history of ICH were included (n = 72). Patients were excluded (n = 13) if (1) clinical and/or neuroimaging data suggested the presence of WM abnormalities of nonischemic nature (inflammatory, tumoral, infectious), or (2) large structural abnormalities were present, preventing an accurate, bilateral assessment of WMH (e.g., large territorial ischemic infarcts). Clinical variables assessed were age, sex, and hypertension. Hypertension was considered when the patient had a history of high blood pressure (>140/90 mm Hg). The subgroup of patients without MBs (n = 37) was also analyzed.
AP distribution of WMH and MRI markers of CAA.
Patients were drawn from an ongoing longitudinal cohort of the Massachusetts Alzheimer's Disease Research Center between 2007 and 2010, previously described in detail.17 Basically, it is a prospective cohort enrolling subjects since 2005 with intact cognition, mild cognitive impairment, and dementia. All enrolled subjects had signed a written informed consent. For this study, those who had cognitive impairment (Clinical Dementia Rating ≥0.5) and had a clinical evaluation performed within 1 year interval of brain MRI scan were included, as described previously.10 A total of 290 patients were eligible for analysis. Patients who had MRI of insufficient quality (n = 5), or a deep or mixed pattern of MB (n = 26) were excluded, leaving 259 patients for analysis. Age, sex, hypertension, diabetes, hypercholesterolemia, ischemic heart disease, stroke, and current medications (anticoagulant, antiplatelet, and statin) were recorded. Hypertension was defined a history of high blood pressure (>140/90 mm Hg). Diabetes and hypercholesterolemia were defined as previous diagnosis of the diseases. Ischemic heart disease was defined as a history of angina or acute coronary syndrome. Stroke was considered if the patient had a history of ischemic stroke. No patients had hemorrhagic stroke.
To specifically examine the relationship between AP distribution of WMH and DPVS, degree of DPVS was rated on T1 magnetization-prepared rapid-acquisition gradient echo (MPRAGE) sequences, when available. Of 259 patients included in the analysis above, 89 patients had a T1 MPRAGE sequence. Four patients were excluded because of insufficient T1 MPRAGE quality, leaving 85 patients for analysis.
Standard protocol approvals, registrations, and patient consents.
This study was performed with approval and in accordance with the guidelines of the institutional review boards of Massachusetts General Hospital.
Imaging acquisition.
Subjects underwent either 3T or 1.5T MRI scans. Protocol of 3T MRI (Siemens Trio, Munich, Germany) included the following sequences: MPRAGE T1 (slice thickness 1 mm, interslice gap 0 mm, in-plane resolution 1 × 1 × 1, repetition time [TR] 2,530 milliseconds, echo time [TE] 1.61/3.39/5.17/6.95 milliseconds, 4 echoes, flip angle 7°, acquisition matrix 256 × 256 mm, field of view [FOV] 256 × 256); T2-weighted (slice thickness 5 mm, interslice gap 1 mm, in-plane resolution 1 × 1 × 1, TR 4,940 milliseconds, TE 103 milliseconds, flip angle 90°, acquisition matrix 256 × 256, FOV 220 × 220 mm); 3-dimensional fluid-attenuated inversion recovery (FLAIR) (slice thickness 1 mm, interslice gap 0 mm, in-plane resolution 1 × 1 × 1, TR 6,000 milliseconds, TE 303 milliseconds, flip angle 120°, acquisition matrix 256 × 256, FOV 256 × 256 mm); and susceptibility-weighted imaging (slice thickness 1.2 mm, interslice gap 0 mm, in-plane resolution 0.5 × 0.5 × 0.5, TR 27 milliseconds, TE 21 milliseconds, flip angle 15°, acquisition matrix 448 × 299, FOV 224 × 150 mm). Protocols of 1.5T MRI (Signa; General Electric Medical Systems, Milwaukee, WI) are as follows: T2-weighted (slice thickness 5 mm, interslice gap 1 mm, TR 6,025 milliseconds, TE 102 milliseconds, acquisition matrix 256 × 256); axial FLAIR (slice thickness 5 mm, interslice gap 1 mm, TR 10,000 milliseconds, TE 140 milliseconds, acquisition matrix 256 × 256); gradient-echo sequence (slice thickness 5 mm, interslice gap 1 mm, TR 750 milliseconds, TE 24 milliseconds, acquisition matrix 256 × 144).
Neuroimaging analysis.
The presence of strictly lobar MB, DPVS location and severity, WMH volume, and AP distribution (AP center of WMH) were analyzed.
MBs were assessed on susceptibility-weighted imaging or gradient-echo axial sequences as previously described.18 MBs were defined as focal round or ovoid area of marked signal loss that was not a vascular flow void, mineralization, or cavernous malformation. MB topographic location was noted. Strictly lobar location was defined as MB presence exclusively in the cortico-subcortical regions of the cerebrum with or without additional MBs in the cerebellum.
DPVS were defined as round, ovoid, or linear structures with CSF-like signal, not larger than 2 mm in diameter, and located in perforating arteries territories.19 DPVS were assessed on MPRAGE T1 sequences, with a confirmation of CSF-liked signal in T2 sequences, and were rated in degree from 1 to 4 in both basal ganglia areas (BG-DPVS) and WM areas (WM-DPVS) as previously described.20 We then defined a composite variable containing 3 categories by comparing degree of DPVS in BG and WM areas: (1) higher degree in BG, (2) equal degree in BG and WM, and (3) higher degree in WM.
WMH volumes were measured, excluding infratentorial regions, on FLAIR sequences using a semiautomated segmentation method as previously described.21 Logarithmic transformation was applied to achieve a more normal distribution of WMH volume.
MBs, DPVS, and WMH volume were rated by a trained neurologist (S.M.-R.) blinded to clinical data. MRIcroN (http://www.mricro.com) and Analyze software (http://www.analyzedirect.com) were used for these analyses. We have previously reported a high interrater agreement within our group for MB7 and WMH,21 and acceptable reliability for DPVS assessment.10
The AP center of WMH was calculated in the following way. The center of WMH volume on the coronal plane (AP axis) was computed using MRIcroN software and compared with a reference point. To determine the reference point (figure 1), first, we identified 2 anatomical landmarks (points A and P). Point A was defined as the most anterior part on the wall of frontal horn of lateral ventricle. Point P was defined as the most posterior part of the dura mater covering the occipital cortex. Next, we measured distances (pixels) from the origin (O) to both points A and P in the coronal axis ( and
and  ). The reference point was defined as the midpoint between points A and P. Distance from the origin to the reference point (
 ) was calculated by averaging
  and
and  . Finally, the AP center of WMH was calculated using the following equation: AP center of WMH = [(center of WMH volume −
  )/
)/ ] × 100. Higher values indicate a more anterior distribution of WMH, and lower values indicate the more posterior distributions. This variable was rated and calculated by a trained physician (S.T.) blinded to clinical data. It is conceivable that variation in head position between MRI scans could lead to significant variation in determined values of AP center of WMH. Therefore, to assess the reproducibility of this measure between different scans, AP center of WMH was determined on a random sample of 10 patients who had 2 MRI scans within a year. Intraclass correlation coefficient for the agreement of WMH volume and of the AP center of WMH between 2 scans was 0.966 (95% CI = 0.869–0.991) and 0.949 (95% CI = 0.810–0.987), respectively, indicating excellent reliability.
Figure 1. The reference point.
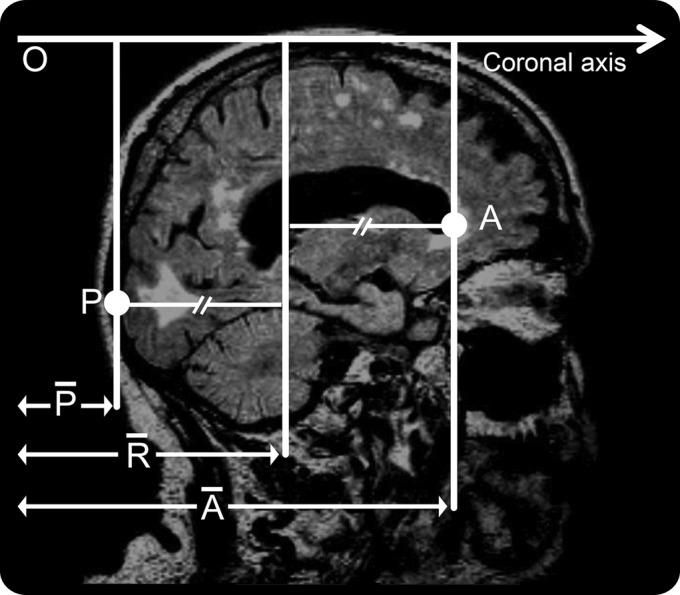
O = origin of the coronal axis; P = point P; A = point A;  = distance on the coronal axis from the origin to point P (pixels);
  = distance on the coronal axis from the origin to point A (pixels);
  = distance on the coronal axis from the origin to the reference point (pixels).
Statistical analysis.
Statistical analysis was performed using SPSS 20 statistical package (IBM Corp., Armonk, NY). Appropriate univariate analyses were performed to compare clinical and MRI characteristics between subjects. For 2-group comparisons, Fisher exact test and Student t test were applied to dichotomous variables and normally distributed continuous variables, respectively. For 3-group comparison, χ2 test and 1-way analysis of variance were applied to dichotomous variables and normally distributed continuous variables, respectively. Mann–Whitney U test was applied to nonnormally distributed continuous variables. A logistic regression model was used to determine whether pattern of AP distribution of WMH was an independent predictor of pathologic evidence of CAA. Multivariate linear regression models were performed to analyze the relationship of AP center of WMH to presence of CAA at pathology, and to the presence of strictly lobar MB, DPVS categories. Variables considered to be pathophysiologically relevant to AP distribution of WMH were also entered into all regression models. We also assessed the AP distribution of WMH across WM-DPVS severity degrees (1–4) (table e-1 on the Neurology® Web site at Neurology.org). Patients with missing data were excluded from the analyses. Statistical significance level was set at 0.05 for all analyses.
RESULTS
Comparison of characteristics between CAA and non-CAA individuals from the pathology cohort is shown in table 1. All patients in this cohort underwent the 1.5T MRI protocol. Comparisons of characteristics between memory clinic patients with and without strictly lobar MBs, and across DPVS categories, are shown in tables 2 and 3, respectively.
Table 1.
Comparison of characteristics between subjects with and without pathologically proven CAA

Table 2.
Comparison of clinical and MRI characteristics between patients with and without strictly lobar MBs

Table 3.
Comparison of characteristics among patients of each DPVS category

In the pathology cohort, more posterior distribution of WMH was found to be an independent predictor of CAA after controlling for age, sex, and WMH volume (p = 0.001, OR [95% CI] = 1.19 [1.07–1.32]). In the subgroup of patients without MBs (n = 37), 26 patients (70.3%) had CAA at pathology. Mean AP center of WMH of CAA and non-CAA patients was 7.10 (SD 2.01) and 17.98 (SD 5.69), respectively. After controlling for age, sex, and WMH volume, more posterior distribution of WMH was also found to be an independent predictor of CAA in this subgroup (p = 0.016, OR [95%CI] = 1.18 [1.03–1.36]).
In the memory clinic cohort, we found that more posterior distribution of WMH was independently associated with strictly lobar MBs (β [95% CI] = 4.63 [1.18–8.08]; table 2). AP distribution of WMH was also significantly different across DPVS categories (β [95% CI] = −5.61 [−8.94 to −2.28]; figure 2, table 3) in that patients with predominant DPVS in the white matter over the BG had a more posterior WMH distribution. Female sex was independently associated with more anterior WMH distribution in both pathology and memory clinic cohorts.
Figure 2. Box plots of the AP center of WMH by DPVS category.

AP center of WMH: higher values indicate a more anterior distribution; lower values indicate a more posterior distribution. AP = anteroposterior; BG = basal ganglia; DPVS = dilated perivascular spaces; WM = white matter; WMH = WM hyperintensities.
DISCUSSION
The main finding from this study is that posterior WMH distribution is an independent predictor of pathologically confirmed CAA in subjects without lobar ICH, even in the absence of lobar MB. This could be explained by the location of CAA vascular pathology, which is more abundant in posterior regions of the brain.22,23 To support this observation, we provided a second line of evidence by finding that memory clinic subjects with suspected CAA neuroimaging markers, such as strictly lobar MBs and WM-DPVS, had a significantly more posterior distribution of WMH compared to those patients without. Thus, our results indirectly suggest that strictly lobar MBs and WM-DPVS are reliable neuroimaging markers of CAA in individuals with cognitive impairment.
In the context of patients with cognitive impairment, lobar MBs may be highly specific for CAA, because their topographic distribution in Alzheimer disease (AD) has been shown to follow the posterior pattern seen in probable CAA cases.24 In addition, some degree of CAA frequently coexists with AD pathology.25 Given these data, patients with lobar MBs from the memory clinic likely carry CAA. Whether these patients represent a different CAA phenotype, with clinical expression being limited to the cognitive sphere, is unknown; currently, there are no longitudinal data on MBs in relation to ICH in patients with AD.
Our results regarding DPVS are in keeping with previous literature linking BG-DPVS with hypertension, and WM-DPVS with CAA.9–11 First, we observed a decreasing frequency of hypertension across DPVS categories, with the highest frequency occurring in patients with dominant BG-DPVS, and the lowest frequency occurring in patients with dominant WM-DPVS. Second, we found that the AP center of WMH becomes more posterior as the relative WM-DPVS burden increases.
This study demonstrates the differences in AP distribution of WMH in patients with and without CAA using a quantitative MRI technique, which may allow for less subjective measurement. Although our results are consistent with a previous study assessing AP distribution of WMH in patients with ICH by using a semiquantitative visual scale,14 a prior study using voxel-based techniques26 did not demonstrate significant differences in WMH distribution in patients with CAA compared to patients with AD and normal elderly subjects. However, it may be that this voxel-based analysis lacked sufficient power to detect small but consistent differences between subjects. The use of this quantitative method may help resolve these uncertainties in future studies of CAA.
Notably, AP distribution of WMH was found to be significantly different between sexes in both cohorts, whereby female patients tended to have a more anterior WMH distribution. This finding is consistent with a previous study demonstrating that frontal dominant WMH was more common in women.14 Evidence from population-based studies has shown that normal elderly women have higher WMH burden than their male counterparts.12,27,28 Because it appears that WM damage in normal elderly subjects tends to be frontal in predominance regardless of sex,12,29 this may explain why we found women to have a higher burden of frontal WMH. Alternatively, sex-based differences in WMH burden may be the result of premature death in men with high WMH burden.28 Thus, further well-designed pathophysiologic and population-based studies are required to more definitely address this issue.
Our study has limitations. It is possible that our calculation of the AP center of WMH was influenced by subject head position (flexion angle, rotation, and head tilt), thus biasing our results. However, we addressed this issue by examining the AP center of WMH in patients who underwent multiple MRI scans within the same year. We found that both WMH volume and distribution did not differ between scans. Second, an alternatively chosen reference point could give a less relative estimation of AP center of WMH. However, it is unlikely that these estimations would significantly change our results. It is possible that the slight variation of MRI protocols between subjects in our study may lead to bias in our results. To account for this potential bias, we thus controlled for MRI protocol in the multivariate analysis. In the pathologic cohort, several subjects appeared to have unusual distributions of WMH. Because this could potentially have accentuated the differences seen in AP distribution of WMH between CAA and non-CAA patients, we excluded these patients from our analyses. Although in the context of a memory clinic, lobar MBs seem to be highly indicative of CAA, there exist no specific pathologic studies assessing their diagnostic value for the disease. Therefore, we acknowledge that using lobar MBs as surrogate markers of CAA is a limitation of the study, and may pose some degree of uncertainty to our results. Finally, it should be emphasized that differences in WMH distribution may not be apparent on simple visual inspection. Given this, and the fact that technical expertise is required to quantitatively assess the AP distribution of WMH, clinical applicability of this technique may be limited.
Our study shows that posterior WMH distribution is an independent predictor of CAA even in the absence of strictly lobar MBs. This suggests that WMH distribution may be helpful in the diagnosis of CAA in individuals without hemorrhagic manifestations of the disease. The practical application of our findings would require, first, confirmation of our results in larger prospective studies, and second, a more simplified technique to determine AP distribution of WMH in a clinical setting. Finally, assessment of AP distribution of WMH may increase sensitivity of CAA diagnosis.
Supplementary Material
GLOSSARY
- AD
Alzheimer disease
- AP
anteroposterior
- BG
basal ganglia
- CAA
cerebral amyloid angiopathy
- CI
confidence interval
- DPVS
dilated perivascular spaces
- FLAIR
fluid-attenuated inversion recovery
- FOV
field of view
- ICH
intracerebral hemorrhage
- MB
microbleed
- MPRAGE
magnetization-prepared rapid-acquisition gradient echo
- OR
odds ratio
- TE
echo time
- TR
repetition time
- WM
white matter
- WMH
white matter hyperintensity
Footnotes
Supplemental data at Neurology.org
AUTHOR CONTRIBUTIONS
Study design: S.T., S.M.-R., A.V. Data acquisition: S.T., S.M.-R., J.N., A.A., A.R., K.S. Data analysis: S.T., S.M.-R., O.P.-N., A.V. Study management: S.T., S.M.-R., S.M.G., A.V. Manuscript preparation: S.T., S.M.-R., O.P.-N., A.V. Manuscript review: S.T., S.M.-R., O.P.-N., J.N., M.E.G., S.M.G., A.V.
STUDY FUNDING
Supported by NIH grants 5P50AG005134-30, 5K23AG028726-04, 5R01AG026484-09, and R01 NS070834-05.
DISCLOSURE
The authors report no disclosures relevant to the manuscript. Go to Neurology.org for full disclosures.
REFERENCES
- 1.Viswanathan A, Greenberg SM. Intracerebral hemorrhage. Handb Clin Neurol 2008;93:767–790 [DOI] [PubMed] [Google Scholar]
- 2.Vinters HV. Cerebral amyloid angiopathy: a critical review. Stroke 1987;18:311–324 [DOI] [PubMed] [Google Scholar]
- 3.Sveinbjornsdottir S, Sigurdsson S, Aspelund T, et al. Cerebral microbleeds in the population based AGES-Reykjavik Study: prevalence and location. J Neurol Neurosurg Psychiatry 2008;79:1002–1006 [DOI] [PMC free article] [PubMed] [Google Scholar]
- 4.Vernooij MW, van der Lugt A, Ikram MA, et al. Prevalence and risk factors of cerebral microbleeds: the Rotterdam Scan Study. Neurology 2008;70:1208–1214 [DOI] [PubMed] [Google Scholar]
- 5.Arvanitakis Z, Leurgans SE, Wang Z, Wilson RS, Bennett DA, Schneider JA. Cerebral amyloid angiopathy pathology and cognitive domains in older persons. Ann Neurol 2011;69:320–327 [DOI] [PMC free article] [PubMed] [Google Scholar]
- 6.Greenberg SM, Vonsattel JP, Stakes JW, Gruber M, Finklestein SP. The clinical spectrum of cerebral amyloid angiopathy: presentations without lobar hemorrhage. Neurology 1993;43:2073–2079 [DOI] [PubMed] [Google Scholar]
- 7.Knudsen KA, Rosand J, Karluk D, Greenberg SM. Clinical diagnosis of cerebral amyloid angiopathy: validation of the Boston criteria. Neurology 2001;56:537–539 [DOI] [PubMed] [Google Scholar]
- 8.Greenberg SM, O'Donnell HC, Schaefer PW, Kraft E. MRI detection of new hemorrhages: potential marker of progression in cerebral amyloid angiopathy. Neurology 1999;53:1135–1138 [DOI] [PubMed] [Google Scholar]
- 9.Charidimou A, Meegahage R, Fox Z, et al. Enlarged perivascular spaces as a marker of underlying arteriopathy in intracerebral haemorrhage: a multicentre MRI cohort study. J Neurol Neurosurg Psychiatry 2013;84:624–629 [DOI] [PMC free article] [PubMed] [Google Scholar]
- 10.Martinez-Ramirez S, Pontes-Neto OM, Dumas AP, et al. Topography of dilated perivascular spaces in subjects from a memory clinic cohort. Neurology 2013;80:1551–1556 [DOI] [PMC free article] [PubMed] [Google Scholar]
- 11.Roher AE, Kuo YM, Esh C, et al. Cortical and leptomeningeal cerebrovascular amyloid and white matter pathology in Alzheimer's disease. Mol Med 2003;9:112–122 [PMC free article] [PubMed] [Google Scholar]
- 12.de Leeuw FE, de Groot JC, Achten E, et al. Prevalence of cerebral white matter lesions in elderly people: a population based magnetic resonance imaging study. The Rotterdam Scan Study. J Neurol Neurosurg Psychiatry 2001;70:9–14 [DOI] [PMC free article] [PubMed] [Google Scholar]
- 13.Smith EE, Gurol ME, Eng JA, et al. White matter lesions, cognition, and recurrent hemorrhage in lobar intracerebral hemorrhage. Neurology 2004;63:1606–1612 [DOI] [PubMed] [Google Scholar]
- 14.Zhu YC, Chabriat H, Godin O, et al. Distribution of white matter hyperintensity in cerebral hemorrhage and healthy aging. J Neurol 2012;259:530–536 [DOI] [PMC free article] [PubMed] [Google Scholar]
- 15.Smith EE, Nandigam KR, Chen YW, et al. MRI markers of small vessel disease in lobar and deep hemispheric intracerebral hemorrhage. Stroke 2010;41:1933–1938 [DOI] [PMC free article] [PubMed] [Google Scholar]
- 16.Greenberg SM, Vonsattel JP. Diagnosis of cerebral amyloid angiopathy: sensitivity and specificity of cortical biopsy. Stroke 1997;28:1418–1422 [DOI] [PubMed] [Google Scholar]
- 17.Morris JC, Weintraub S, Chui HC, et al. The Uniform Data Set (UDS): clinical and cognitive variables and descriptive data from Alzheimer Disease Centers. Alzheimer Dis Assoc Disord 2006;20:210–216 [DOI] [PubMed] [Google Scholar]
- 18.Greenberg SM, Vernooij MW, Cordonnier C, et al. ; Microbleed Study Group. Cerebral microbleeds: a guide to detection and interpretation. Lancet Neurol 2009;8:165–174 [DOI] [PMC free article] [PubMed] [Google Scholar]
- 19.Bokura H, Kobayashi S, Yamaguchi S. Distinguishing silent lacunar infarction from enlarged Virchow-Robin spaces: a magnetic resonance imaging and pathological study. J Neurol 1998;245:116–122 [DOI] [PubMed] [Google Scholar]
- 20.Zhu YC, Tzourio C, Soumaré A, Mazoyer B, Dufouil C, Chabriat H. Severity of dilated Virchow-Robin spaces is associated with age, blood pressure, and MRI markers of small vessel disease: a population-based study. Stroke 2010;41:2483–2490 [DOI] [PubMed] [Google Scholar]
- 21.Gurol ME, Irizarry MC, Smith EE, et al. Plasma beta-amyloid and white matter lesions in AD, MCI, and cerebral amyloid angiopathy. Neurology 2006;66:23–29 [DOI] [PubMed] [Google Scholar]
- 22.Vinters HV, Gilbert JJ. Cerebral amyloid angiopathy: incidence and complications in the aging brain. II. The distribution of amyloid vascular changes. Stroke 1983;14:924–928 [DOI] [PubMed] [Google Scholar]
- 23.Rosand J, Muzikansky A, Kumar A, et al. Spatial clustering of hemorrhages in probable cerebral amyloid angiopathy. Ann Neurol 2005;58:459–462 [DOI] [PubMed] [Google Scholar]
- 24.Pettersen JA, Sathiyamoorthy G, Gao FQ, et al. Microbleed topography, leukoaraiosis, and cognition in probable Alzheimer disease from the Sunnybrook Dementia Study. Arch Neurol 2008;65:790–795 [DOI] [PubMed] [Google Scholar]
- 25.Jellinger KA. Alzheimer disease and cerebrovascular pathology: an update. J Neural Transm 2002;109:813–836 [DOI] [PubMed] [Google Scholar]
- 26.Holland CM, Smith EE, Csapo I, et al. Spatial distribution of white-matter hyperintensities in Alzheimer disease, cerebral amyloid angiopathy, and healthy aging. Stroke 2008;39:1127–1133 [DOI] [PMC free article] [PubMed] [Google Scholar]
- 27.Longstreth WT, Jr, Manolio TA, Arnold A, et al. Clinical correlates of white matter findings on cranial magnetic resonance imaging of 3301 elderly people. The Cardiovascular Health Study. Stroke 1996;27:1274–1282 [DOI] [PubMed] [Google Scholar]
- 28.Simoni M, Li L, Paul NL, et al. Age- and sex-specific rates of leukoaraiosis in TIA and stroke patients: population-based study. Neurology 2012;79:1215–1222 [DOI] [PMC free article] [PubMed] [Google Scholar]
- 29.Pfefferbaum A, Adalsteinsson E, Sullivan EV. Frontal circuitry degradation marks healthy adult aging: evidence from diffusion tensor imaging. Neuroimage 2005;26:891–899 [DOI] [PubMed] [Google Scholar]
Associated Data
This section collects any data citations, data availability statements, or supplementary materials included in this article.