Abstract
The cell microenvironment is a complex and anisotropic matrix composed of a number of physical and biochemical cues that control cellular processes. A current challenge in biomaterials is the engineering of biomimetic materials which present spatially controlled physical and biochemical cues. The layer-by-layer assembly of polyelectrolyte multilayers (PEM) has been demonstrated to be a promising candidate for a biomaterial mimicking the native extracellular matrix. In this work, gradients of biochemical and physical cues were generated on PEM films composed of hyaluronan (HA) and poly(l-lysine) (PLL) using a microfluidic device. As a proof of concept, four different types of surface concentration gradients adsorbed onto the films were generated. These included surface concentration gradients of fluorescent PLL, fluorescent microbeads, a cross-linker, and one consisting of a polyelectrolyte grafted with a cell adhesive peptide. In all cases, reproducible centimeter-long linear gradients were obtained. Fluorescence microscopy, Fourier transform infrared spectroscopy and atomic force microscopy were used to characterize these gradients. Cell responses to the stiffness gradient and to the peptide gradient were studied. Pre-osteoblastic cells were found to adhere and spread more along the stiffness gradient, which varied linearly from 200 kPa–600 kPa. Myoblast cell spreading also increased throughout the length of the increasing RGD-peptide gradient. This work demonstrates a simple method to modify PEM films with concentration gradients of non-covalently bound biomolecules and with gradients in stiffness. These results highlight the potential of this technique to efficiently and quickly determine the optimal biochemical and mechanical cues necessary for specific cellular processes.
Introduction
The native extracellular matrix (ECM) is a highly anisotropic environment that provides cells with a number of biochemical and physical cues, which control their processes and ultimately dictate their fate.1,2 Gradients in biochemical (peptides, growth factors, cytokines, etc.) and physical signals (matrix porosity, stiffness, topology, etc.) are often implicated in cellular processes such as adhesion, proliferation, migration, and differentiation.3–5 A current challenge for biomaterial engineers is to recreate the complex anisotropic environment of the native ECM.6 A number of techniques are available for the generation of soluble7,8 as well as insoluble biochemical surface gradients.4,5,9–11 In the category of insoluble gradients, the biomolecules can either be covalently immobilized12 or adsorbed by physico-chemical interactions.13 Covalent immobilization is interesting in that the molecule is presented in a controlled manner but this often requires development of complex coupling strategies and the bioactivity of the biomolecules may be altered. An ideal ECM-mimetic material would present gradients of biomolecules that are immobilized by natural interactions to the surrounding matrix, i.e. “matrix-bound”.1 Methods for generating matrix-bound gradients are still limited. Campbell and co-workers used inkjet printing to prepare gradients of matrix-bound growth factors on fibrin gels.13–15
A promising approach towards creating ECM-mimetic surfaces16 or cell microenvironments17 is the layer-by-layer (LbL)18,19 assembly of polyelectrolyte multilayer (PEM) films. This simple technique, which is based on the interactions between two oppositely charged polyelectrolytes, allows for the construction of films with tunable thickness, chemical, and physical properties on any charged substrate for a wide range of applications.16,20–22
In view of their simplicity and versatility, these films have applications as biosensors,23 biomedical materials16,24 or drug delivery systems.22 PEM films can be applied not only to flat surfaces but also to complex 3-D environments. Moreover, PEM films can be used as reservoirs of biomolecules or used to present ECM proteins to cells in a matrix-bound fashion.25–27 PEM films constructed using the polyaminoacid poly(l-lysine) (PLL) and the polysaccharide hyaluronan (HA) have been demonstrated to have great potential as an ECM-mimetic material, providing cells with an environment of adjustable biochemical and mechanical cues.26,28–30 So far, these films have been constructed and characterized with homogenous properties. The next step in generating an ECM-mimetic environment using PEM is to generate films containing gradients in properties.
To date, there are only a few examples of PEM presenting gradients in their physico-chemical properties. Barrett and coworkers recently demonstrated PEM films with two-dimensional gradients in their physical properties and thickness using synthetic polyelectrolytes.31 This was obtained by rotating the substrate on which the films are deposited and by changing the dipping depth. Gao et al. created a salt gradient and incubated the PEM films vertically in this gradient.32 They observed a directed cell migration on PEM films with gradient in swelling.32 Recently, Groth and coworkers used a microfluidic gradient mixer to generate PEM films with a gradient in pH.33 They showed that cells migrated to the region of the film constructed using high pH. By combining gradient generating techniques, such as microfluidics, with PEM films one can develop biomimetic environments that closely resemble that of the cell’s natural environment.
Many microfluidics devices are available for generating gradients,34 however most need to be permanently attached to the substrate of interest, thus limiting their applications. The microfluidic design may also be complex, which precludes their use by non-specialized experimentalists. A simple and versatile method of generating long-range gradients using a microfluidic device has been recently developed.35,36 This technique uses a long straight microfluidic channel to generate gradients via passive-pump-induced forward flow and evaporation-induced backward flow.37 Centimeter long gradients with different profiles can thus be generated by adjusting different parameters.37 The main advantages of this technique are its versatility and simplicity. In addition, it can be translated to a variety of surfaces, making it an attractive method to create spatial biochemical and physical cues on biomimetic surfaces for the study of cell/material interactions. For example, gradients of the arginine–glycine–aspartic-acid–serine (RGD) cell adhesion peptide were generated on poly(ethylene glycol)-diacrylate hydrogels that also contained a gradient in porosity.35
In this work, we show that the combination of PEM films with this simple microfluidic device allows the generation of a large variety of gradients of different molecules and objects. As a proof-of-concept, four different types of surface gradients were prepared on PEM films made of (PLL/HA): fluorescent microbeads as a large object, fluorescent PLL as a model biomacromolecule, RGD conjugated to poly(glutamic acid) (PGA-RGD) as a cell adhesive biomolecule, and a carbodiimide as cross-linking agent to create a gradient of stiffness. Atomic force microscopy, fluorescence microscopy, and Fourier transform infrared spectroscopy were used to characterize the different gradients. In addition, myoblast and pre-osteoblast cell response to the gradient in RGD and in film stiffness were studied respectively.
To our knowledge, this work is the first to demonstrate centimeter long gradients of non-covalently bound biomacromolecules and of stiffness on PEM films. It adds to the very few techniques available for the generation of non-covalently bound surface gradients of biomacromolecules in biomimetic systems. Long-range surface gradients are useful for investigating cell-material interactions because they can screen a large range of conditions (biochemical or physical cues), use a larger amount of cells (increasing accuracy), and reduce the need to consume large quantities of expensive or sensitive material such as growth factors in a single experiment.3 The versatility of PEMs allows this gradient generation technology to be applied in biosensors, drug screening applications, amongst others.
Experimental
Materials
Hyaluronan (HA, 3.5 × 10⁵ g mol−1) was purchased from Lifecore Biomedical LLC (USA). Poly(ethylenimine) (PEI), poly(l-glutamic acid), poly(l-lysine) (PLL, 5.6 × 10⁴ g mol−1), fluorescein-labeled PLL (PLL-FITC), 1-ethyl-3-(3-dimethylaminopropyl) carbodiimide (EDC), N-hydrosuccinimide (sulfo-NHS), and phalloidin-tetramethylrhodamine B isothiocyanate were purchased from Sigma (France). Rhodamine-labeled polystyrene microbead solution (1% solids, 0.4 μm in diameter) was purchased from Duke Scientific (USA). PGA-RGD was synthesized as described previously using the 15-amino-acid peptide containing a central RGD (Arg-Gly-Asp) sequence (Cys-Gly-Pro-Lys-Gly-Asp-Arg-Gly-Asp-Ala-Gly-Pro-Lys-Gly-Ala, CGPKGDRGDAGPKGA) purchased from GeneCust (Dudelange, Luxembourg).38 A grafting ratio of 10% was obtained as determined by 1H NMR. All other salts, buffers, and solvents were purchased from Sigma and used as received. Fetal bovine serum (FBS) was purchased from PAA Laboratories (Les Mureaux, France). All other cell culture reagents were purchased from Gibco (Invitrogen, Cergy-Pontoise, France). Ultrapure water (Milli-Q-plus system, Millipore (Molsheim, France) (resistivity of 18.2 MΩ) was used for all aqueous solutions.
PEM film buildup and characterization
PEI (2.5 mg mL−1), HA (1 mg mL−1), and PLL (0.5 mg mL−1) were dissolved in a filtered HEPES-NaCl buffer solution (20 mM HEPES pH 7.4, 0.15 M NaCl). Substrates for PEM deposition were cleaned in a 0.5% Hellmanex (Hellma, Müllheim, Germany) solution and modified with an anchoring PEI layer. PEM films were prepared using an automated dipping machine (Dipping Robot DR3, Kierstein GmbH, Germany) as previously described39 on a silicon wafer (25 mm × 60 mm × 1 mm) for FTIR spectroscopy or on glass slides (25 mm × 60 mm × 0.2 mm, Menzel-Gläser, Germany) for all other experiments. Prior to gradient formation, films were pre-cross-linked overnight with EDC at either 5 mg mL−1 or 10 mg mL−1, and sulfo-NHS at 11 mg mL−1, both dissolved in NaCl (0.15 M, pH 5.5) followed by extensive rinsing with HEPES-NaCl buffer solution. PEM films are named hereafter as (PLL-HA)i where i corresponds to the number of layer pairs. PEM films deposited on glass slides were characterized in a dry state using atomic force microscopy and confocal-laser scanning microscopy.40 Dry PEM films deposited on silicon were characterized by FTIR spectroscopy in transmission mode using a Vertex 70 spectrophotometer (Bruker Optic Gmbh, Ettlingen, Germany) equipped with a liquid nitrogen-cooled MCT detector.40
Microfluidic device
The microfluidic device was constructed using standard soft-lithography methods from a silicon master wafer. It consisted of a PDMS (Sylgard 184, Dow Corning) mold with multiple straight channels (50 mm × 2.0 mm × 100 μm).37 The inlet and outlet of the microchannels were created with a sharp 20-gauge punch. The availability of multiple channels allowed for multiple independent experiments to be performed simultaneously on a single glass slide.
Generation of surface gradients on PEM films
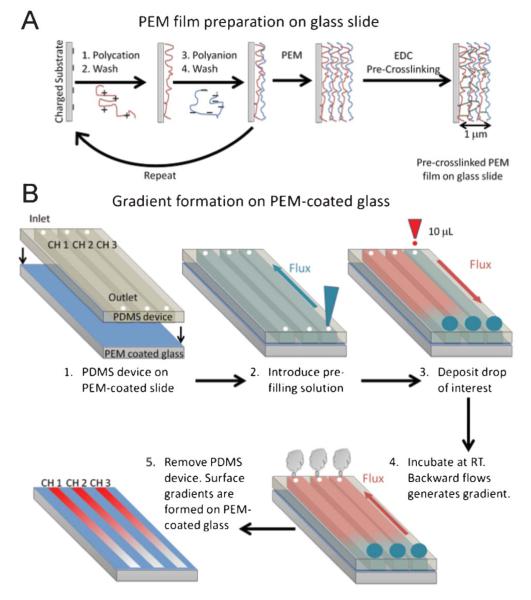
A PEM-coated substrate was first rinsed in water before being dried with a gentle stream of air and placed in contact with the microfluidic device. Gradients of PLL-FITC (0.13 mg mL−1), rhodamine-labeled microbeads (μbeads, used as delivered), EDC (200 mg mL−1 and sulfo-NHS at 11 mg mL−1) and of PGARGD (1 mg mL−1) were generated. PGA-RGD gradients were generated on PLL-ending films, while all other gradients were generated on HA-ending films. Their pre-filling solutions were: HEPES/NaCl for PLL-FITC and PGA-RGD, DI water for μbeads, and 0.15 M NaCl (pH 5.5) for EDC. Pre-filling solution was first introduced in the microchannels. A large drop (200 μL) of pre-filling solution was placed in the outlet and a small drop (10 μL) of the molecule of interest was placed in the inlet. The difference in surface tension between the two drops generated a flow from inlet to outlet (Fig. 1). The sample was incubated for 40 min at room-temperature. During this incubation period, backward flow due to evaporation from the inlet occurred generating the gradient of the molecule of interest. For EDC gradients, after the 40 min of gradient formation the inlet and outlet were sealed with PDMS pieces and the sample was incubated for an additional 3 h at room temperature. The channels were rinsed from outlet to inlet using the pre-filling solution, the PDMS device was removed, and the substrate was rinsed with DI water, dried with air, and stored until use.
Fig. 1.
(A) Schematic representation of PEM film construction on a glass slide and (B) formation of surface gradient of biomolecules on PEM films. 1) A PEM-coated glass slide was placed in contact with a PDMS microfluidic device containing straight and parallel microchannels. 2) A pre-filling solution was introduced in the microchannels. 3) A large drop (200 μL) of pre-filling solution was placed in the outlet, while a small drop (10 μL) of a biomolecule of interest was placed in the inlet of each microchannel. Forward flow, from inlet to outlet, occurred due to passive-pumping. 4) The sample was incubated at room temperature. The gradient was generated via backward flow (outlet to inlet) due to evaporation. 5) The PDMS microfluidic device was removed resulting in a PEM film with a gradient of the biomolecule of interest.
Characterization of the surface gradients
PLL-FITC and μbeads gradients were visualized using a Zeiss LSM 700 microscope. Images were obtained every 1.28 mm throughout the length of the sample (50 mm) using an automated stage at 10 × magnification. Quantification of the fluorescence profiles were performed using ImageJ 1.46c (NIH, USA). To calculate the surface concentration of PLL-FITC along the gradient, a PLL-FITC calibration curve was generated by measuring the fluorescence intensity of PLL-FITC at different concentrations in solution. The number of μbeads per channel was quantified using the particle analyzer plug-in from ImageJ.
EDC gradients were characterized by FTIR spectroscopy and by AFM. For FTIR, the gradients were generated on PEM-coated silicon wafers. The dry films were placed in the transmission chamber of the FTIR and spectra were collected at different positions along the gradient. An uncoated silicon wafer was used for blank subtraction. A number of Gaussian peaks (7–8 peaks, determined by the second derivative of the spectrum) were fitted in the region between 1800 cm−1–1450 cm−1 to obtain the percentage decrease of the COO− band.
AFM imaging and nano-indentation experiments were performed at room temperature in HEPES/NaCl using a BioCatalyst (Bruker AXS SAS, Palaiseau, France). Force-indentation profiles were recorded as previously described41 using borosilicate sphere tipped cantilevers of radius R = 2.5 μm (Novascan Technologies, USA) having a spring constant of 0.12 N m−1. The Young’s modulus E was extracted from the above profiles using the finite thickness corrected Hertz sphere model42 and assuming PEM films to be incompressible (Poisson’s ratio fixed at 0.5). Nine measurements were taken per millimeter along two different microchannels of a pre-crosslinked (PLL-HA)12 film containing a gradient of EDC cross-linker.
The cellular response to EDC gradients was studied using MC3T3-E1 pre-osteoblastic cells. Cellular response to PGA-RGD gradients was performed using C2C12 cells (from ATCC, <20 passages). All samples for cell culture were sterilized under UV light for 15 min and placed in wells of a Nuclon Δ-treated 4-well plate (Nunc ALS, Roskilde, Denmark). MC3T3-E1 pre-osteoblastic cells were seeded on glass slides with EDC gradients at 13 600 cells cm−2. MC3T3-E1 cells were maintained in minimum essential medium alpha (αMEM) supplemented with 10% FBS, and 10 U mL−1 penicillin G and 10 mg mL−1 streptomycin for 24 h. C2C12 cells were cultured in a 1 : 1 Dulbecco’s modified Eagle’s medium (DMEM)/Ham’s F12 medium supplemented with 10% FBS, containing 10 U mL−1 penicillin G and 10 mg mL−1 streptomycin. C2C12 cells were seeded on glass slides with PGA-RGD gradients at 10 600 cells cm−2 using serum-free media, and cells were allowed to adhere for 3 h. Afterwards, cells were fixed in 3.7% formaldehyde in phosphate buffered saline for 20 min and permeabilized for 4 min in Tris buffered saline (50 mM Tris-HCl, pH 7.4, 0.15 M Nacl) containing 0.2% Triton X-100. Actin filaments were stained with rhodamine-phalloidin. The slides were mounted onto coverslips with antifade reagent (Prolong, Molecular Probes, Saint Aubin, France) and imaged, as mentioned above, using a Zeiss LSM 700 microscope. Cell area and number were obtained using ImageJ.
Results and discussion
Characterization of dry PEM film
The LbL construction of PEM films is a simple yet powerful technique for coating a large variety of substrates. Fig. 1 shows schematic representations of the LbL assembly of PEM films (Fig. 1a) and of the generation of surface gradients on PEM films (Fig. 1b). To generate the multilayer films, a charged substrate was exposed to a polycation for a period of time; it was removed and rinsed prior to exposure of a polyanion. This process was repeated until the desired number of layers was obtained. In this work, PEM films made of the polyaminoacid PLL as polycation and of the polysaccharide HA as polyanion were used as model system.43 After film construction, the films were pre-crosslinked using a low concentration of the carbodiimmide cross-linking reagent.44 A slight pre-crosslinking of the film was needed to allow them to sustain the stresses occurring upon transfer from the buffered solution (HEPES/NaCl) to pure water, and drying. Then the PDMS microfluidic device (50 mm × 2.0 mm × 100 μm)37 used to generate the gradients was placed in contact with the dry PEM film-coated glass. Drying of the films was necessary in order to have a proper seal between the PDMS and the sample. Gradients were generated as displayed in Fig. 1b. The pre-filling solution was introduced in the channels and a 200 μL drop was left at the outlet. A 10 μL drop of the molecule of interest was placed in the inlet, which entered automatically and flowed from inlet to outlet due to the surface tension difference between the drop in the outlet and the inlet drop.37,45 Optimization experiments were performed in order to select the appropriate volume for the inlet drop. 10 μL was selected because it gave the appropriate gradient length of approximately 1 cm (data not shown). Backward flux then occurred, due to evaporation, generating the gradient. The formation of gradients from evaporation has been previously shown to be time dependent.35 The time required for the formation of the gradient from evaporation was 40 min. The films were then rinsed and dried.
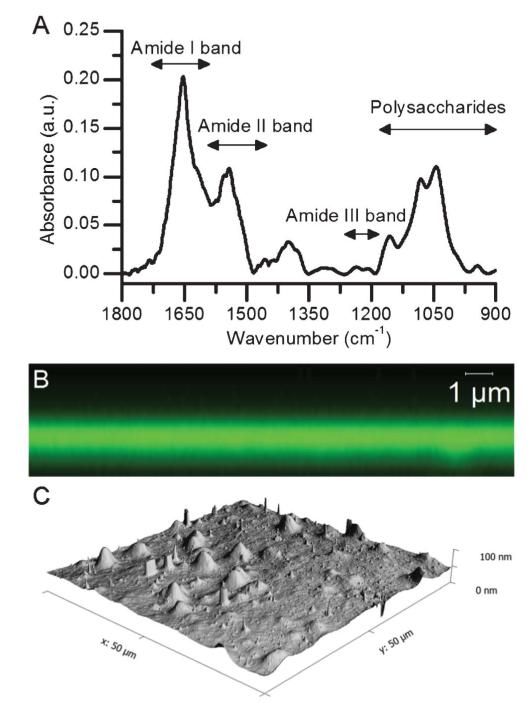
To investigate whether the dry PEM films were amenable to the generation of surface gradients on large substrates, we first characterized the effective stability and homogeneity of the dry (PLL/HA)i films (Fig. 2). FTIR spectroscopy shows that (PLL/HA)24 films exhibit the expected IR bands between 1800 cm−1–900 cm−1 (Fig. 2a). Contributions from PLL include the amide I (1650 cm−1), amide II (1550 cm−1), and amide III (1230 cm−1) bands. The expected polysaccharide band between 1100 cm−1–900 cm−1 for HA is also observed.
Fig. 2.
Characterization of PEM films constructed on glass and silicon substrates. (A) FTIR spectroscopy of a dried (PLL-HA)24 constructed on silicon. 24 pairs of layers were used in order to improve the IR signal. Characteristic peaks for PLL and HA are noted, including the amide I, II, and III as well as the polysaccharide ring region. (B) Confocal laser microscopy z-scan of a dried (PLL-HA)12 -PLL-FITC film deposited on glass. Film thickness is ~1 μm. (C) Atomic force microscopy images (50 μm × 50 μm) of a dried (PLL-HA)24 film on glass. The average roughness (Ra) is 5 nm.
The visualization of (PLL/HA) film thickness by CLSM was done using PLL-FITC by using the known diffusion of PLL in (PLL/HA) films.43 Performing a z-line scan on the sample using a 63× objective revealed that the film thickness was 1 μm, which was confirmed by AFM imaging of a scratched film (data not shown). This is in agreement with previously reported thicknesses for such films (Fig. 2b).46
AFM imaging (Fig. 2c) demonstrated that the coating was homogeneous (scan area 50 μm × 50 μm) with mean roughness values of 5 nm. The average roughness obtained matches well to those previously obtained for this type of film.39 These results demonstrate that (PLL/HA) films can successfully be constructed on large substrates in a homogenous fashion and that they retain their integrity after pre-crosslinking, rinsing and drying.
Gradients of μbeads on PEM films
As an initial proof-of-concept, gradients of fluorescently labeled polystyrene μbeads (400 nm in diameter, solution of 1% solids in water) were generated as nano-objects of well-defined size. Gradients of nano- and micro-particles are useful in controlling surface morphology to modulate cell behavior.47 Gradients of immobilized nanoparticles containing the adhesive-peptide RGD have been used to elucidate the effect of ligand spatial arrangement and density on cell signaling, polarization, and migration.48 Moreover, micro- and nano-particles are heavily implicated in drug delivery. With this technology one could investigate the interplay between ECM molecules, micro- & nano-particles, and cells. These μbeads could serve also as models of mammalian or bacterial cells, demonstrating that a gradient of cell number could be generated via this simple technique.
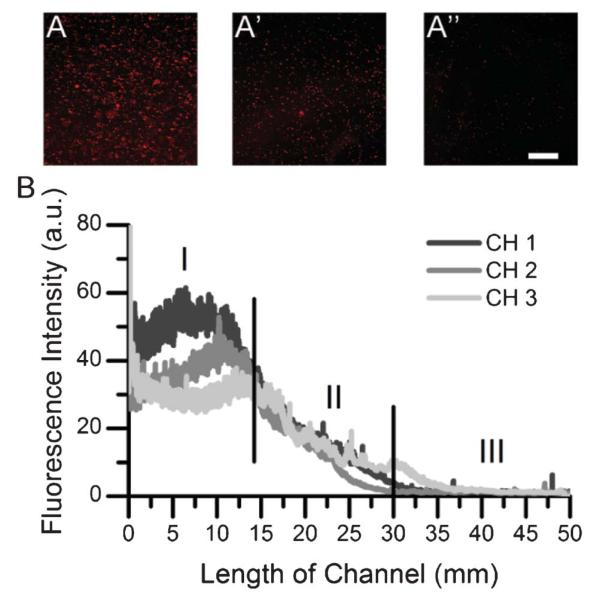
Fig. 3a shows representative images of μbeads at different distances away from the inlet of the channel. The beads remained adsorbed on the film after the rinsing and drying steps. Their fluorescence enabled an easy quantification of the number of adsorbed beads. At first glance, it appeared that the density of μbeads decreased along the length of the channel, confirming that a gradient in concentrations of microbeads had been generated. This was confirmed by quantifying the density of μbeads, which decreased from 775 beads cm−2 to 59 beads cm−2 over the length of the gradient. Fig. 3b shows the profile curves for 3 gradients of μbeads generated using different channels on the same slide. The profile curves for the gradients of μbeads exhibited 3 distinct zones: a high-concentration plateau (I) region (0 mm–10 mm), a decreasing gradient (II) region (10 mm–30 mm), and a low-concentration plateau (III) region (30 mm–50 mm). The μbeads gradients generated were similar between the three different channels. This technique demonstrates how immobilized surface gradients of larger objects can be generated in PEM films.
Fig. 3.
Gradient of μbeads generated throughout the length of a (PLL-HA)12 multilayer film. Representative images (corresponding to CH 2) at different locations (A) 7.5 mm, (A′) 21.3 mm, (Aʺ) 23.8 mm. Scale bar: 250 μm. Images were obtained at different positions after removing the microfluidic device, rinsing, and drying the film: (B) μbeads density profiles of three different microchannels (CH 1, 2 and 3) of the same microfluidic device. Three distinct regions are marked on the profile curves: (I) high-concentration plateau, (II) gradient region, (III) and low-concentration plateau.
Gradients of biomolecules on PEM films
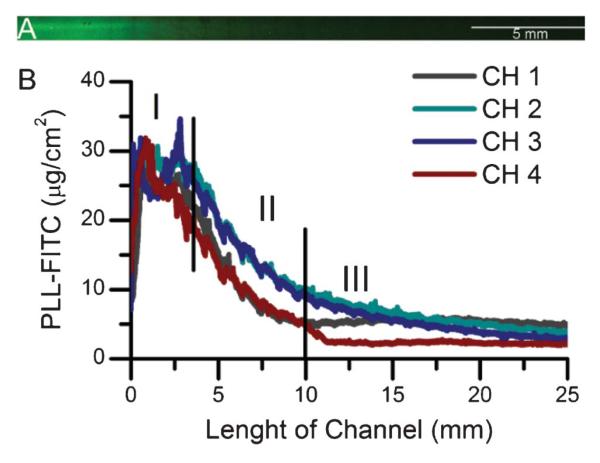
Gradients of PLL-FITC on PEM were then performed. PLL-FITC was chosen as a model biomolecule for ECM components such as polyaminoacids, proteins, and cytokines (e.g. growth factors) that are in the same order of magnitude in size. We have previously observed that PLL-FITC diffuses entirely throughout the thickness of (PLL/HA) films.43 PLL-FITC surface gradients were visualized using fluorescence microscopy after rinsing and drying the sample. Fig. 4a shows a microscopy image of PLL-FITC on (PLL/HA) films after generation of a gradient along the microchannel. Higher fluorescence intensity was observed near the inlet (left side of image) and it decreased along the length of the channel towards the outlet (right part). In order to investigate the reproducibility of the process, PLL-FITC gradients were generated on 4 different channels of the same device. The quantification of these gradients is shown in Fig. 4b. The profile curves for the different channels of PLL-FITC exhibit three distinct regions: a high-concentration plateau over the first 2.5 mm (I), a linear decreasing concentration gradient between 2.5 mm–12.5 mm (II), and a low-concentration plateau after 12.5 mm (III). These profiles correlated well with previous reports using a PDMS microfluidic device with the same dimensions to generate gradients of dextran-FITC in solution.49 The length for these zones was shorter than that of μbeads. These differences may be because of the different size of the objects of interest (~10 nm50 for PLL-FITC as compared to 400 nm in diameter for μbeads). Surface concentrations in Fig. 4b were calculated by generating a calibration curve using PLL-FITC in solution. The surface concentration near the inlet of the channel was ~ 30 μg cm−2 and it decreased linearly until it reached a lower plateau at ~ 5 μg cm−2. The mean calculated slope for the linear region (II) of the PLL-FITC gradient generated in the different channels of Fig. 3 was −2.65 ± 0.29 μg mm−1 cm−2. Notably, the small deviation of the slope (~11%) demonstrates the reproducibility of the generation of matrix bound gradients on PEM films using the microfluidic channel.
Fig. 4.
(A) Fluorescence image of a PLL-FITC surface gradient along one microchannel (scale bar: 5 mm). Image obtained after removing the microfluidic device, rinsing, and drying the film. The image corresponds to CH 3 in Fig. 3b. (B) Surface concentration gradient profiles of PLL-FITC on a (PLL-HA)12 film generated on four different channels of the same microfluidic device. Three distinct regions of the profile curves, high-concentration plateau (I), gradient region (II), and low-concentration plateau (III) are marked.
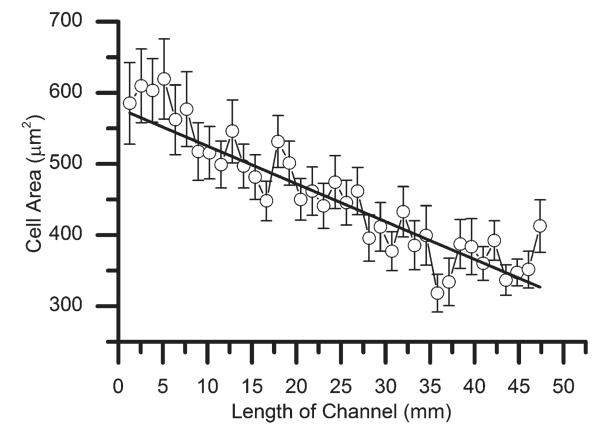
As a final proof-of concept for a biochemical gradient, a gradient of the adhesive-peptide RGD was performed on a (PLL-HA)12-PLL film pre-crosslinked with an EDC concentration that has previously demonstrated poor cell adhesion.26 PGA was modified with RGD as previously described38 and the PGA-RGD gradients were performed on a PLL-ending film as PGA is a polyanion. C2C12 cells were seeded on the RGD gradient and allowed to adhere for 3 h in serum-free media. Fig. 5 shows the average cell area at different points along the length of the gradient. As expected, C2C12 cell area decreases in a linear fashion with decreasing concentration of PGA-RGD (slope −5.24 μm2 mm−1). This demonstrates how this technique can also be applied to generate gradients of biochemical cues on PEM films to control cellular fate.
Fig. 5.
Average C2C12 cell area along the length of a channel on a (PLL-HA)12-PLL film containing a PGA-RGD gradient. Error bars indicate the standard error between three different microchannels. A linear fit is also shown (R2 0.83).
PEM films with gradient in stiffness
To generate a gradient of stiffness in the (PLL/HA) film along the length of the microfluidic channel the water soluble carbodiimide EDC reagent was used. EDC has already been used to create covalent amide bonds between ammonium groups (NH3+, found in PLL) and carboxylate groups (COO−, found in HA).44 Furthermore, variation in the concentration of the cross-linker is known to be related to a variation in film stiffness.39 The EDC gradient was first generated during the 40 min-long incubation period. Then the inlet and outlet were sealed with PDMS pieces in order to stop evaporation. The sample was incubated at room temperature for 3 h prior rinsing to allow time for the cross-linking reaction to reach completion.
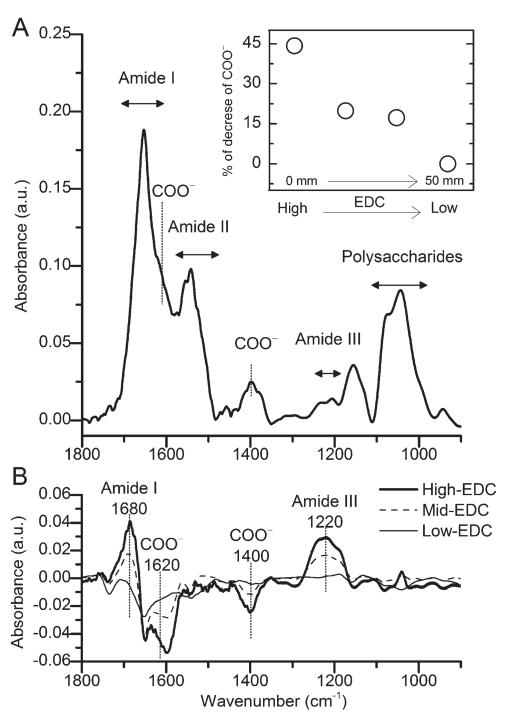
Using FTIR, it is possible to observe the consumption of COO− ions as well as the formation of new amide bonds,39 both being characteristic of the cross-linking extent. Thus, the extent of cross-linking was quantified at different positions along the length of the gradient (Fig. 6). A spectrum of the PEM film at the end of the channel (i.e. low EDC concentration) is shown in Fig. 6a.
Fig. 6.
FTIR transmission spectra of the cross-linking gradient generated on a (PLL-HA)24 film. (A) FTIR spectrum at the outlet of the PDMS microfluidic device, i.e. where the EDC concentration is low. (B) Spectra obtained at different positions along the gradient minus the spectrum obtained near the outlet of the channel (displayed in Fig. 6a). The inset of (A) shows the percent decrease of the carboxylate ion (COO−) band near 1620 cm−1 for different positions along the length of the microchannel (from high to low EDC concentration, i.e. inlet to outlet).
The characteristic peaks for (PLL/HA) films observed includes the amide I, II, and II (1655 cm−1, 1545 cm−1, and 1236 cm−1 respectively) along with the polysaccharide rings band near 1000 cm−1. This spectrum first indicates that the formation of a gradient does not affect film integrity. Three other spectra were taken at different positions along the gradient with increasing stiffness, i.e. with increasing EDC content. The difference between each spectrum and the spectrum obtained at the end (Fig. 6a) are plotted in Fig. 6b. A decrease in the COO− peaks at 1400 cm−1 and at 1620 cm−1 was observed while both the amide I and III peaks at 1680 cm−1 and 1220 cm−1 showed an increase. We have previously shown that increasing EDC concentration resulted in a decrease of COO− and an increase of amide bands in (PLL/HA) films.29,39 The percentage decrease of the COO− band was quantified and is plotted in the inset of Fig. 6a. This percentage decreased with decreasing EDC concentration. Thus, FTIR spectroscopy confirmed that cross-linking followed the gradient of the cross-linker.
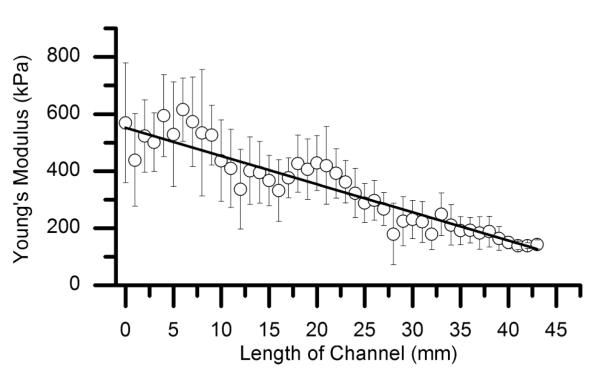
AFM nano-indentation experiments were used to confirm the generation of a stiffness gradient (Fig. 7). The Young’s modulus decreased along the length of the channel (50 mm) within a range of 600 kPa–200 kPa and a slope of −9.90 kPa mm−1.
Fig. 7.
Young’s modulus of PEM films with EDC gradient obtained by AFM-nano indentations. Force-indentation profiles were collected every millimeter along the length of the channels. Error bars represent the standard deviation of nine measurements performed at every point in two different channels. A slope of −9.90 kPa mm−1 was obtained from a linear fit (R2 0.94).
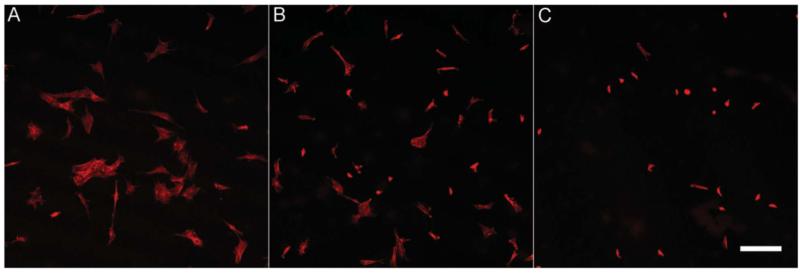
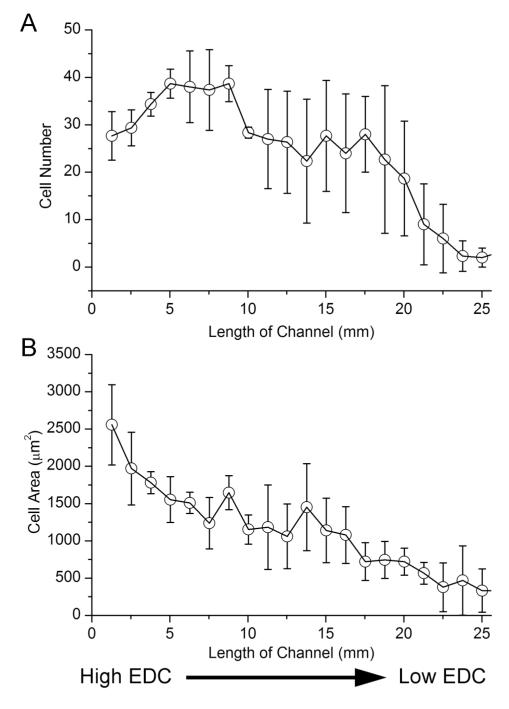
The response of cells to the stiffness gradient was followed using MC3T3-E1 pre-osteoblastic cells. Cells were allowed to adhere for 24 h and then fixed and stained using rhodamine-phalloidin. Actin staining of the cells at different locations along the length of the cross-linking gradient revealed that MC3T3-E1 cells attached and spread better on regions of high stiffness (Fig. 8). In addition, formation of actin stress fibers was observed on the high-stiffness regions (data not shown), as expected for cells that respond to stiff substrates.51 Fig. 9 shows the cell number (Fig. 9a) and the average cell area (Fig. 9b) as a function of the position along the stiffness gradient. As expected from our previous studies on cell response to film rigidity,29 we observed that both the cell number and area decreased in the direction of decreasing stiffness.
Fig. 8.
Actin staining of MC3T3-E1 pre-osteoblastic cells on a (PLL-HA)12 film containing a gradient of stiffness along the microchannel. Images are obtained at a distance of 0 mm (A), 5 mm (B), and 17 mm (C) away from the inlet. Cells spread better on regions of high stiffness (A), and their spreading decreases along the length of the gradient. Scale bar: 200 μm.
Fig. 9.
MC3T3-E1 cellular response to stiffness gradient on a (PLL-HA)12 film. Number of cells attached on the stiffness gradient (A) and the average cell area (B) along the length of a channel. Error bars indicated the standard deviation between three different microchannels.
In Fig. 9a, the cell number was stable over the first part and then decreased progressively. Cell area varied between 2500 μm2 and 500 μm2 (Fig. 9b), with a marked decrease in cell area observed during the first 10 mm of the channel length. These results agree with those of our previous study on myoblast cells seeded on uniform films of different stiffness.26 Indeed, on highly cross-linked PEM films, myoblast cells spread well reaching a cell area of ~2000 μm2, whilst they spread poorly on low cross-linked films (~500 μm2) after 16 h.26 Of note, the three zone response previously seen with PLL-FITC and μbeads were no longer clearly detected as far as cell adhesion and spreading were concerned. The response obtained for cells might be indicative of the different diffusion rate of the small EDC molecule as compared to the larger PLL-FITC and μbeads. It may also be due to the active nature of the cells, which are able to migrate on the PEM surface.
When generating gradients of biomolecules, the physical properties of the substratum where the gradients are generated can often be controlled in a homogenous fashion. However, there are very few systems flexible enough to allow for the generation of gradients of physical cues, biochemical cues, or both types of cues at the same time. Complex systems have been proposed with dual functionalization of chemical and physical gradients including: hydrogel systems containing both a gradient in stiffness and protein concentration,52,53 and an electrospun nanofiber system with gradients in fiber strength and plasmid DNA concentration.54 With the simple system proposed here it will be possible to generate dual (either parallel or opposite) gradients in stiffness and biomolecules allowing generation of more complex, yet precise biomimetic systems. We anticipate the study of gradients of matrix-bound growth factors in more depth and to investigate the behavior of sensitive primary cells onto these well-defined substrates.
Conclusions
Surface gradients of topology (microbeads), biochemical cues (PLL-FITC, RGD) and physical cues (EDC/stiffness) were successfully generated on biopolymeric polyelectrolyte multilayer films. These gradients, which span centimeters in length, were stable and reproducible. Fluorescent microscopy revealed that the gradients of PLL-FITC and of μbeads contained three distinct zones: a high concentration region, a gradient region, and a low concentration region. Regarding the stiffness gradient, FTIR spectroscopy and AFM confirmed that a gradient of stiffness was generated over the range of 200 kPa–600 kPa. Pre-osteoblast cells adhered and spread well in the regions of highest cross-linking, while their adhesion and spreading decreased along the length of the cross-linking gradient. Similarly, C2C12 cells responded in a graded fashion to a biochemical gradient of RGD with regards to their cell area.
This simple yet robust technology can be applied to any number of polyelectrolyte pairs and can be used to generate gradients of a number of biomolecules (active peptides, ECM proteins, drugs, cytokines, etc.). It thus offers new possibilities in the future development of PEM films with anisotropic biochemical and mechanical properties. We envision applying this for the spatial presentation of important proteins and growth factors,26,27 mimicking the native cellular environment, such as fibroblast growth factors27 and bone morpho-genetic protein-2.55 With this tool, the study of cell response to surfaces presenting growth factors in the form of a gradient of concentration will be possible in vitro. In addition, this tool provides an efficient platform for finding optimal culture parameters for sensitive cells.
Acknowledgements
This work was supported by the European Commission (under FP7) via an ERC starting grant (BIOMIM, GA 259370) to CP and by the Whitaker International Fellows and Scholars Program by providing JA with a postdoctoral scholarship. The authors thank Varvara Gribova for the synthesis and characterization of the PGA-RGD used in this study.
References
- 1.Hynes RO. Science. 2009;326:1216–1219. doi: 10.1126/science.1176009. [DOI] [PMC free article] [PubMed] [Google Scholar]
- 2.Badylak SF. Biomaterials. 2007;28:3587–3593. doi: 10.1016/j.biomaterials.2007.04.043. [DOI] [PubMed] [Google Scholar]
- 3.Seidi A, Ramalingam M, Elloumi-Hannachi I, Ostrovidov S, Khademhosseini A. Acta Biomater. 2011;7:1441–1451. doi: 10.1016/j.actbio.2011.01.011. [DOI] [PubMed] [Google Scholar]
- 4.Wu J, Mao Z, Tan H, Han L, Ren T, Gao C. Interface Focus. 2012;2:337–355. doi: 10.1098/rsfs.2011.0124. [DOI] [PMC free article] [PubMed] [Google Scholar]
- 5.Genzer J, Bhat RR. Langmuir. 2008;24:2294–2317. doi: 10.1021/la7033164. [DOI] [PubMed] [Google Scholar]
- 6.Lutolf MP, Hubbell JA. Nat. Biotechnol. 2005;23:47–55. doi: 10.1038/nbt1055. [DOI] [PubMed] [Google Scholar]
- 7.Nguyen EH, Schwartz MP, Murphy WL. Macromol. Biosci. 2011;11:483–492. doi: 10.1002/mabi.201000448. [DOI] [PMC free article] [PubMed] [Google Scholar]
- 8.Chung BG, Choo J. Electrophoresis. 2010;31:3014–3027. doi: 10.1002/elps.201000137. [DOI] [PubMed] [Google Scholar]
- 9.Stefonek-Puccinelli TJ, Masters KS. Ann. Biomed. Eng. 2008;36:2121–2133. doi: 10.1007/s10439-008-9581-1. [DOI] [PMC free article] [PubMed] [Google Scholar]
- 10.Kipper MJ, Kleinman HK, Wang FW. Anal. Biochem. 2007;363:175–184. doi: 10.1016/j.ab.2007.01.036. [DOI] [PubMed] [Google Scholar]
- 11.Acharya AP, Dolgova NV, Moore NM, Xia CQ, Clare-Salzler MJ, Becker ML, Gallant ND, Keselowsky BG. Biomaterials. 2010;31:7444–7454. doi: 10.1016/j.biomaterials.2010.06.025. [DOI] [PubMed] [Google Scholar]
- 12.Masters KS. Macromol. Biosci. 2011;11:1149–1163. doi: 10.1002/mabi.201000505. [DOI] [PubMed] [Google Scholar]
- 13.Miller ED, Phillippi JA, Fisher GW, Campbell PG, Walker LM, Weiss LE. Comb. Chem. High Throughput Screening. 2009;12:604–618. doi: 10.2174/138620709788681907. [DOI] [PubMed] [Google Scholar]
- 14.Ker EDF, Chu B, Phillippi JA, Gharaibeh B, Huard J, Weiss LE, Campbell PG. Biomaterials. 2011;32:3413–3422. doi: 10.1016/j.biomaterials.2011.01.036. [DOI] [PMC free article] [PubMed] [Google Scholar]
- 15.Phillippi JA, Miller E, Weiss L, Huard J, Waggoner A, Campbell P. Stem Cells. 2008;26:127–134. doi: 10.1634/stemcells.2007-0520. [DOI] [PubMed] [Google Scholar]
- 16.Boudou T, Crouzier T, Ren KF, Blin G, Picart C. Adv. Mater. 2010;22:441–467. doi: 10.1002/adma.200901327. [DOI] [PubMed] [Google Scholar]
- 17.Wilson JT, Cui WX, Chaikof EL. Nano Lett. 2008;8:1940–1948. doi: 10.1021/nl080694q. [DOI] [PMC free article] [PubMed] [Google Scholar]
- 18.Decher G, Hong JD. Makromol. Chem., Macromol. Symp. 1991;46:321–327. [Google Scholar]
- 19.Decher G. Science. 1997;277:1232–1237. [Google Scholar]
- 20.Hammond PT. Adv. Mater. 2004;16:1271–1293. [Google Scholar]
- 21.Picart C. Curr. Med. Chem. 2008;15:685–697. doi: 10.2174/092986708783885219. [DOI] [PubMed] [Google Scholar]
- 22.Wang Y, Angelatos AS, Caruso F. Chem. Mater. 2008;20:848–858. [Google Scholar]
- 23.Tang Z, Wang Y, Podsiadlo P, Kotov NA. Adv. Mater. 2006;18:3203–3224. [Google Scholar]
- 24.Zelikin AN. ACS Nano. 2010;4:2494–2509. doi: 10.1021/nn100634r. [DOI] [PubMed] [Google Scholar]
- 25.Wittmer CR, Phelps JA, Saltzman WM, van Tassel PR. Biomaterials. 2007;28:851–860. doi: 10.1016/j.biomaterials.2006.09.037. [DOI] [PMC free article] [PubMed] [Google Scholar]
- 26.Crouzier T, Fourel L, Boudou T, Albiges-Rizo C, Picart C. Adv. Mater. 2011;23:H111–H118. doi: 10.1002/adma.201004637. [DOI] [PubMed] [Google Scholar]
- 27.Almodovar J, Bacon S, Gogolski J, Kisiday JD, Kipper MJ. Biomacromolecules. 2010;11:2629–2639. doi: 10.1021/bm1005799. [DOI] [PubMed] [Google Scholar]
- 28.Monge C, Ren KF, Berton K, Guillot R, Peyrade D, Picart C. Tissue Eng. A. 2012;18:1664–1676. doi: 10.1089/ten.tea.2012.0079. [DOI] [PMC free article] [PubMed] [Google Scholar]
- 29.Ren KF, Crouzier T, Roy C, Picart C. Adv. Funct. Mater. 2008;18:1378–1389. doi: 10.1002/adfm.200701297. [DOI] [PMC free article] [PubMed] [Google Scholar]
- 30.Semenov OV, Malek A, Bittermann AG, Voros J, Zisch AH. Tissue Eng. A. 2009;15:2977–2990. doi: 10.1089/ten.TEA.2008.0602. [DOI] [PubMed] [Google Scholar]
- 31.Sailer M, Barrett CJ. Macromolecules. 2012;45:5704–5711. [Google Scholar]
- 32.Han L, Mao Z, Wu J, Guo Y, Ren T, Gao C. Biomaterials. 2013;34:975–984. doi: 10.1016/j.biomaterials.2012.10.041. [DOI] [PubMed] [Google Scholar]
- 33.Kirchhof K, Andar A, Yin HB, Gadegaard N, Riehle MO, Groth T. Lab Chip. 2011;11:3326–3335. doi: 10.1039/c1lc20408d. [DOI] [PubMed] [Google Scholar]
- 34.Keenan TM, Folch A. Lab Chip. 2008;8:34–57. doi: 10.1039/b711887b. [DOI] [PMC free article] [PubMed] [Google Scholar]
- 35.He JK, Du YA, Villa-Uribe JL, Hwang CM, Li DC, Khademhosseini A. Adv. Funct. Mater. 2010;20:131–137. doi: 10.1002/adfm.200901311. [DOI] [PMC free article] [PubMed] [Google Scholar]
- 36.Du YN, Hancock MJ, He JK, Villa-Uribe JL, Wang B, Cropek DM, Khademhosseini A. Biomaterials. 2010;31:2686–2694. doi: 10.1016/j.biomaterials.2009.12.012. [DOI] [PMC free article] [PubMed] [Google Scholar]
- 37.Du Y, Shim J, Vidula M, Hancock MJ, Lo E, Chung BG, Borenstein JT, Khabiry M, Cropek DM, Khademhosseini A. Lab Chip. 2009;9:761–767. doi: 10.1039/b815990d. [DOI] [PMC free article] [PubMed] [Google Scholar]
- 38.Picart C, Elkaim R, Richert L, Audoin T, Arntz Y, Cardoso MD, Schaaf P, Voegel JC, Frisch B. Adv. Funct. Mater. 2005;15:83–94. [Google Scholar]
- 39.Schneider A, Francius G, Obeid R, Schwinte P, Hemmerle J, Frisch B, Schaaf P, Voegel JC, Senger B, Picart C. Langmuir. 2006;22:1193–1200. doi: 10.1021/la0521802. [DOI] [PubMed] [Google Scholar]
- 40.Shen L, Chaudouet P, Ji J, Picart C. Biomacromolecules. 2011;12:1322–1331. doi: 10.1021/bm200070k. [DOI] [PubMed] [Google Scholar]
- 41.Boudou T, Crouzier T, Auzely-Velty R, Glinel K, Picart C. Langmuir. 2009;25:13809–13819. doi: 10.1021/la9018663. [DOI] [PubMed] [Google Scholar]
- 42.Dimitriadis EK, Horkay F, Maresca J, Kachar B, Chadwick RS. Biophys. J. 2002;82:2798–2810. doi: 10.1016/S0006-3495(02)75620-8. [DOI] [PMC free article] [PubMed] [Google Scholar]
- 43.Picart C, Mutterer J, Richert L, Luo Y, Prestwich GD, Schaaf P, Voegel JC, Lavalle P. Proc. Natl. Acad. Sci. U. S. A. 2002;99:12531–12535. doi: 10.1073/pnas.202486099. [DOI] [PMC free article] [PubMed] [Google Scholar]
- 44.Richert L, Boulmedais F, Lavalle P, Mutterer J, Ferreux E, Decher G, Schaaf P, Voegel JC, Picart C. Biomacromolecules. 2004;5:284–294. doi: 10.1021/bm0342281. [DOI] [PubMed] [Google Scholar]
- 45.Walker GM, Beebe DJ. Lab Chip. 2002;2:131–134. doi: 10.1039/b204381e. [DOI] [PubMed] [Google Scholar]
- 46.Picart C, Lavalle P, Hubert P, Cuisinier FJG, Decher G, Schaaf P, Voegel JC. Langmuir. 2001;17:7414–7424. [Google Scholar]
- 47.Kunzler TP, Huwiler C, Drobek T, Voros J, Spencer ND. Biomaterials. 2007;28:5000–5006. doi: 10.1016/j.biomaterials.2007.08.009. [DOI] [PubMed] [Google Scholar]
- 48.Arnold M, Hirschfeld-Warneken VC, Lohmuller T, Heil P, Blummel J, Cavalcanti-Adam EA, Lopez-Garcia M, Walther P, Kessler H, Geiger B, Spatz JP. Nano Lett. 2008;8:2063–2069. doi: 10.1021/nl801483w. [DOI] [PMC free article] [PubMed] [Google Scholar]
- 49.Seidi A, Kaji H, Annabi N, Ostrovidov S, Ramalingam M, Khademhosseini A. Biomicrofluidics. 2011;5:22214. doi: 10.1063/1.3580756. [DOI] [PMC free article] [PubMed] [Google Scholar]
- 50.Nemoto N, Matsuda H, Tsunashima Y, Kurata M. Macromolecules. 1984;17:1731–1735. [Google Scholar]
- 51.Asparuhova MB, Gelman L, Chiquet M. Scand. J. Med. Sci. Sports. 2009;19:490–499. doi: 10.1111/j.1600-0838.2009.00928.x. [DOI] [PubMed] [Google Scholar]
- 52.Carr LR, Krause JE, Ella-Menye JR, Jiang SY. Biomaterials. 2011;32:8456–8461. doi: 10.1016/j.biomaterials.2011.07.062. [DOI] [PubMed] [Google Scholar]
- 53.Hale NA, Yang Y, Rajagopalan P. ACS Appl. Mater. Interfaces. 2010;2:2317–2324. doi: 10.1021/am100346k. [DOI] [PubMed] [Google Scholar]
- 54.Zou B, Liu YW, Luo XM, Chen F, Guo XQ, Li XH. Acta Biomater. 2012;8:1576–1585. doi: 10.1016/j.actbio.2012.01.003. [DOI] [PubMed] [Google Scholar]
- 55.Crouzier T, Ren K, Nicolas C, Roy C, Picart C. Small. 2009;5:598–608. doi: 10.1002/smll.200800804. [DOI] [PubMed] [Google Scholar]


