
Fig. 3.
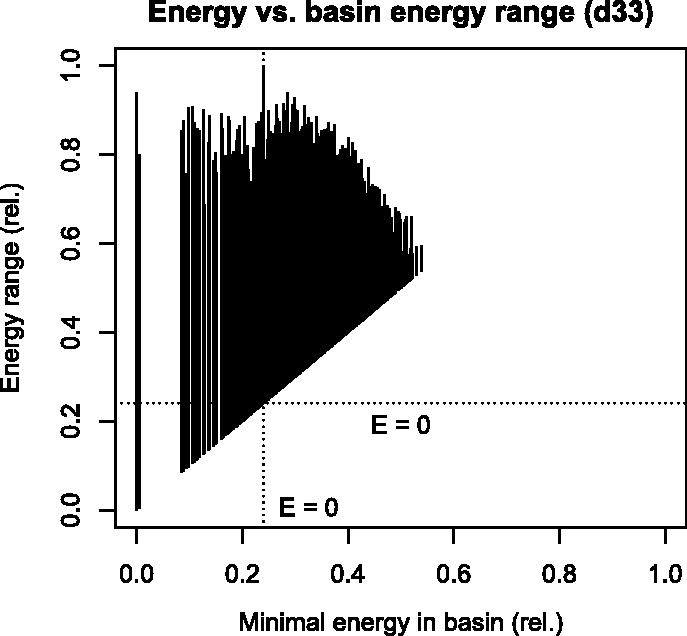
The energy range covered by each basin (Y-axis) sorted by the minimal energy within the basin (X-axis) over the whole energy range of the energy landscape of RNA d33. Relative energies are given by where denote the energy boundaries over X. The dotted lines mark the position of the unstructured state with energy 0