

Abstract
Motivation: Whole-genome sequencing of tumor samples has been demonstrated as an efficient approach for comprehensive analysis of genomic aberrations in cancer genome. Critical issues such as tumor impurity and aneuploidy, GC-content and mappability bias have been reported to complicate identification of copy number alteration and loss of heterozygosity in complex tumor samples. Therefore, efficient computational methods are required to address these issues.
Results: We introduce CLImAT (CNA and LOH Assessment in Impure and Aneuploid Tumors), a bioinformatics tool for identification of genomic aberrations from tumor samples using whole-genome sequencing data. Without requiring a matched normal sample, CLImAT takes integrated analysis of read depth and allelic frequency and provides extensive data processing procedures including GC-content and mappability correction of read depth and quantile normalization of B-allele frequency. CLImAT accurately identifies copy number alteration and loss of heterozygosity even for highly impure tumor samples with aneuploidy. We evaluate CLImAT on both simulated and real DNA sequencing data to demonstrate its ability to infer tumor impurity and ploidy and identify genomic aberrations in complex tumor samples.
Availability and implementation: The CLImAT software package can be freely downloaded at http://bioinformatics.ustc.edu.cn/CLImAT/.
Contact: aoli@ustc.edu.cn
Supplementary information: Supplementary data are available at Bioinformatics online.
1 INTRODUCTION
Various aberrations such as amplification, deletion and translocation of segmental regions are common features of cancer genomes and play an important role in tumorigenesis and progression (Albertson et al., 2003; Stratton et al., 2009). It is reported that dysfunction of oncogene and tumor suppressor gene is related to frequent genomic aberrations (Bignell et al., 2010; Stephens et al., 2009; Stratton et al., 2009). Genomic aberrations in specific regions have been used as an indicator of aggressiveness of cancer and clinical outcome (Carén et al., 2010; Suzuki et al., 2000). Genome-wide copy number alteration (CNA) and loss of heterozygosity (LOH) are two essential features of cancer genomes, and accurate detection of these abnormalities is a crucial step to assess genomic aberrations and cancer-related genes. Experimental technologies are now available for high-throughput profiling of genome-wide aberrations in tumor samples, such as array comparative genomic hybridization (Park, 2008), single nucleotide polymorphism (SNP) genotyping array (Li et al., 2011; Peiffer et al., 2006) and more recently, whole-genome sequencing (WGS) technology for massively parallel sequencing of DNA (Mardis, 2008; Metzker, 2009; Morozova and Marra, 2008; Schuster, 2007). By allowing for comprehensive analysis of genomic aberrations in cancer genomes, WGS has been demonstrated as an efficient platform for studies of human cancers (Metzker, 2009).
Although several computational approaches have been proposed for assessing genomic aberrations from tumor sequencing data (Boeva et al., 2011, 2012; Carter et al., 2012; Gusnanto et al., 2012; Ha et al., 2012; Mayrhofer et al., 2013; Sathirapongsasuti et al., 2011; Xi et al., 2011), most of these methods do not effectively address the critical issues encountered in interpreting complex tumor samples. For example, tumor samples are often infiltrated with normal stroma, resulting in inevitable contamination of normal DNA and dilution of somatic aberration signals (Boeva et al., 2011, 2012; Gusnanto et al., 2012; Ha et al., 2012; Mayrhofer et al., 2013). Impurity of tumor sample can significantly alter WGS data; and therefore, complicates genomic aberration detection, especially when normal cells dominate in tumor samples. Recent studies, such as FREEC (Boeva et al., 2011, 2012) and APOLLOH (Ha et al., 2012), have been proposed to address this issue. FREEC constructs copy number and B-allele frequency (BAF) profiles to detect CNA and allelic content in cancer genomes, with optional correction for tumor impurity. APOLLOH is designed for LOH detection using tumor-normal paired samples, and the issue of tumor impurity is addressed by a two-component mixture model for allelic read counts.
In addition to tumor impurity, tumor aneuploidy is another critical issue in genomic aberration detection, which is caused by various numerical and structural chromosomal abnormalities frequently observed in cancer genome (Carter et al., 2012). Although APOLLOH introduces a delicate statistical model to eliminate the effect of tumor impurity, it does not take account of tumor aneuploidy in modeling and analyzing tumor WGS data. To handle aneuploid tumor samples, FREEC provides an option for users to input tumor ploidy. Currently, automatic correction for tumor aneuploidy using WGS data still remains a challenging task. Theoretically, it is often difficult to determine the actual ploidy of cancer cells by sequencing technology (Gusnanto et al., 2012). In some particular cases, somatic aberration signals could present similar characteristics among genomes of different ploidy (Gusnanto et al., 2012; Oesper et al., 2013), which makes it hard to accurately estimate the tumor ploidy. It should be pointed out that, complicated interpretation of WGS data are even more challenging in tumor samples confounded by both tumor impurity and aneuploidy, as they usually cannot be solved separately (Oesper et al., 2013).
So far, only a few algorithms have been proposed for analyzing WGS data of impure tumor samples with aneuploidy (Carter et al., 2012; Gusnanto et al., 2012; Mayrhofer et al., 2013; Oesper et al., 2013). For example, CNAnorm (Gusnanto et al., 2012) uses a mixture normal distribution for ratios of tumor-normal read counts to correct tumor impurity and aneuploidy. However, CNAnorm assumes that the most common component in the normal mixture is diploid, which may not hold for aneuploid tumor samples. Moreover, it cannot detect LOH in cancer genomes. Another approach, ABSOLUTE (Carter et al., 2012), is originally introduced to detect CNA from SNP array data by inferring tumor impurity and ploidy. Although it can be adapted to analyze DNA sequencing data, a previous study shows that the underlying statistical models used by ABSOLUTE do not comprehensively describe the characteristics of DNA sequencing data and therefore may sometimes gravely misestimate the tumor impurity and ploidy (Oesper et al., 2013). Recently, Markus et al. introduced a novel method called Patchwork (Mayrhofer et al., 2013) for allele-specific copy number analysis of sequenced tumor tissue in consideration of tumor impurity and tumor aneuploidy, which requires intermediate arguments determined by users. In addition, it is noteworthy that another method called THetA was proposed recently to analyze tumor sequencing data (Oesper et al., 2013). THetA mainly focuses on the inference of cancer subclones in heterogeneous tumor samples and cannot detect LOH in cancer genomes, as it only utilizes read count data. Therefore, it is essential to develop an efficient approach for analysis of tumor sequencing data by comprehensively addressing the challenge of tumor impurity and aneuploidy.
In this study, we present a novel method called CLImAT (CNA and LOH Assessment in Impure and Aneuploid Tumors) to detect genomic aberrations with automatic correction for both tumor impurity and aneuploidy. Without requiring a matched normal sample, CLImAT fully explores both read depth (RD) and allele frequency derived from tumor WGS data, and provides extensive data processing procedures including elimination of sequencing/mapping bias and quantile normalization (QN) of allele frequency data. By adopting an integrated Hidden Markov Model (HMM) that quantitatively delineates tumor impurity and ploidy, CLImAT provides accurate identification of various kinds of genomic aberrations even for highly impure tumor samples with aneuploidy. We apply CLImAT to both simulated and real tumor data, and the results demonstrate the superior performance of CLImAT in analysis of genomic aberrations using tumor WGS data.
2 METHODS
2.1 Simulated data by sampling reads from tumor-normal mixture
To assess the performance of CLImAT for complex tumor samples, we generate simulated tumor samples with different impurity and ploidy. Similar to the procedure proposed previously (Duan et al., 2013), virtual tumor-normal mixture experiment is performed on chromosome 20 of human reference genome (NCBI build 36, hg18) by sampling reads from a control genome and a test genome with tumor impurity ranging from 0 to 0.9 with 0.1 increments (Supplementary Methods). The test genome is constructed by dividing the reference genome into 20 non-overlapping and equally sized segments, which are randomly assigned with particular kinds of genomic aberrations (Supplementary Figure S1). Sampled reads from both control and test genome are mapped to the reference using Bowtie (Langmead et al., 2009) with default parameters. BAM files and pileups are generated by SAMtools (Li et al., 2009). For each combination of predetermined tumor impurity and ploidy (diploidy, triploidy and tetraploidy), three BAM files are generated at 10×, 30× and 60× sampled coverage, respectively. The average copy number (ACN) is 2.48, 3.19 and 4.00 for diploid, triploid and tetraploid tumor samples, respectively. By this way, we generate totally 90 simulated tumor samples for comprehensive evaluation of prediction performance. Detailed information about construction of test genomes and read sampling process is provided in Supplementary Methods.
2.2 Real sequencing data of tumor samples
WGS data from three unpaired primary triple negative breast cancer (TNBC) samples described in a previous study (Shah et al., 2012) are adopted in this study. Each sample was sequenced at ∼30× coverage on the Life/ABI SOLID sequencing platform. Reads were mapped to the reference genome hg18 using BioScope. The data was downloaded from European Genome-Phenome Archive (EGA) with accession number EGAS00001000132.
2.3 Pipeline of CLImAT
The pipeline of CLImAT is depicted in Supplementary Figure S2. RD used in this study is retrieved from the BAM file using SAMtools (Li et al., 2009) and is further processed to correct GC and mappability bias. BAF signals of all known SNPs in dbSNP database (Sherry et al., 2001) are normalized to eliminate allelic bias. Both RD and BAF signals are modeled by an integrated HMM for identifying genomic aberrations, including CNA and LOH, and estimating tumor impurity and ploidy.
2.4 Deriving RD and BAF from tumor WGS data
In this study, RD is obtained by counting the reads with starting position within a 1000-bp window centered at each SNP. For BAF, we count the reads that override the SNP and the reads with non-reference base at the corresponding SNP as B allelic read count. Thus, BAF of the SNP is calculated as the proportion of B allelic reads. Consisted with the procedure adopted in previous study (Ha et al., 2012), data filtering is taken to further eliminate positions that have either low depth (<10 reads for 30/60× coverage and <5 reads for 10× coverage) or high depth (>250 reads).
2.5 Signal correction and normalization
GC-content and mappability may heavily affect RD signals and bring bias to CNA detection. Therefore, as the first step we perform a correction procedure to remove the bias in RD signals. For each window used in RD calculation, GC-content is measured by calculating the G + C percentage, and the mappability score is defined as the average of mappability values. The mappability file used in this study was obtained from http://hgdownload.cse.ucsc.edu/goldenPath/hg18/encodeDCC/wgEncodeMapability/. Following the procedure used in (Yoon et al., 2009), we scale GC-content and mappability score to integer values between 0 and 100, and perform correction of RD signals using the following equation:
| (1) |
where rdci is the corrected RD of the ith window, rdi is the original RD of the ith window, m is the overall median RD of all the windows and mX is the median RD of the windows that have the same GC-content and mappability values as the ith window.
It has been reported that loss of reads (LOR) issue happens in the alignment step of sequencing data processing (Kim et al., 2013). Indeed, most aligners, such as BioScope and BWA (Li and Durbin, 2009), have the preference for aligning reads to reference allele over alternative allele. Reads sequenced from alternative chromosome are inclined to be discarded because of mismatches between reference sequence and read sequence, leading to asymmetrical distribution of allelic frequencies. Therefore, it is necessary to normalize the BAF data for better estimation of LOH and other related parameters, including tumor impurity and ploidy. We adopt an efficient QN (Bolstad et al., 2003) procedure to address this issue (Supplementary Methods).
2.6 Integrated HMM
We propose an integrated HMM that takes RD and BAF data as input. Supplementary Table S1 shows the hidden states defined in the HMM with detailed description of each HMM state regarding copy number, tumor genotype mutated from normal cell genotype and zygosity status. Tumor and normal genotype pairs are used to give a detailed view of the intrinsic relationship between genotypes of tumor and normal cells admixed in tumor samples. For example, (AAAB, AB) is the case that tumor genotype ‘AAAB’ is derived from normal cell genotype ‘AB’.
2.6.1 Emission probabilities
Aligning a read to a genomic position can be treated as a Bernoulli trial (Ha et al., 2012). Thus, given the number of reads that override a SNP position, the number of reads that have non-reference base at corresponding SNP position is modeled by a binomial distribution. Suppose B allelic read count and total read count of the ith SNP are bi and Ni, respectively, the observation probability for hidden state c can be formulated as:
| (2) |
where gc is the number of tumor genotypes included in state c. The ACN yc and average B allele copy number zck for state c are defined as:
| (3) |
| (4) |
where ns is the normal copy number and is fixed to 2 in this study, nc is the tumor copy number in state c and ws is the level of tumor impurity. us denotes expected BAF value of normal cells and is fixed to 0.5, and uck represents the expected BAF value of the kth tumor genotype in state c.
Taking into account the over-dispersed distribution of RD values (Anders and Huber, 2010), we use a negative binomial distribution to model RD signals. Suppose that RD of the ith SNP is di, the observation probability for hidden state c can be formulated as:
| (5) |
where Γ is the gamma function and pc is a parameter of negative binomial distribution defined as the probability of success. The average read count for state c is defined as:
| (6) |
where λ is the mean value of copy neutral read count and varies with respect to tumor ploidy change. o accounts for background RD noise resulted from sequencing error and wrongly mapped reads.
2.6.2 EM algorithm for parameter estimation
We employ expectation maximization (EM) algorithm for HMM training and parameter estimation. In the expectation step, the expectation of the partial log-likelihood of BAF is formulated as:
 |
(7) |
where represents the posterior probability that the ith SNP is in state c and is calculated by the forward-backward algorithm (Rabiner, 1989). Similarly, the expectation of the partial log-likelihood function of RD can be formulated as:
| (8) |
In the maximization step of the EM algorithm, we use Newton algorithm to update the parameters in emission probabilities. For example, during iteration n we update the parameter by using the following formula:
| (9) |
All the parameters are iteratively updated until the EM algorithm converges. Copy number and tumor genotype for each SNP are determined by the hidden state with the largest conditional probability. In addition, post-processing is performed for copy number annotation of highly amplified regions (copy number >7) according to the mean RD values of all SNPs within these regions (Supplementary Methods). To evaluate the reliability of CLImAT results, we also calculate a reliability score for each region to measure how well the data fit to the model (Supplementary Methods).
3 RESULTS
3.1 Correction and normalization of RD and BAF signals
We assess the performance of GC-content and mappability correction and plot the distribution of RD with respect to GC-content and mappability score for 1–3 copies (Supplementary Figure S3). Before correction, RD signals demonstrate a unimodal distribution with respect to GC-content and are positively correlated with mappability scores. After correction both GC-content and mappability bias is significantly eliminated. Further investigation suggests the order of GC-content and mappability correction performed to tumor WGS data affects the final results and simultaneous correction for both GC-content and mappability bias shows better performance (Supplementary Figure S4).
It is observed that owing to LOR issue BAF plots of tumor samples display asymmetrical bands positioned around 0.5 (Supplementary Figure S5A). The altered distribution of BAF signals seriously hampers accurate identification of genomic aberrations in tumor samples. After applying the QN procedure, BAF signals are largely corrected with symmetrical bands positioned around 0.5 (Supplementary Figure S5B).
3.2 Appling CLImAT to simulated data
We apply CLImAT to simulated tumor data, and the results are shown in Supplementary Figure S6. The RD and BAF signals vary dramatically with increased tumor impurity for both diploid and triploid genomes. Especially, with 90% normal cells admixed in the tumor sample, both RD and BAF signals for aberrant regions are dramatically attenuated. CLImAT correctly detects all aberrant regions and provides CNA and LOH prediction with reasonable performance.
3.2.1 Estimation of tumor impurity and ploidy
We examine tumor impurity estimated by CLImAT and ABSOLUTE (Carter et al., 2012) on simulated data, and the results of tumor samples at 60× coverage are shown in Figure 1A. CLImAT accurately estimates tumor impurity from 0 to 0.9 with significant correlation with the ground truth (correlation coefficient = 0.999, P = 6.24 × 10⁻²¹ for diploid samples, correlation coefficient = 0.999, P = 2.75 × 10⁻¹² for triploid samples and correlation coefficient = 0.999, P = 1.42 × 10⁻¹¹ for tetraploid samples), indicating CLImAT can precisely recover the proportion of cancer cells in tumor samples. In contrast, the performance of ABSOLUTE is not optimal and sometimes the results obviously deviate from the ground truth. Similar results are observed for simulated samples at 30× coverage (Supplementary Figure S7). To assess the performance of tumor ploidy estimation, we calculate the ACNs for simulated samples from the results of ABSOLUTE and CLImAT. As shown in Figure 1B, CLImAT exhibits prominent advantage over ABSOLUTE in estimating tumor ploidy. For example, CLImAT correctly identify all diploid samples at 30× coverage as diploidy, whereas ABSOLUTE tends to assign them as hyperploidy. Taken together, these results suggest that CLImAT can efficiently estimate both tumor impurity and tumor ploidy from complicated tumor samples.
Fig. 1.

Estimated tumor impurity and ACN of simulated samples. (A) Tumor impurity estimated by ABSOLUTE and CLImAT for samples at 60× coverage. 2p: diploid samples, 3p: triploid samples, 4p: tetraploid samples. (B) ACNs estimated by ABSOLUTE and CLImAT for simulated samples. Each bar shows the mean and standard deviation of estimated ACNs obtained from 10 samples with tumor impurity ranging from 0 to 0.9
3.2.2 LOH and CNA detection
We adopt the performance evaluation procedure proposed in APOLLOH (Ha et al., 2012), in which all the calls of the informative (heterozygous) positions are used as the golden standard to compare the abilities of different computational methods in detecting genomic aberrations. Accordingly, the CNA/LOH calls of heterozygous positions pre-determined in unpaired simulated data are treated as the ground truth. We use the standard way for performance evaluation by separately comparing the results of the computational methods investigated in this study to the ground truth in terms of sensitivity and specificity (more details of performance evaluation are provided in Supplementary Methods). The LOH detection results of three computational methods, FREEC (Boeva et al., 2012), SNVMix (Goya et al., 2010) and CLImAT, are shown in Figure 2. For diploid tumor samples (Fig. 2A), FREEC shows high specificity in all tests and the sensitivity is generally good at medium tumor impurity levels. Compared with the other methods, CLImAT demonstrates strong robustness to tumor impurity and maintains high sensitivity (>0.99) across all tumor samples with impurity level <0.9. It also keeps consistent high specificity with respect to different tumor impurity levels (<0.8) and sampled coverage. Similar results are observed for triploid and tetraploid tumor samples (Fig. 2B and C).
Fig. 2.

LOH detection performance of FREEC, SNVMix and CLImAT on unpaired simulated data. (A) Results for diploid samples. (B) Results for triploid samples. (C) Results for tetraploid samples
Next, CNA detection performance is evaluated for FREEC and CLImAT, and the results suggest that FREEC has good performance for diploid tumor samples when tumor impurity is <0.5 (Supplementary Figure S8A). At larger tumor impurity levels, the sensitivity decreases while the specificity remains high. With similar specificity across all impurity levels, CLImAT is able to retain high sensitivity (>0.99) when the tumor impurity is <0.9. For triploid and tetraploid tumor samples (Supplementary Figure S8B and C), CLImAT also performs well in identifying CNA regions. At the same time, we investigate the performance of Patchwork, and results of simulated tumor samples are shown in Table S2. We find that in general both Patchwork and CLImAT can provide accurate aberration detection with similar performance, if the intermediate arguments of Patchwork are correctly determined by the user. Furthermore, we test CLImAT on low-coverage sequencing data, and the results for simulated data with 10× coverage suggest that CLImAT may also be applied to low coverage tumor WGS data when tumor impurity level is not high (Supplementary Figure S9).
In addition to aberration detection for tumor samples, we examine the reliability score (Supplementary Methods) that is used to measure how well the data fits to the model. For simulated tumor data with two cancer subclones (Supplementary Figure S10), the reliability score for the heterogeneous region is significantly lower than those of other homogeneous regions, suggesting it can help the user to evaluate the fitness of the model and provide better interpretation of the results.
3.3 Applying CLImAT to TNBC samples
Three TNBC samples sequenced at ∼30× coverage are adopted to examine the performance of CLImAT, which are also assayed by Affymetrix SNP6.0 array for comparison. By using ASCAT (Van Loo et al., 2010), the results generated from SNP arrays are used as the ground truth. We first evaluate ACN and impurity of these tumor samples using different methods, and the results are shown in Table 1. From the results of ASCAT, sample 1 is identified as aneuploid tumor, whereas samples 2 and 3 are identified as hyperploid tumors. Tumor sample 1 demonstrates genome-wide deletions with ACN of 1.67, whereas tumor samples 2 and 3 include dramatic amplifications along the whole cancer genome, with ACN of 3.02 and 4.16, respectively. CLImAT provides consistent estimation of ACN for the three tumor samples. Also, the tumor impurity levels estimated by CLImAT are in good concordance with the ground truth. These results suggest CLImAT has the potential for automatically identifying and correcting for tumor impurity and aneuploidy in complicated tumor samples.
Table 1.
ACN and tumor impurity estimated by FREEC, ASCAT and CLImAT for primary TNBC samples
| Methods | ACN |
Impurity |
||||
|---|---|---|---|---|---|---|
| Sample 1 | Sample 2 | Sample 3 | Sample 1 | Sample 2 | Sample 3 | |
| ASCAT | 1.67 | 3.02 | 4.16 | 0.26 | 0.44 | 0.38 |
| CLImAT | 1.87 | 3.15 | 4.13 | 0.19 | 0.43 | 0.32 |
| FREEC | 1.92 | 3.77 | 4.92 | 0.20 | 0.22 | 0.29 |
Next, we examine LOH detection performance of FREEC, CLImAT and SNVMix (Fig. 3). The same performance evaluation procedure for simulated data analysis is adopted here, and the CNA/LOH calls of heterozygous positions recognized by ASCAT are treated as the ground truth (Supplementary Methods). For all three tumor samples, CLImAT compares favorably to SNVMix and FREEC. It achieves superior sensitivity of 0.98, 0.97 and 0.94 for samples 1, 2 and 3, respectively, with specificity better than or comparable with those of the other methods. We also examine the performance of CNA detection, and the results in Supplementary Table S3 show CLImAT has high consistency with ASCAT. Furthermore, Figure 4 illustrates the WGS and SNP array data for chromosome 8, 13 and 14 of tumor sample 1, in which both BAF and LRR/RD signals generated from different platforms show similar patterns on aberrant regions. Both CLImAT and ASCAT identify consecutive LOH regions spanning chromosomes 8, 13 and 14, board hemizygous deletions on 8p(11.23–22), 8q(11.21–22.1), 13q(21.2–31.3), 14p(11.1–12) and 14q(21.3–23.1, 23.2–23.3 and 32.13–32.33), and board amplifications on chromosome 13q(12.11–13.3 and 32.1–34). In addition, benefited from high resolution of WGS platform, CLImAT provide more precise detection of small focal aberrations than ASCAT. For example, on 8p23 ASCAT only detects one homozygous deletion whereas CLImAT identify two additional homozygous deletion regions on 8p23.1, which harbors a potential tumor suppressor gene PinX1 related to telomerase activity and chromosome stability (Zhou et al., 2011).
Fig. 3.
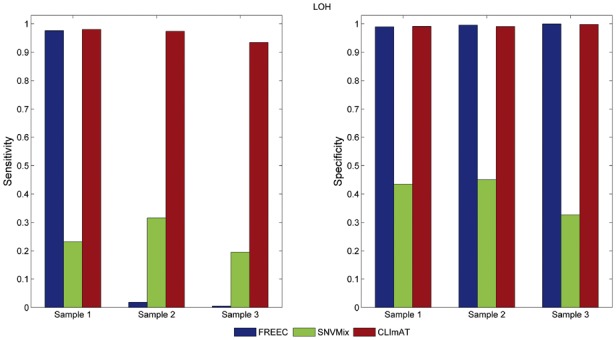
LOH detection performance for primary TNBC samples. LOH detected by ASCAT from Affymetrix SNP6.0 arrays is used as ground truth
Fig. 4.

Result comparison of CLImAT and ASCAT for TNBC sample 1. BAF is presented by five different aberration states: homozygous deletion (HOMD), hemizygous deletion (HEMD), heterozygous (HET), copy neutral LOH (NLOH) and amplified LOH (ALOH). LRR/RD is presented by homozygous deletion (HOMD), hemizygous deletion (HEMD), neutral (NEUT) and amplification (AMP)
4 DISCUSSION AND CONCLUSION
Featured with finer resolution than previous genomic technologies, WGS allows more comprehensive analysis of tumor aberrations. In this study, we introduce an efficient computational approach for this purpose, which presents remarkable advantages over existing methods for interpretation of complicated tumor samples without prior knowledge of tumor impurity and ploidy. One advantage of CLImAT is the correction and normalization procedure for improving data quality of unpaired tumor samples. For example, BAF is normalized in CLImAT for elimination of LOR bias, which is indispensible for further statistical modeling analysis of WGS data. GC-content and mappability correction of RD is also a crucial step for detecting aberrations in unpaired tumor samples.
Another advantage of CLImAT lies in the fact that it takes integrated analysis of RD and BAF using a novel HMM to provide accurate detection of genome-wide aberrations in tumor samples. The emission probabilities of HMM used in CLImAT give comprehensive description of the statistical behavior of sequencing data generated from tumor samples. Unlike previous approaches using Poisson distributions, more flexible negative binomial distribution is adopted to model over-dispersed RD signals. Moreover, the relevant parameters including tumor impurity and ploidy are automatically estimated by EM algorithm. These approaches ensure the performance of CLImAT for complex tumor samples.
Despite of the advantages mentioned above, CLImAT also has limitations in modeling and analysis of tumor sequencing data. First, CLImAT cannot be applied to exome-sequencing data, as it is originally designed to deal with unpaired WGS data. Second, although >2.6 million SNPs are investigated in CLImAT and only 1.5% adjacent SNPs have relatively large distance (>5 kb), the resolution of CLImAT may still be limited by genomic breakpoints that lie between SNPs. To further improve the resolution of CLImAT, we provide an option to estimate copy number for the regions between distant SNPs (>1 kb) by calculating the corresponding RD signals (Supplementary Methods). Third, CLImAT does not account for the issue of tumor heterogeneity (Mayrhofer et al., 2013; Oesper et al., 2013). The basic assumption adopted in CLImAT is that there is a single copy number for all tumor cells, which will not hold if multiple subclones exist in a tumor sample. Recently, Oesper et al. investigated tumor heterogeneity using DNA sequencing data and showed that multiple tumor subclones may often exist in tumor samples (Oesper et al., 2013), suggesting that tumor heterogeneity is another key factor in interpreting tumor sequencing data. In heterogeneous tumor samples, the somatic aberrant signals derived from tumor sequencing data can be complicated, which makes it hard to deconvolute subclonal aberrations. Therefore, more advanced methods are required to assess tumor heterogeneity in tumor sequencing data.
In conclusion, we present CLImAT, an efficient and powerful bioinformatics tool, for detection of genomic aberrations using tumor WGS data. We expect it will be helpful for comprehensive interpretation of cancer genome and show its potential usefulness in clinical diagnosis and treatment for cancers.
Supplementary Material
ACKNOWLEDGEMENTS
This manuscript was prepared using a limited access dataset obtained from British Columbia Cancer Agency Branch (BCCA) and does not necessarily reflect the options or views from BCCA. We thank the editor and reviewers for their helpful comments and suggestions to improve this manuscript.
Funding: National Natural Science Foundation of China (31100955, 61101061).
Conflict of Interest: none declared.
REFERENCES
- Albertson DG, et al. Chromosome aberrations in solid tumors. Nat. Genet. 2003;34:369–376. doi: 10.1038/ng1215. [DOI] [PubMed] [Google Scholar]
- Anders S, Huber W. Differential expression analysis for sequence count data. Genome Biol. 2010;11:R106. doi: 10.1186/gb-2010-11-10-r106. [DOI] [PMC free article] [PubMed] [Google Scholar]
- Bignell GR, et al. Signatures of mutation and selection in the cancer genome. Nature. 2010;463:893–898. doi: 10.1038/nature08768. [DOI] [PMC free article] [PubMed] [Google Scholar]
- Boeva V, et al. Control-free calling of copy number alterations in deep-sequencing data using GC-content normalization. Bioinformatics. 2011;27:268–269. doi: 10.1093/bioinformatics/btq635. [DOI] [PMC free article] [PubMed] [Google Scholar]
- Boeva V, et al. Control-FREEC: a tool for assessing copy number and allelic content using next-generation sequencing data. Bioinformatics. 2012;28:423–425. doi: 10.1093/bioinformatics/btr670. [DOI] [PMC free article] [PubMed] [Google Scholar]
- Bolstad BM, et al. A comparison of normalization methods for high density oligonucleotide array data based on variance and bias. Bioinformatics. 2003;19:185–193. doi: 10.1093/bioinformatics/19.2.185. [DOI] [PubMed] [Google Scholar]
- Carén H, et al. High-risk neuroblastoma tumors with 11q-deletion display a poor prognostic, chromosome instability phenotype with later onset. Proc. Natl Acad. Sci. USA. 2010;107:4323–4328. doi: 10.1073/pnas.0910684107. [DOI] [PMC free article] [PubMed] [Google Scholar]
- Carter SL, et al. Absolute quantification of somatic DNA alterations in human cancer. Nat. Biotechnol. 2012;30:413–421. doi: 10.1038/nbt.2203. [DOI] [PMC free article] [PubMed] [Google Scholar]
- Duan J, et al. Comparative studies of copy number variation detection methods for next-generation sequencing technologies. PLoS One. 2013;8:e59128. doi: 10.1371/journal.pone.0059128. [DOI] [PMC free article] [PubMed] [Google Scholar]
- Goya R, et al. SNVMix: predicting single nucleotide variants from next-generation sequencing of tumors. Bioinformatics. 2010;26:730–736. doi: 10.1093/bioinformatics/btq040. [DOI] [PMC free article] [PubMed] [Google Scholar]
- Gusnanto A, et al. Correcting for cancer genome size and tumour cell content enables better estimation of copy number alterations from next-generation sequence data. Bioinformatics. 2012;28:40–47. doi: 10.1093/bioinformatics/btr593. [DOI] [PubMed] [Google Scholar]
- Ha G, et al. Integrative analysis of genome-wide loss of heterozygosity and monoallelic expression at nucleotide resolution reveals disrupted pathways in triple-negative breast cancer. Genome Res. 2012;22:1995–2007. doi: 10.1101/gr.137570.112. [DOI] [PMC free article] [PubMed] [Google Scholar]
- Kim S, et al. Virmid: accurate detection of somatic mutations with sample impurity inference. Genome Biol. 2013;14:R90. doi: 10.1186/gb-2013-14-8-r90. [DOI] [PMC free article] [PubMed] [Google Scholar]
- Langmead B, et al. Ultrafast and memory-efficient alignment of short DNA sequences to the human genome. Genome Biol. 2009;10:R25. doi: 10.1186/gb-2009-10-3-r25. [DOI] [PMC free article] [PubMed] [Google Scholar]
- Li H, Durbin R. Fast and accurate short read alignment with Burrows–Wheeler transform. Bioinformatics. 2009;25:1754–1760. doi: 10.1093/bioinformatics/btp324. [DOI] [PMC free article] [PubMed] [Google Scholar]
- Li H, et al. The sequence alignment/map format and SAMtools. Bioinformatics. 2009;25:2078–2079. doi: 10.1093/bioinformatics/btp352. [DOI] [PMC free article] [PubMed] [Google Scholar]
- Li A, et al. GPHMM: an integrated hidden Markov model for identification of copy number alteration and loss of heterozygosity in complex tumor samples using whole genome SNP arrays. Nucleic Acids Res. 2011;39:4928–4941. doi: 10.1093/nar/gkr014. [DOI] [PMC free article] [PubMed] [Google Scholar]
- Mardis ER. Next-generation DNA sequencing methods. Annu. Rev. Genomics Hum. Genet. 2008;9:387–402. doi: 10.1146/annurev.genom.9.081307.164359. [DOI] [PubMed] [Google Scholar]
- Mayrhofer M, et al. Patchwork: allele-specific copy number analysis of whole genome sequenced tumor tissue. Genome Biol. 2013;14:R24. doi: 10.1186/gb-2013-14-3-r24. [DOI] [PMC free article] [PubMed] [Google Scholar]
- Metzker ML. Sequencing technologies—the next generation. Nat. Rev. Genet. 2009;11:31–46. doi: 10.1038/nrg2626. [DOI] [PubMed] [Google Scholar]
- Morozova O, Marra MA. Applications of next-generation sequencing technologies in functional genomics. Genomics. 2008;92:255–264. doi: 10.1016/j.ygeno.2008.07.001. [DOI] [PubMed] [Google Scholar]
- Oesper L, et al. THetA: Inferring intra-tumor heterogeneity from high-throughput DNA sequencing data. Genome Biol. 2013;14:R80. doi: 10.1186/gb-2013-14-7-r80. [DOI] [PMC free article] [PubMed] [Google Scholar]
- Park PJ. Experimental design and data analysis for array comparative genomic hybridization. Cancer Invest. 2008;26:923–928. doi: 10.1080/07357900801993432. [DOI] [PubMed] [Google Scholar]
- Peiffer DA, et al. High-resolution genomic profiling of chromosomal aberrations using Infinium whole-genome genotyping. Genome Res. 2006;16:1136–1148. doi: 10.1101/gr.5402306. [DOI] [PMC free article] [PubMed] [Google Scholar]
- Rabiner LR. A tutorial on hidden Markov models and selected applications in speech recognition. Proc. IEEE. 1989;77:257–286. [Google Scholar]
- Sathirapongsasuti JF, et al. Exome sequencing-based copy-number variation and loss of heterozygosity detection: exomeCNV. Bioinformatics. 2011;27:2648–2654. doi: 10.1093/bioinformatics/btr462. [DOI] [PMC free article] [PubMed] [Google Scholar]
- Schuster SC. Next-generation sequencing transforms today’s biology. Nature. 2007;200:8. doi: 10.1038/nmeth1156. [DOI] [PubMed] [Google Scholar]
- Shah SP, et al. The clonal and mutational evolution spectrum of primary triple-negative breast cancers. Nature. 2012;486:395–399. doi: 10.1038/nature10933. [DOI] [PMC free article] [PubMed] [Google Scholar]
- Sherry ST, et al. dbSNP: the NCBI database of genetic variation. Nucleic Acids Res. 2001;29:308–311. doi: 10.1093/nar/29.1.308. [DOI] [PMC free article] [PubMed] [Google Scholar]
- Stephens PJ, et al. Complex landscapes of somatic rearrangement in human breast cancer genomes. Nature. 2009;462:1005–1010. doi: 10.1038/nature08645. [DOI] [PMC free article] [PubMed] [Google Scholar]
- Stratton MR, et al. The cancer genome. Nature. 2009;458:719–724. doi: 10.1038/nature07943. [DOI] [PMC free article] [PubMed] [Google Scholar]
- Suzuki S, et al. An approach to analysis of large-scale correlations between genome changes and clinical endpoints in ovarian cancer. Cancer Res. 2000;60:5382–5385. [PubMed] [Google Scholar]
- Van Loo P, et al. Allele-specific copy number analysis of tumors. Proc. Natl Acad. Sci. USA. 2010;107:16910–16915. doi: 10.1073/pnas.1009843107. [DOI] [PMC free article] [PubMed] [Google Scholar]
- Xi R, et al. Copy number variation detection in whole-genome sequencing data using the Bayesian information criterion. Proc. Natl Acad. Sci. USA. 2011;108:E1128–E1136. doi: 10.1073/pnas.1110574108. [DOI] [PMC free article] [PubMed] [Google Scholar]
- Yoon S, et al. Sensitive and accurate detection of copy number variants using read depth of coverage. Genome Res. 2009;19:1586–1592. doi: 10.1101/gr.092981.109. [DOI] [PMC free article] [PubMed] [Google Scholar]
- Zhou XZ, et al. The telomerase inhibitor PinX1 is a major haploinsufficient tumor suppressor essential for chromosome stability in mice. J. Clin. Invest. 2011;121:1266. doi: 10.1172/JCI43452. [DOI] [PMC free article] [PubMed] [Google Scholar]
Associated Data
This section collects any data citations, data availability statements, or supplementary materials included in this article.