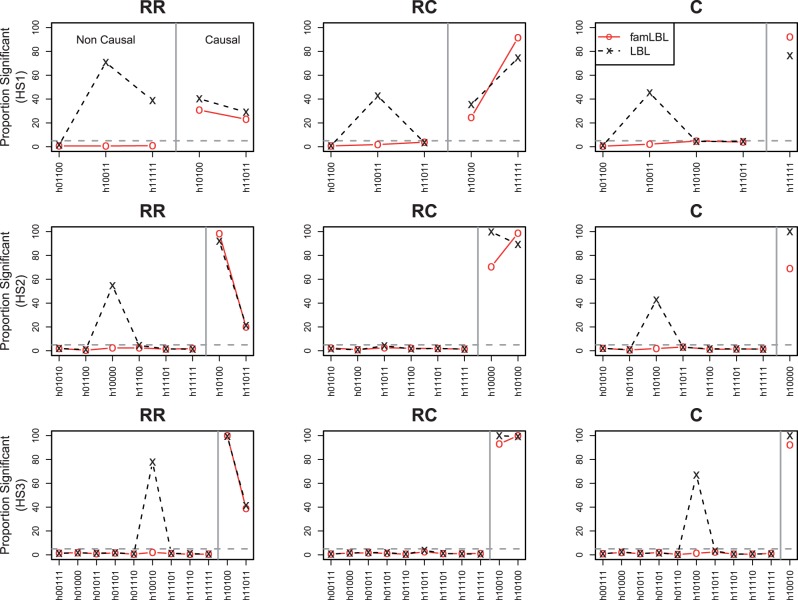
Fig. 2.
Comparison of type I error rate and power between famLBL (using trio data) and LBL (using case-control data) in the presence of population stratification. Type I error for non-causal haplotypes is plotted on the left, and power for causal haplotypes is plotted on the right; ‘x’: LBL, ‘o’: famLBL

