

Abstract
Myopericytoma (MPC) is a rare tumor with perivascular proliferation of pluripotent stem-cell–like pericytes. Although indolent, MPC may be locally aggressive with recurrent disease. The pathogenesis and diagnostic biomarkers of MPC are poorly understood. We discovered that 15% of benign MPCs (thyroid, skin; 3 of 20 samples) harbored BRAFWT/V600E; 33.3% (1 of 3 samples) of BRAFWT/V600E-MPCs were multifocal/infiltrative/recurrent. Patient-MPC and primary MPC cells harbored BRAFWT/V600E, were clonal and expressed pericytic-differentiation biomarkers crucial for its microenvironment. BRAFWT/V600E-positive thyroid MPC primary cells triggered in vitro (8.8-fold increase) and in vivo (3.6-fold increase) angiogenesis. Anti-BRAFV600E therapy with vemurafenib disrupted angiogenic and metabolic properties (~3-fold decrease) with down-regulation (~2.2-fold decrease) of some extracellular-matrix (ECM) factors and ECM-associated long non-coding RNA (LincRNA) expression, with no effects in BRAFWT-pericytes. Vemurafenib also inhibited (~3-fold decrease) cell viability in vitro and in BRAFWT/V600E-positive thyroid MPC patient-derived xenograft (PDX) mice (n = 5 mice per group). We established the first BRAFWT/V600E-dependent thyroid MPC cell culture. Our findings identify BRAFWT/V600E as a novel genetic aberration in MPC pathogenesis and MPC-associated biomarkers and imply that anti-BRAFV600E agents may be useful adjuvant therapy in BRAFWT/V600E-MPC patients. Patients with BRAFWT/V600E-MPC should be closely followed because of the risk for multifocality/recurrence.
Myopericytoma (MPC) describes rare, nodular tumors characterized by a radial and multilayered perivascular growth of ovoid and spindled-shaped cells with mesenchymal stem-cell–like features, often with associated blood vessels arranged in an irregular, “staghorn” pattern (1–3). Most MPCs are benign (2), but some are malignant with metastatic potential and poor survival (4,5). MPCs arise over a wide age range, primarily affecting subcutaneous tissues of the distal extremities (2), and lesions occasionally present with skin ulceration, pain or tenderness; additionally, symptomatic MPCs arise in the proximal extremities, head region and internal organs (1). Most MPC are treated surgically, and complete excision should prevent recurrent/persistent disease, although negative surgical margins are difficult to achieve outside of the extremities (2).
Biomarkers and oncogenic events driving MPC development are not well understood. In this study, we performed a comprehensive genomic and functional validation of associated MPC biomarkers with clinical implications. We have applied a high-throughput genotyping assay on 29 MPCs from available, formalin-fixed paraffin-embedded (FFPE), discarded/unidentified samples, using an Institutional Review Board-approved protocol (Beth Israel Deaconess Medical Center, Boston, MA) to unravel oncogenic events driving pathogenesis (Supplementary Methods and Supplementary Table 1, available online). The patient with thyroid MPC provided written informed consent for genetic analysis. For all other patients, we used discarded/unidentified tissue specimens and consent for genotyping test. Disease stage was assessed by radiologic imaging. We also used and immunohistochemistry, primary cell cultures, dynamic functional assays, shRNA, and developed an MPC-patient-derived xenograft (PDX) mouse model (for detailed methods, please see the Supplementary Methods, available online). All animal work was done in accordance with federal, local, and institutional guidelines at the Beth Israel Deaconess Medical Center (Boston, MA), and all experiments were performed with four-month-old Crl:NU(NCr)-Foxn1nu female, athymic, immunodeficient, nude mice (strain code: 490) (Charles River, Wilmington, MA) (n = 5 per group).
Statistical analysis was carried out using GraphPad Prism 6 software (version Prism 6, GraphPad Software Inc., San Diego, CA). Mann-Whitney test was used to analyze the statistical significance of differences between two groups. For categorical data, Fisher’s exact test was used. All reported P values were two sided. Data are reported as the averaged value, and error bars represent the standard deviation of the average for each group in duplicate or triplicate. Results with P values below .05 were considered statistically significant.
We developed the first translational model to date of multifocal and infiltrative thyroid MPC (Figure 1; Supplementary Figures 1 and 2, available online). The initial pathologic diagnosis in October 2010, reported by the referring international institution, was undifferentiated (anaplastic) thyroid carcinoma with two consequent cycles of chemotherapy given to the patient. By patient request, outside review of the pathology was performed at the Massachusetts General Hospital (Boston) the following month, and the diagnosis was amended to reflect a multifocal and infiltrative left thyroid MPC (Figure 1; Supplementary Figures 1 and 2, available online), with no clinically suspicious lymph nodes or distant metastases. Completion thyroidectomy was performed in June 2011 (Supplementary Figure 1F, available online). Histologic evaluation confirmed residual thyroid MPC (Supplementary Figure 1, A-D, available online).
Figure 1.

A multimodality perioperative evaluation of patient with multifocal infiltrating thyroid myopericytoma harboring the heterozygous BRAFWT/V600E mutation. A1) Multinodular thyroid disease, 1.5mm follicular variant papillary thyroid microcarcinoma (PTCFV) in the left thyroid lobe and a left thyroid mass (myopericytoma [MPC]) with mediastinal extension in a 44-year old woman. A2) Neck Doppler ultrasound shows a 4.0×3.4cm irregular, hypo-echoic, hyper-vascular mass in the left thyroid lobe with mediastinal extension. A3) Contrast enhanced T1-weighted magnetic resonance imaging before thyroid surgery shows a four-cm, hyper-intense mass (arrowhead) localized in the left thyroid lobe with mediastinal extension, impingement, rightward tracheal (asterisk) deviation and possible extension into soft tissue (arrow highlights a right thyroid nodule). A4) Total body 18F-FDG (fluorodeoxyglucose) PET (Positron emission tomography)/CT (Computed Tomography) exam reveals high 18F-FDG uptake in the left persistent/recurrent mass (arrow). A5) Elastography analysis shows a non-deformable pattern (the arrow highlights a reduction of the elasticity, blue color) in the vast majority part of the left persistent/recurrent MPC. B1-B7) Histology of the thyroid and perithyroidal soft tissue with multifocal and infiltrating thyroid MPC (hematoxylin and eosin staining). (B1, scale bar = 500µ) Macrofollicular thyroid tissue. (B2-B3, scale bar = 200µ) The thyroid MPC is present in several foci (asterisk) in the thyroid gland (B2-B3, arrowhead highlights thyroid follicles). (B4, scale bar = 500µ) The MPC cells with apparent differentiation toward perivascular myoid cells and pericytes, best appreciated under oil immersion lens, show a bland, ovoid, and epithelioid to spindled morphology. (B5, scale bar = 200µ) MPC shows a somewhat infiltrative appearance through adipose tissue (arrowheads) with: (B6, scale bar = 100µ) radial and multilayered perivascular growth with a staghorn-like vascular growth pattern; and (B7, scale bar = 500µ) destruction of thyroid tissue. (C1-C7, scale bar = 100µ) Immunohistochemistry staining in the thyroid MPC: C1) the Ki67 proliferation index (arrows highlight nuclear staining) is low in the MPC cells. C2) The MPC cells are clustered with a fascicular growth pattern around the vessels (clear, slit-like spaces, V) with intralesional, thin-walled branching vessels of small caliber, highlighted by CD31 (C2). C3-C4) MPC cells show cytoplasmic to membranous staining with antibodies against α-smooth muscle actin (αSMA) and platelet-derived growth factor receptor beta (PDGFRB). C5) MPC cells also show positivity (punctate) for NG2 (chondroitin sulfate proteoglycan 4) but are negative for desmin (C6). C7) Trichrome staining highlights the abundant amount of collagen deposition (blue staining, asterisk) surrounding the MPC (purple staining) or the intratumoral deposition of collagen (arrows). D1-D2) DNA genotyping analysis by mass spectrometry (MS) traces of formalin-fixed paraffin embedded thyroid (n = 1) (D1) and (D2) skin (eg, leg) (n = 28) MPC tissue samples reveals a heterozygous BRAFWT/V600E allele (long arrows) (A > T). The intensity of the signal vs mass of the analyte is plotted in the background, while the inset shows the cluster plot with all samples analyzed in the run (intensity of the signals of the two alleles). The long arrow links the actual sample (circle in the inset) to the mass of the expected mutant V600E allele. Color coded by the software is automatic allele calls. Cyan squares for heterozygous samples, orange triangles for homozygous. Ambiguous calls are identified by a red dot. Allele frequencies deviating from the expected values are assigned ambiguous or homozygous calls by the software.
The MPC was about two-fold more metabolically active (standardized uptake value [SUV] = 4.5) compared with the non-tumoral thyroid hyperplastic nodules (SUV = 2.4) (Figure 1A4); but 18-FDG (Fluorodeoxyglucose) PET (positron emission tomography)/CT (computed tomography) did not note any non-regional tissue involvement (Supplementary Figure 1D, available online). Twelve months post-operatively, imaging revealed persistent disease in the thyroid bed (Figure 1A5; Supplementary Figure 1, G-J, available online). MPC lacked features of malignancy (increased number of mitoses, necrosis, vascular invasion), showed apparent differentiation towards pericyte lineage (Figure 1, B2-B7) and was characterized by perivascular growth (Figure 1, B5 and B6, and 1C2). A higher vascular density (CD31+) was found in the thyroid MPC (mean vessels/field = 20.2, SD = 0.4 vessels/field) compared with the adjacent normal thyroid (mean = 5.2 vessels/field, SD = 0.2, P = .007) (Figure 1C2). MPC cells are arranged circumferentially around smaller vessels (Figure 1, B5 and B6, and 1C2; Supplementary Figure 2B5, available online). The ratio of MPC cells to endothelial cells is about 3:1, quantified based on the number of platelet-derived growth factor receptor beta (PDGFRB)–positive MPC cells and CD31-positive endothelial cells (Supplementary Methods, available online). MPC biomarkers (alpha-smooth muscle actin [αSMA], PDGFRB, NG2 [neuron-glial antigen 2], and extracellular-matrix [ECM] molecules, eg, CollagenIA1 [COLIA1]), as well as desmin and p16/Ink4A immunoexpression are described in Figure 1, C3-C7; Supplementary Figure 2, B1-B19, and Supplementary Table 2, available online.
As MPC is a poorly characterized “orphan” disease, we performed in-depth genotyping. We analyzed 29 FFPE tissues (20 benign MPC, four benign intravascular MPC, and five malignant MPC) (Supplementary Table 1, available online) by Mass Spectrometry genomic technology, which interrogates about 1000 mutations in 112 validated oncogenes and tumor suppressors. Results were validated by performing Sequenom (6) (Figure 1, D1-D2; and Supplementary Figure 2, C1-C4, available online), pyrosequencing and Sanger sequencing (data not shown). We found that 3/20 (15%) benign MPCs (ie, one thyroid and two cutaneous MPCs) from three different patients (Figure 1, D1-D2; Supplementary Figure 2, C1-C4, and Supplementary Table 1, available online) harbored the heterozygous BRAFWT/V600E mutation in exon-15 hot-spot T1799A of the BRAF gene sequence. None of the four benign intravascular MPCs or five malignant MPCs harbored BRAFWT/V600E. Two out of three (66.6%) BRAFWT/V600E-MPCs (thyroid, skin) derived from two different patients’ infiltrated adjacent soft tissue; two of four (50%) multifocal MPCs harbored BRAFWT/V600E, compared with 1/25 (4%) unifocal MPCs with wild type (WT) BRAF (P = .04) (Supplementary Table 1, available online). One out of three (33.3%) MPCs (ie, thyroid) with BRAFW/V600E showed recurrent/persistent disease after one year of follow-up (Figure 1A5;Supplementary Figure 1, G-J, available online). Furthermore, our analysis of X-chromosome inactivation and methylation profile from the female patient with thyroid BRAFW/V600E-MPC (Figure 1D1 and Figure 2, A1 and A2) revealed that this tumor was monoclonal compared to the adjacent, uninvolved thyroid tissue (Figure 2A3) (7).
Figure 2.
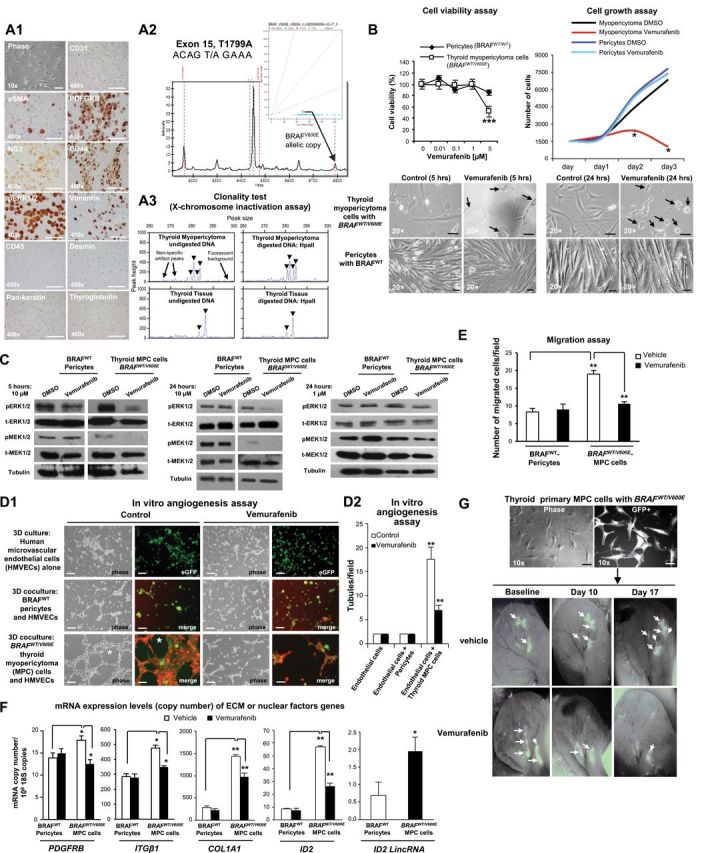
In vitro and in vivo preclinical model of human primary thyroid myopericytoma harboring the heterozygous BRAFWT/V600E mutation. A1) Immunocytochemistry of established non-immortalized primary human thyroid myopericytoma (MPC) cells with the heterozygous BRAFWT/V600E mutation. Phase image of MPC cells, scale bar = 100µ. Immunohistochemistry staining (scale bar = 400µ) in the thyroid MPC cells show cytoplasmic to membranous staining with antibodies against α-smooth muscle actin (αSMA), platelet-derived growth factor receptor beta (PDGFRB), and CD44 (stem cell and cell adhesion marker). Thyroid MPC cells also show positivity for NG2 (chondroitin sulfate proteoglycan 4), phospho(p)-ERK1/2, and vimentin. CD31, CD45, pan-keratin, desmin, and thyroglobulin (Tg) immunostains are negative. A2) DNA genotyping analysis by mass spectrometry (MS) traces of the human primary thyroid MPC cells (n = 1) reveals a heterozygous BRAFWT/V600E allele (long arrows) (A > T). The intensity of the signal vs mass of the analyte is plotted in the background, while the inset shows the cluster plot with all samples analyzed in the run (intensity of the signals of the two alleles). The long arrow links the actual sample (circle in the inset) to the mass of the expected mutant V600E allele. Color coded by the software is automatic allele calls. Cyan squares for heterozygous samples, orange triangles for homozygous. Ambiguous calls are identified by a red dot. Allele frequencies deviating from the expected values are assigned ambiguous or homozygous calls by the software. These findings were validated by two independent experiments. A3) Methylation-sensitive PCR analysis of the X-chromosome locus was assessed on DNA isolated from manually dissected female thyroid MPC (n = 1) or non-malignant adjacent thyroid tissue (n = 1) formalin fixed paraffin embedded specimen. Screenshot of electropherogram displaying discordant patterns of X-chromosome inactivation (arrowheads) in the thyroid MPC vs the benign thyroid tissue. For each sample, the corresponding plot is a quantitative representation of the size and amount of fluorescent PCR products amplified from undigested DNA or digested DNA with the methylation-sensitive enzyme HpaII when analyzed on an automated DNA sequencer. The peaks indicate the estimated allele size (in base pairs) that is the corresponding peak height (amount of PCR product), as quantified by DNA Genotyper software. These findings were validated by triplicate sample assays. B) Thyroid MPC cells with heterozygous BRAFWT/V600E or normal pericytes with BRAFWild Type(WT) were treated with the indicated concentrations of vemurafenib for 48 hours, and viability was determined using the Cell Titer-Glo ATP-based luminescence assay, with Dimethyl sulfoxide, control (DMSO)–treated cells as the control. Cell growth curves were determined following two to three days of treatment with DMSO or vemurafenib. Arrows highlight change of cell shape in MPC cells vs control. All scale bars are =10µ (MPC cells images) and 50µ (pericytes images). These data represent the average ± standard deviation (error bars) of eight independent replicate measurements (*P < .05, **P < .01, ***P < .001, Mann-Whitney test, two-sided). C) A parallel plate similar to (B) was set up and corresponding phospho(p)ERK1/2 and pMEK1/2 protein levels measured from BRAFWT/V600E-MPC cells or BRAFWT pericytes protein samples using western blotting assays. These data are representative of three independent experiments. D1-D2) BRAFWT/V600E-thyroid MPC cells cocultured with human microvascular endothelial cells (HMVECs) induce tubule formation (asterisk, control) (magnifications in all images: 20×; scale bars = 200µ) on growth factors reduced Matrigel in the presence of very low serum concentration (0.2%) within six hours compared to cocultures of HMVECs and BRAFWT pericytes or HMVECs alone, in the presence of vehicle (control) or vemurafenib treatment. Phase-contrast images were captured by optical microscopy. GFP (green fluorescent protein) and merge images were captured on a different microscopy field by confocal microscopy analysis: HMVECs alone are stained with ICAM-1 (human intercellular adhesion molecule) (green); merge= GFP-tagged MPC cells or Alexa Fluo 488-conjugated CD90 (green)–tagged pericytes, and Alexa Fluo 594-conjugated actin (red)–tagged HMVECs. These data represent the average ± standard deviation (error bars) of six independent replicate measurements (**P = .002, Mann-Whitney test, two-sided).
E) Cell migration assays within five hours in human primary thyroid MPC cells with BRAFWT/V600E or in pericytes with BRAFWT in the presence of vehicle (control) or vemurafenib treatment. These data represent the average ± standard deviation (error bars) of six independent replicate measurements (**P = .002, Mann-Whitney test, two-sided). F) Quantitation of mRNA expression levels (copy number) by multi-gene transcriptional real-time reverse transcriptase PCR (RT-PCR) analysis of genes fundamental for extracellular matrix (ECM) remodeling and angiogenesis in human primary thyroid MPC cells with BRAFWT/V600E or in pericytes with BRAFWT in the presence of vehicle (control) or vemurafenib treatment for 24 hours (0.2% serum cell growth medium). Gene expression was classified as “low copy number” if it was below 1 mRNA copy/106 18S copies, “moderate copy number” if it was between 1 and 15 mRNA copies/106 18S copies, and “high copy number” if it was greater than 15 mRNA copies/106 18S copies. These data represent the average ± standard deviation (error bars) of four to six independent replicate measurements (*P < .05; **P < .01: ***P < .001, Mann-Whitney test, two-sided). Genes showing difference in values of comparisons (P values <.05) were considered differentially expressed and statistically significant. G) A patient-derived xenograft (PDX) mouse model of BRAFWT/V600E-human primary thyroid MPC cells engineered to express GFP (green fluorescent protein, scale bar=100µ) injected in the subcutaneous compartment of the left ear of nude mice (n = 10) to visually follow perivascular growth of MPC cells over time in vivo. Mice were treated starting four days after BRAFWT/V600E-MPC cells implantation (defined ‘baseline’) with vemurafenib (100mg/kg twice daily by oral gavage) (n = 5) or vehicle (n = 5) for two consecutive weeks. MPC cell viability was determined by the CS5.1 histogram software calculating the absolute number of pixels in the GFP-positive areas (arrows) of the left ear divided by the total number of pixels (247,545) in the highlighted selection area. These data represent the average ± standard deviation of two independent experiments (control-treated mice vs vemurafenib-treated mice, P = .007, Mann-Whitney test).
To provide a translational application for our study, we established early and late passages of primary cells cultured in vitro from human thyroid BRAFWT/V600E-MPC. These cells also harbored BRAFWT/V600E and expressed pericyte lineage-specific differentiation biomarkers (Figure 2A1). BRAFWT/V600E is the most frequently mutated oncogenic kinase. Vemurafenib is the first orally available selective inhibitor of BRAFV600E approved by the US Food and Drug Administration for the treatment of BRAFWT/V600E-melanoma (8–11). We tested the effects of vemurafenib on BRAFWT/V600E- MPC cells and BRAFWT pericytes (Figure 2, A-G). Vemurafenib substantially reduced phospho(p)ERK1/2 and pMEK1/2 protein levels in BRAFWT/V600E-MPC cells as compared with controls (Figure 2C). As a result, this treatment statistically significantly (P < .001) suppressed BRAFWT/V600E-MPC cell viability, with no effect on the growth of BRAFWT-pericytes (Figure 2B), suggesting its high specificity for the BRAFV600E vs BRAFWT. Furthermore, we hypothesized that BRAFWT/V600E plays a role in MPC angiogenic and metabolic properties; we found that BRAFWT/V600E-MPC cells substantially grew as large cell aggregates on Matrigel (Supplementary Figure 3A, available online), and, when cocultured with human microvascular endothelial cells, stastistically significantly (8.8-fold, P = .002) triggered in vitro angiogenesis as compared with controls (Figure 2, D1-D2). Vemurafenib treatment statistically significantly (about 3-fold, P = .002) disrupted this effect (Figure 2, D1 and D2); additionally, treatment with shRNA that targeted BRAFV600E statistically significantly reduced MPC cell adhesion and migration (Supplementary Figure 4C, available online) with no effect in BRAFWT-pericytes (data not shown). Remarkably, BRAFWT/V600E-MPC cells also statistically significantly (P = .002) increased vascular density in MPC-PDX mice (Supplementary Figure 5, available online), and vemurafenib therapy statistically significantly (3-fold, P = .007) suppressed both BRAFWT/V600E-MPC cell viability (Figure 2G; Supplementary Figure 5, available online) and vascular density/angiogenesis (3.6-fold, P = .002) (Supplementary Figure 5, available online) without any obvious toxicity. Subsequently, we found that COL1A1 (5-fold, P = .007), PDGFRB (1.3-fold increase, P = .02), integrin-β1 (ITGβ1) (1.7-fold increase, P = .02), ID2 (DNA-binding protein inhibitor) (6.5-fold increase, P = .002), and the long intergenic non-coding RNA (LincRNA) ID2 (2.8-fold increase, P = .02) were statistically significantly (with moderate or high copy number) BRAFV600E-dependent in MPC cells as compared with control cells with BRAFWT (Figure 2F; Supplementary Table 3, available online). Their expression levels (ID2 = 2.2-fold; COL1A1 = 1.5-fold; PDGFRB = 1.5-fold; ITGβ1 = 1.5-fold; and ID2 LincRNA = 1.6) were statistically significantly reduced by vemurafenib treatment as compared with BRAFWT-pericytes (Figure 2F). Furthermore, MPC cell adhesion (P = .002, Supplementary Figure 3B, available online) and migration (P = .002, Figure 2E) were also statistically significantly reduced by vemurafenib treatment compared with BRAFWT-pericytes. MPCs continue to be under recognized, resulting in inappropriate treatment and patient anxiety (12). Benign MPCs are generally indolent tumors (1); however, when they involve internal organs, they may be locally aggressive, with recurrent/persistent disease because of difficulty of complete excision. We discovered that BRAFV600E is a distinct genetic alteration seen in benign MPCs, often multifocal and infiltrative. Patients with multifocal MPCs present a treatment dilemma, often requiring multiple surgeries for lesions that may be quite painful, even if not malignant. BRAFV600E is a prognostic biomarker of tumor recurrence and aggressiveness (13–24) and also facilitates tumorigenesis (25–29).
BRAFWT/V600E-induced MPC cell adhesion, migration, and angiogenesis associated with upregulation of molecules (eg, COL1A1, PDGFRB, ID2) (30–33) crucial for ECM remodeling, angiogenesis, and for autocrine and paracrine communication in the tumor microenvironment (Supplementary Figure 6, available online), which ultimately may lead to MPC aggressiveness. High doses of vemurafenib therapy were effective to inhibit BRAFV600E-MPC cell viability and angiogenesis, suggesting that this therapy blocked BRAFV600E-dependent pro-migratory pathways and so diminished pro-angiogenic capabilities of MPC cells.
Please see the Supplementary Results (available online) for additional findings that may be of interest.
Collectively, using anti-BRAFV600E therapy as a surgical adjuvant may provide a novel advancement in the therapeutic strategy and treatment of locally aggressive multifocal BRAFV600E-positive MPCs or possibly serve as a therapeutic alternative for cases in which surgical options are limited by location and extent of disease, or in medically poor surgical candidates.
Our study is limited by sample size (29 available MPCs), precluding optimal evaluation of MPC pathological features with/without BRAFV600E. However, our results were substantiated by our integrated in vitro and in vivo approaches. It is also possible that MPC heterogeneity reduced the sensitivity for detection of the BRAFV600E mutation in some cases; therefore, we cannot exclude the possibility that the percentage of BRAFV600E-positive MPC cases is higher.
In conclusion, our results demonstrate a subset of MPC harbor BRAFV600E that drives tumor development. We report the first MPC arising in the thyroid. Anti-BRAFV600E therapy effectively suppresses viability in the only currently available MPC short-term cell culture that harbors the BRAFV600E mutation. BRAFV600E plays a role in the MPC microenvironment (Supplementary Figure 6, available online) and might ultimately lead to aggressive behavior. Finally, we report a multiplex panel of diagnostic markers for MPCs (eg, PDGFRB, NG2, αSMA, peritumoral-fibronectin, vimentin, CollagenIA1).
We propose that genetic testing for the BRAFWT/V600E-mutation is part of the pathologic evaluation for multifocal and infiltrative MPCs, and patients with BRAFWT/V600E- positive MPCs should be periodically re-evaluated for recurrence, especially with available targeted drug therapies.
Funding
Carmelo Nucera (Principal Investigator, Human Thyroid Cancers Preclinical and Translational Research at the Beth Israel Deaconess Medical Center/Harvard Medical School) was awarded grants by the National Cancer Institute/National Institutes of Health (1R21CA165039-01A1 and 1R01CA181183-01A1) the American Thyroid Association (ATA), and ThyCa:Thyroid Cancer Survivors Association Inc. for Thyroid Cancer Research. Carmelo Nucera was also recipient of the Guido Berlucchi “Young Investigator” research award 2013 (Brescia, Italy). Beth Israel Deaconess Medical Center was recipient of a research grant by Roche (2011). CP was awarded a grant by the Tuberous Sclerosis Complex Research Program (TSCRP) of the USA Department of Defense (DOD) (W81XWH-13-1-0262).
Supplementary Material
The study funders had no role in the design of the study, the collection, analysis, or interpretation of the data, the writing of the manuscript, nor the decision to submit the manuscript for publication.
We thank Drs. Yutaka Kawakami (Keio University, Tokyo, Japan) for providing HIV-U6 vectors. We also thank Drs. Shiva Gautam (statistical consultant), Alexander Gimelbrant, Janice Nagy, Gideon Bollag, Riccardo Taulli and Francesca Ianni, as well as Mrs. Sudeepa Syamala, Mrs. Mei Zheng, Miss Nina Hu, Mr. Bhavik Padmani and Neal Smith for technical assistance. We thank Professor William Aird for critical suggestions.
References
- 1. Fletcher CDM, Bridge JA, Hogendoorn P, Mertens F. WHO Classification of Tumours of Soft Tissue and Bone. Fourth Edition. IARC Press, Lyon, France: 2013;5. [Google Scholar]
- 2. Mentzel T, Dei Tos AP, Sapi Z, Kutzner H. Myopericytoma of skin and soft tissues: clinicopathologic and immunohistochemical study of 54 cases. AJSP. 2006;30(1):104–113. [DOI] [PubMed] [Google Scholar]
- 3. Diaz-Flores L, Gutierrez R, Garcia MP, Diaz-Flores L, Jr, Valladares F, Madrid JF. Ultrastructure of myopericytoma: a continuum of transitional phenotypes of myopericytes. Ultrastruct Pathol. 2012;36(3):189–194. [DOI] [PubMed] [Google Scholar]
- 4. Fisher C. Unusual myoid, perivascular, and postradiation lesions, with emphasis on atypical vascular lesion, postradiation cutaneous angiosarcoma, myoepithelial tumors, myopericytoma, and perivascular epithelioid cell tumor. Sem Diagn Pathol. 2013;30(1):73–84. [DOI] [PubMed] [Google Scholar]
- 5. McMenamin ME, Fletcher CD. Malignant myopericytoma: expanding the spectrum of tumours with myopericytic differentiation. Histopathol. 2002;41(5):450–460. [DOI] [PubMed] [Google Scholar]
- 6. Matulonis UA, Hirsch M, Palescandolo E, et al. High throughput interrogation of somatic mutations in high grade serous cancer of the ovary. PloS One. 2011;6(9):e24433. [DOI] [PMC free article] [PubMed] [Google Scholar]
- 7. Allen RC, Zoghbi HY, Moseley AB, Rosenblatt HM, Belmont JW. Methylation of HpaII and HhaI sites near the polymorphic CAG repeat in the human androgen-receptor gene correlates with X chromosome inactivation. AJHG. 1992;51(6):1229–1239. [PMC free article] [PubMed] [Google Scholar]
- 8. Bollag G, Hirth P, Tsai J, et al. Clinical efficacy of a RAF inhibitor needs broad target blockade in BRAF-mutant melanoma. Nature. 2010;467(7315):596–599. [DOI] [PMC free article] [PubMed] [Google Scholar]
- 9. Sosman JA, Kim KB, Schuchter L, et al. Survival in BRAF V600-mutant advanced melanoma treated with vemurafenib. N Engl J Med. 2012;366(8):707–714. [DOI] [PMC free article] [PubMed] [Google Scholar]
- 10. Bollag G, Tsai J, Zhang J, et al. Vemurafenib: the first drug approved for BRAF-mutant cancer. Nat Rev Drug Discov. 2012;11(11):873–886. [DOI] [PubMed] [Google Scholar]
- 11. Sondergaard JN, Nazarian R, Wang Q, et al. Differential sensitivity of melanoma cell lines with BRAFV600E mutation to the specific Raf inhibitor PLX4032. J Transl Med. 2010;8:39. [DOI] [PMC free article] [PubMed] [Google Scholar]
- 12. Dray MS, McCarthy SW, Palmer AA, et al. Myopericytoma: a unifying term for a spectrum of tumours that show overlapping features with myofibroma. A review of 14 cases. J Clin Pathol. 2006;59(1):67–73. [DOI] [PMC free article] [PubMed] [Google Scholar]
- 13. Xing M, Alzahrani AS, Carson KA, et al. Association between BRAF V600E mutation and mortality in patients with papillary thyroid cancer. JAMA. 2013;309(14):1493–1501. [DOI] [PMC free article] [PubMed] [Google Scholar]
- 14. Nucera C, Nehs MA, Nagarkatti SS, et al. Targeting BRAFV600E with PLX4720 displays potent antimigratory and anti-invasive activity in preclinical models of human thyroid cancer. Oncologist. 2011;16(3):296–309. [DOI] [PMC free article] [PubMed] [Google Scholar]
- 15. Nucera C, Porrello A, Antonello ZA, et al. B-Raf(V600E) and thrombospondin-1 promote thyroid cancer progression. Proc Natl Acad Sci USA. 2010;107(23):10649–10654. [DOI] [PMC free article] [PubMed] [Google Scholar]
- 16. Xing M. Molecular pathogenesis and mechanisms of thyroid cancer. Nat Rev. 2013;13(3):184–199. [DOI] [PMC free article] [PubMed] [Google Scholar]
- 17. Montero-Conde C, Ruiz-Llorente S, Dominguez JM, et al. Relief of feedback inhibition of HER3 transcription by RAF and MEK inhibitors attenuates their antitumor effects in BRAF-mutant thyroid carcinomas. Cancer Discov. 2013;3(5):520–533. [DOI] [PMC free article] [PubMed] [Google Scholar]
- 18. Tiacci E, Trifonov V, Schiavoni G, et al. BRAF mutations in hairy-cell leukemia. N Engl J Med. 2011;364(24):2305–2315. [DOI] [PMC free article] [PubMed] [Google Scholar]
- 19. Chakravarty D, Santos E, Ryder M, et al. Small-molecule MAPK inhibitors restore radioiodine incorporation in mouse thyroid cancers with conditional BRAF activation. J Clin Invest. 2011;121(12):4700–4711. [DOI] [PMC free article] [PubMed] [Google Scholar]
- 20. Peyrade F, Re D, Ginet C, et al. Low-dose vemurafenib induces complete remission in a case of hairy-cell leukemia with a V600E mutation. Haematologica. 2013;98(2):e20–22. [DOI] [PMC free article] [PubMed] [Google Scholar]
- 21. Rosove MH, Peddi PF, Glaspy JA. BRAF V600E inhibition in anaplastic thyroid cancer. N Engl J Med. 2013;368(7):684–685. [DOI] [PubMed] [Google Scholar]
- 22. Nehs MA, Nucera C, Nagarkatti SS, et al. Late intervention with anti-BRAF(V600E) therapy induces tumor regression in an orthotopic mouse model of human anaplastic thyroid cancer. Endocrinology. 2012;153(2):985–994. [DOI] [PMC free article] [PubMed] [Google Scholar]
- 23. Nehs MA, Nagarkatti S, Nucera C, Hodin RA, Parangi S. Thyroidectomy with neoadjuvant PLX4720 extends survival and decreases tumor burden in an orthotopic mouse model of anaplastic thyroid cancer. Surgery. 2010;148(6):1154–1162; discussion 62. [DOI] [PMC free article] [PubMed] [Google Scholar]
- 24. Shaik S, Nucera C, Inuzuka H, et al. SCF(beta-TRCP) suppresses angiogenesis and thyroid cancer cell migration by promoting ubiquitination and destruction of VEGF receptor 2. J Exp Med. 2012;209(7):1289–1307. [DOI] [PMC free article] [PubMed] [Google Scholar]
- 25. Choueiri TK, Cheville J, Palescandolo E, et al. BRAF mutations in metanephric adenoma of the kidney. Eur Urol. 2012;62(5):917–922. [DOI] [PMC free article] [PubMed] [Google Scholar]
- 26. Rosty C, Buchanan DD, Walters RJ, et al. Hyperplastic polyp of the duodenum: a report of 9 cases with immunohistochemical and molecular findings. Hum Pathol. 2011;42(12):1953–1959. [DOI] [PubMed] [Google Scholar]
- 27. Michaloglou C, Vredeveld LC, Mooi WJ, Peeper DS. BRAF(E600) in benign and malignant human tumours. Oncogene. 2008;27(7):877–895. [DOI] [PubMed] [Google Scholar]
- 28. Badalian-Very G, Vergilio JA, Degar BA, et al. Recurrent BRAF mutations in Langerhans cell histiocytosis. Blood. 2010;116(11):1919–1923. [DOI] [PMC free article] [PubMed] [Google Scholar]
- 29. Brastianos PK, Taylor-Weiner A, Manley PE, et al. Exome sequencing identifies BRAF mutations in papillary craniopharyngiomas. Nat Genet. 2014;46(2):161–165. [DOI] [PMC free article] [PubMed] [Google Scholar]
- 30. Franco M, Roswall P, Cortez E, Hanahan D, Pietras K. Pericytes promote endothelial cell survival through induction of autocrine VEGF-A signaling and Bcl-w expression. Blood. 2011;118(10):2906–2917. [DOI] [PMC free article] [PubMed] [Google Scholar]
- 31. Jain RK, Booth MF. What brings pericytes to tumor vessels? J Clin Invest. 2003;112(8):1134–1136. [DOI] [PMC free article] [PubMed] [Google Scholar]
- 32. Whelan MC, Senger DR. Collagen I initiates endothelial cell morphogenesis by inducing actin polymerization through suppression of cyclic AMP and protein kinase A. JBC. 2003;278(1):327–334. [DOI] [PubMed] [Google Scholar]
- 33. Lasorella A, Rothschild G, Yokota Y, Russell RG, Iavarone A. Id2 mediates tumor initiation, proliferation, and angiogenesis in Rb mutant mice. MCB. 2005;25(9):3563–3574. [DOI] [PMC free article] [PubMed] [Google Scholar]
Associated Data
This section collects any data citations, data availability statements, or supplementary materials included in this article.