

Abstract
Background
Data from animal and cell-line models suggest that vitamin D metabolism plays an important role in pancreatic tumor behavior. Although vitamin D deficiency has been implicated in numerous cancers, the vitamin D status of patients with advanced pancreatic cancer and the effect of baseline vitamin D levels on survival are unknown.
Methods
Participants in this correlative study (CALGB 151006) were enrolled in CALGB 80303, which was a randomized trial of patients with advanced pancreatic cancer that demonstrated no difference in overall survival (OS) among patients treated with gemcitabine plus placebo vs gemcitabine plus bevacizumab. We measured baseline serum 25-hydroxyvitamin D (25[OH]D) levels and examined associations between baseline 25(OH)D levels and progression-free survival and OS using the Cox rank score test. All statistical tests were two-sided.
Results
Of 256 patients with available serum, the median 25(OH)D level was 21.7ng/mL (range 4 to 77). 44.5% of patients were vitamin D deficient (25[OH]D <20ng/mL), and 32.4% were insufficient (25[OH]D ≥20 and <30ng/mL). 25(OH)D levels were lower in black patients compared with white patients, and patients of other/undisclosed race (10.7 vs 22.4 vs 20.9ng/mL, P < .001). Baseline 25(OH)D levels were not associated with PFS (HR = 1.00, 95% CI = 0.99 to 1.01, P = .60) or OS (HR = 1.00, 95% CI = 0.99 to 1.01, P = .95).
Conclusion
Vitamin D deficiency was highly prevalent among patients with a new diagnosis of advanced pancreatic cancer. Black patients had statistically significantly lower 25(OH)D levels than white patients. In this cohort of patients with advanced pancreatic cancer receiving gemcitabine-based chemotherapy, baseline 25(OH)D levels were not associated with PFS or OS.
The biologically active form of vitamin D, calcitriol (1,25[OH]2D), is a pleiotropic steroid hormone. In addition to its role in calcium homeostasis, it affects proliferation and differentiation of many cell types, including breast, prostate, and colon cancers (1–4). Its effects on pancreatic cancer cells are less well understood, although studies have reported growth arrest in pancreatic cell lines in response to 1,25(OH)2D. In vitro, 1,25(OH)2D analogues inhibit pancreatic cancer cell proliferation, induce differentiation, and promote apoptosis (5–9). In vivo, they inhibit growth of pancreatic tumor xenografts in immunodeficient mice (8,10).
Scientific observations from animal and cell-line models on pancreatic cancer pathogenesis support the hypothesis that vitamin D metabolism is also important in tumor maintenance and may contribute in part to this tumor’s chemoresistance. Specifically, the vitamin D receptor (VDR) is known to mediate the activity of vitamin D and has been identified in pancreatic cancer cells (8,11). In one study of VDR expression in human pancreatic cancer cell lines, it was established that VDR expression was increased more than threefold compared with that in normal pancreatic cells (12). Both normal and malignant pancreatic cells express 1-α-hydroxylase, the enzyme that converts plasma 25(OH)D into its bioactive form 1,25-dihydroxycholecalciferol (1,25[OH]2D) (11,13,14).
Recent data from two genome-wide analysis studies (GWAS) point to the role of the VDR and vitamin D pathway in patients with pancreatic adenocarcinoma. GWAS performed on a cohort of patients enrolled on Cancer and Leukemia Group B (CALGB) 80303 and on patients included in the Pancreatic Cancer Cohort Consortium (PanScan) identified one VDR single-nucleotide polymorphism (SNP) that associates with better overall survival (OS) (15).
To our knowledge, no study has previously investigated whether vitamin D concentration is predictive of survival following a diagnosis with pancreatic cancer. We examined the cohort of participants in CALGB 80303 who had advanced pancreatic cancer and received systemic chemotherapy in the context of this randomized clinical trial. We aimed to describe the prevalence of vitamin D deficiency at baseline and to examine the association of vitamin D status with outcomes.
Method
Study Population
Participants in this correlative study (CALGB 151006) were enrolled in CALGB 80303, which was a national, multi-center, double-blind phase III study that randomly assigned patients (1:1) with advanced pancreatic cancer to gemcitabine plus bevacizumab vs gemcitabine plus placebo. Full details of the trial and results were previously published (16). Eligible patients had unresectable adenocarcinoma of the pancreas and had received no prior therapy for metastatic disease (prior radiation and/or chemotherapy in the adjuvant setting were allowed). A baseline Eastern Cooperative Oncology Group (ECOG) performance status of 0 to 2 and adequate renal, liver, and bone marrow function were required.
Patients signed informed consent for participation in the therapeutic trial and were given the option to sign a secondary consent for a companion study for biomarker research. This correlative study was approved by the UCSF Committee for Human Research (IRB Number 10-04423).
In total, 602 patients were enrolled in CALGB 80303, and 535 were treated. Three hundred and fifty-two patients provided optional consent for collection of blood and urine specimens, of whom 274 had serum available in storage. Figure 1 illustrates the derivation of the final cohort size (n = 256) and reasons for exclusion at various time points. Among the 535 patients treated on study, the median OS was 5.8 months in the gemcitabine plus bevacizumab arm and 5.9 months in the gemcitabine plus placebo arm. With respect to the primary outcome, consented patients with available serum samples were representative of the larger study population with similar median OS (5.9 vs 5.8 months, respectively).
Figure 1.
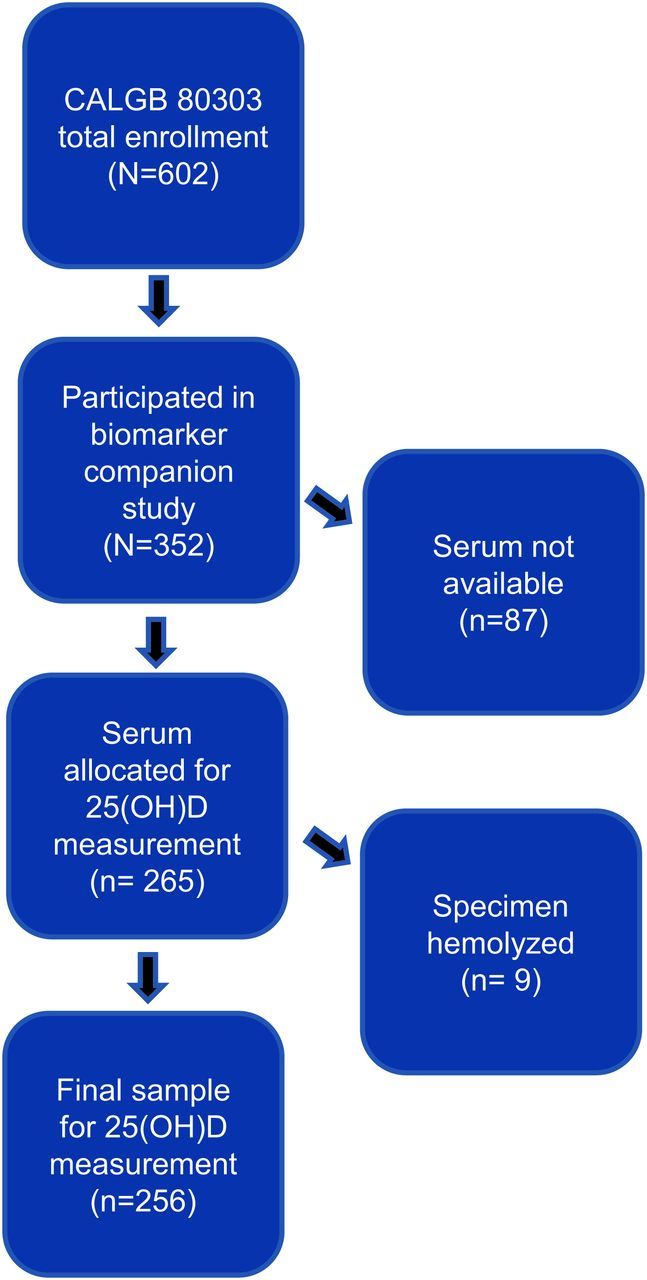
Derivation of cohort size.
Response and Progression Criteria
Study enrollment required documentation of disease extent by CT scan prior to initiation of therapy. Patients were evaluated every eight weeks for response, which was assessed through conventional RECIST criteria. Progression-free survival (PFS) was calculated as time from study enrollment to disease progression or death. OS was calculated as the time from registration to death from any cause.
Serum Biomarker Assessment
Blood samples were collected from consenting participants in CALGB 80303 at the time of study registration at respective institutions and shipped to the CALGB Pathology Coordinating Office for storage (Columbus, OH). For processing of the 25(OH)D assay, 150 microliters of available serum specimens were placed into Sarstedt #72.730 cryovials and shipped on dry ice to Heartland Assays, Inc. (Ames, IA). It has been previously established that 25(OH)D results obtained for patients are unaffected by multiple freeze-thaw cycles (17).
The method for quantitative determination of 25(OH)D was a Food and Drug Administration-approved direct, competitive chemiluminescence immunoassay using the DiaSorin© LIAISON 25-OH Vitamin D Total assay (18,19). This system was selected based upon its high sample throughput and equal recognition of circulating 25(OH)D2 and 25(OH)D3. All values in our data set were above the assay’s minimum detectable concentration of less than 2.5ng/mL (18).
To ensure quality control, 5% of samples were submitted as blinded duplicates to verify reproducibility of assay results (n = 13). All laboratory personnel were blinded to patient identifiers and outcome. The Bland-Altman plot of 13 duplicate specimens is displayed in Supplementary Figure 1 (available online). The intraclass correlation coefficient of the assay was calculated to be 0.97 (95% CI = 0.91 to 0.99).
Statistical Design and Analysis
Descriptive analyses were performed to report the demographic and clinical characteristics. Although there is no consensus regarding optimal physiologic levels, we defined vitamin D levels as they are most commonly reported in the literature: vitamin D deficiency was defined as a serum 25(OH)D level less than 20ng/mL, insufficiency as 20 to 29ng/mL, and sufficiency as 30ng/mL and greater (20). The association between vitamin D levels and patient characteristics was described with medians and ranges and compared using the Wilcoxon rank sum test (21). The cut point for age (<70 and ≥70 years) is an optimized value determined by a recursive partitioning approach (22). The cut point for body-mass index (BMI) (<25 and ≥25kg/m2) was determined by the median value. A strong concordance between genetically estimated ancestry and self-reported race was previously reported in the GWAS of this cohort (23). To address the possibility of reporting bias for the self-reported variable of race, analyses were also performed on the subset of patients with available GWAS data on genetically estimated race.
The primary statistical objective was to investigate the association between 25(OH)D level and OS. The association was tested using the Cox rank score test, using 25(OH)D as a continuous variable (eg, per each incremental increase of 1ng/mL) (24). Serum 25(OH)D levels were defined in four quartiles, with almost equal numbers of patients in each. Chi-square tests were used to compare the impact of demographic and clinical characteristics across quartiles (25). The distributions of OS and PFS were also compared between the subgroups of patients with extreme low 25(OH)D levels (<10ng/mL) and “optimal” levels (≥36ng/mL) (26) using a log rank test (27).
In secondary analyses, tests of interaction between serum 25(OH)D and potential effect modifiers were assessed by entering in the model 25(OH)D as a continuous variable with covariates as either continuous or binary variables. Geographic latitude as determined by home zipcode was tested both as a binary variable and as a continuous variable; the Kendall’s rank correlation test was used to test latitude as a continuous variable (21). Additional exploratory analyses using the Cox proportional hazards model and ensemble methods (eg, random forests) were employed (22,28). Differences in 25(OH)D levels among racial populations were tested using the Kruskal-Wallis test (29). The reported P values and confidence intervals are two sided and not adjusted for multiple testing.
All analyses were performed using R software (version 3.0.1) and extension packages for survival (version 2.37–4), party (version 1.0–8), and zipcode (version 1.0) (22,30–32). The intraclass correlation coefficient of the 25(OH)D assay was calculated using the ICC function of the irr extension package (33). Data collection and statistical analyses were conducted by the Alliance Statistics and Data Center. All analyses were based on the study database frozen on June 9, 2009.
Results
Patient Characteristics
Baseline characteristics of the 256 included patients are displayed in Table 1. The median age at diagnosis was 64 years (range 35 to 84). 29% of participants were 70 years or older, 53% were men, and 88% were self reported as white. GWAS data on genetic race was available for 211 of 256 participants; of these, genetic race was reported as white for 187 (88%), black for 14 (6.6%), and unknown for 10 (4.7%).
Table 1.
Relationship of 25(OH)D levels to selected patient characteristics
| Characteristic | No. patients (%) | Median 25(OH)D, ng/mL (range) | P |
|---|---|---|---|
| Age at diagnosis, y* | |||
| <70 | 182 (71.1) | 21.4 (4.0–50.2) | >.15 |
| ≥70 | 74 (28.9) | 22.4 (5.3–77.0) | |
| Sex | |||
| Female | 120 (46.9) | 20.8 (4–47) | >.07 |
| Male | 136 (53.1) | 22.5 (4–77) | |
| Race | |||
| White | 225 (87.9) | 22.4 (4–77) | <.001 |
| Black | 23 (9.0) | 10.7 (4.0–36.3) | |
| Other/Unknown | 8 (3.1) | 20.9 (12.6–31.8) | |
| BMI, kg/m2† | |||
| <25 | 126 (49.2) | 21.6 (4.0–71.2) | >.47 |
| ≥25 | 130 (50.8) | 22.3 (4.2–77) | |
| ECOG PS | |||
| 0 | |||
| 1 | 234 (91.4) | 22.1 (4–77) | >.18 |
| 2 | 22 (8.6) | 18.8 (4–42.4) | |
| Extent of disease | |||
| Locally advanced | 217 (84.8) | 21.3 (4–77) | >.17 |
| Metastatic | 39 (15.2) | 22.6 (9.5–71.2) | |
| Prior radiation | |||
| No | 225 (87.9) | 22 (4–77) | >.12 |
| Yes | 31 (12.1) | 17.1 (7.5–40.8) | |
| Prior chemotherapy | |||
| No | 223 (87.1) | 22 (4–77) | >.16‡ |
| Yes | 28 (10.9) | 16.55 (7.5–40.8) | |
| Unknown | 5 (2.0) | 24.9 (5.9–33.1) | |
| Geographic latitude | |||
| <40° | 119 (46.5) | 21.9 (4–71.2) | >.89‡ |
| ≥40° | 96 (37.5) | 20.7 (4.2–43.3) | |
| Unknown | 41 (16) | 21.3 (9.5–77) | |
* Cut point is an optimized values decided by using recursive partitioning approach. 25(OH)D = 25-hydroxyvitamin D3; BMI=Body-mass index; ECOG PS = Eastern Cooperative Oncology Group Performance Status.
† Body-mass index is calculated as weight (kilograms) divided by height (meters) squared. Values reflect patient status at time of initiation of chemotherapy (clinical trial enrollment). Cut point is the median value.
‡ Comparison did not include the Unknown group.
Distribution of 25(OH)D Levels
The median serum 25(OH)D level for the entire cohort was 21.7ng/mL (range 4 to 77). At time of specimen collection prior to initiation of chemotherapy, 44.5% of patients were vitamin D deficient (25[OH]D <20ng/mL), and 32.4% were insufficient (25[OH]D ≥20 and <30ng/mL). Only 23% of patients had serum 25(OH)D levels above the threshold for vitamin D sufficiency (≥30ng/mL). Figure 2 summarizes the distribution of serum 25(OH)D levels.
Figure 2.

Distribution of serum 25(OH)D levels in the study cohort (n = 256).
Association of 25(OH)D Levels With Patient Characteristics
Among 256 patients with available serum, 25(OH)D levels were lower in patients self-reported as black (median 10.7ng/mL) compared with white patients (median 22.4ng/mL) and patients of other or undisclosed race (median 20.9ng/mL) (P < .001). Vitamin D deficiency was more common among self-reported black patients (82.6%) compared with white patients (40.9%) and those of other or undisclosed race (37.5%). Moreover, only 4.3% of blacks, 25.3% of whites, and 12.5% of patients of other or undisclosed race demonstrated serum 25(OH)D levels in a sufficient range. Boxplots of 25(OH)D measurements according to race are shown in Figure 3. Among the 211 patients for whom both serum and GWAS data on race were available, 25(OH)D levels according to genetic race were comparable to those for self-reported race. 25(OH)D levels were statistically significantly lower in genetically black patients (median 10.1ng/mL) than in genetically white patients (median 22.4ng/mL) (P < .001).
Figure 3.
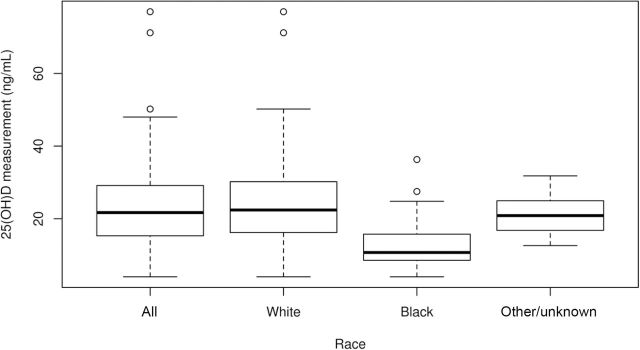
Boxplots of 25(OH)D measurements, according to race. Solid horizontal lines represent medians and whiskers represent the ranges.
As shown in Table 1, baseline serum 25(OH)D concentration was not statistically significantly associated with patient age, sex, BMI, ECOG performance status, extent of disease, prior radiation, prior chemotherapy, or geographic latitude (as a binary variable). When tested as a continuous variable, geographic latitude was still not associated with 25(OH)D levels (P = .95).
In a secondary analysis, patients were grouped into four quartiles of 63 to 65 patients apiece, according to escalating serum 25(OH)D levels (Quartile 1: 25(OH)D <15.3; Quartile 2: 25(OH)D ≥15.3 and <21.7ng/mL; Quartile 3: 25(OH)D ≥21.7 and <29ng/mL; Quartile 4: 25(OH)D ≥29ng/mL). Groupings were not entirely equal because of ties in 25(OH)D levels at cut points. We further examined the association of four quartiles of 25(OH)D levels with potential covariables (Table 2). Again, there was no interaction with any covariable except race. This finding was reproduced using GWAS data on genetic race for 211 patients (P < .001). Of the 23 self-reported black patients included in this study, 16 (70%) were in the lowest quartile of serum 25(OH)D levels and only one (4%) was in the highest quartile. By comparison, the white patients included in this study were uniformly represented in each quartile.
Table 2.
Characteristics of study cohort according to quartile of serum 25(OH)D (n = 256)*
| Characteristic | Serum 25(OH)D | ||||
|---|---|---|---|---|---|
| Quartile 1 | Quartile 2 | Quartile 3 | Quartile 4 | ||
| N = 63 | N = 64 | N = 64 | N = 65 | P | |
| Serum 25(OH)D, ng/mL | |||||
| Mean | 10.6 | 18.0 | 24.8 | 37.8 | <.001 |
| Age at diagnosis, y | |||||
| Mean | 61.8 | 65.4 | 62.9 | 64.6 | .19 |
| BMI, kg/m2 | |||||
| Mean | 26 | 26 | 28 | 26 | .98 |
| Sex, No. | |||||
| Female | 37 | 26 | 30 | 27 | |
| Male | 26 | 38 | 34 | 38 | .15 |
| Race or ethnicity, No. | |||||
| White | 46 | 56 | 60 | 63 | |
| Black | 16 | 4 | 2 | 1 | |
| Other/unknown | 1 | 4 | 2 | 1 | <.001 |
| ECOG PS, No. | |||||
| 0 | |||||
| 1 | 56 | 56 | 62 | 60 | |
| 2 | 7 | 8 | 2 | 5 | .23 |
| Extent of disease, No. | |||||
| Metastatic | 56 | 55 | 54 | 52 | |
| Locally advanced | 7 | 9 | 10 | 13 | .56 |
| Prior radiation, No. | |||||
| No | 55 | 54 | 56 | 60 | |
| Yes | 8 | 10 | 8 | 5 | .58 |
| Prior chemotherapy, No. | |||||
| No | 52 | 56 | 55 | 60 | |
| Yes | 9 | 8 | 7 | 4 | .48† |
| Unknown | 2 | 0 | 2 | 1 | |
| Geographic latitude, No. | |||||
| <40° | 34 | 23 | 32 | 30 | |
| ≥40° | 20 | 29 | 23 | 24 | .26† |
| Unknown | 9 | 12 | 9 | 11 | |
* Body mass index is calculated as weight (kilograms) divided by height (meters) squared. Values reflect patient status at time of initiation of chemotherapy (clinical trial enrollment). Quartile 1: 25(OH)D<15.3ng/mL; Quartile 2: 25(OH)D ≥15.3 and <21.7ng/mL; Quartile 3: 25(OH)D ≥21.7 and <29ng/mL; Quartile 4: 25(OH)D ≥29ng/mL. 25(OH)D = 25-hydroxyvitamin D3; BMI = body mass index; ECOG PS = Eastern Cooperative Oncology Group Performance Status.
† Comparison did not include the Unknown group.
Relationship of Vitamin D Levels on Patient Outcomes
While only 23% of our cohort had sufficient 25(OH)D levels (≥30ng/mL) at study baseline, we still examined the association between baseline levels and patient outcomes, including PFS and OS. At the time of this analysis, 254 of 256 patients were deceased, with an event rate of 97%. The unadjusted HR for PFS was 1.00 (95% CI = 0.99 to 1.01, P = .60). The unadjusted HR for OS was 1.00 (95% CI = 0.99 to 1.01, P = .95). After adjustment for race, baseline 25(OH)D levels were not associated with PFS (HR = 1.00, 95% CI = 0.99 to 1.01, P = .76) or OS (HR = 1.00, 95% CI = 0.99 to 1.01, P = .97). No statistically significant relationships were detected between quartiles of serum 25(OH)D levels and either PFS or OS. Kaplan-Meier curves for PFS and OS, according to quartile, are displayed in Figure 4.
Figure 4.
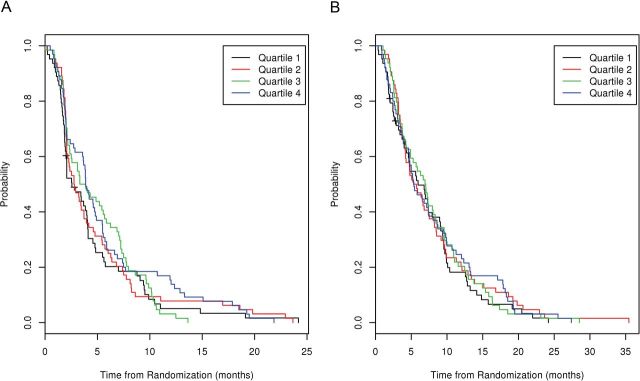
A) Progression-free survival (PFS) by quartile of 25(OH)D. B) Overall survival by quartile of 25(OH)D.
Patients with serum 25(OH)D levels in the highest quartile had a PFS of 3.88 months (95% CI = 3.6 to 5.5 months) and OS of 5.36 months (95% CI = 4.7 to 8.6 months). Patients with serum 25(OH)D levels in the lowest quartile had a PFS of 2.56 months (95% CI = 2.0 to 4.0) and OS of 5.95 months (95% CI = 4.6 to 9.1). Based upon the observation of increasing median PFS across quartiles (2.56, 2.78, 3.60, and 3.88 months in Quartiles 1, 2, 3, and 4, respectively), we performed log rank score tests for trend. A long rank score test of 25(OH)D level as a continuous variable did not demonstrate an association with PFS (P = .60). No association for PFS was seen by testing 25(OH)D levels according to rank or quartiles (P = .38 and P = .19, respectively).
Among the 34 patients with levels of 25(OH)D defined as physiologically “optimal” (≥36ng/mL) (26), the median PFS was 3.84 months (95% CI = 2.0 to 4.9) and median OS was 4.99 months (95% CI = 3.98 to 8.05). Among patients with extreme low levels (<10ng/mL), the median PFS was 1.99 (95% CI = 1.61 to 4.57) and median OS was 4.80 months (95% CI = 3.42 to 9.13). When the subgroups with extreme high or low levels were compared, no statistically significant differences in PFS (P = .48) or OS (P = .79) were seen.
Discussion
This study is the first to characterize the vitamin D status of patients at time of diagnosis with advanced pancreatic cancer and to test the association between 25(OH)D levels and OS. In the cohort of patients we studied, 44.5% were vitamin D deficient (<20ng/mL) and 22.5% were vitamin D insufficient (<30ng/mL). Among patients self-reported as black, serum 25(OH)D levels were statistically significantly lower than in patients self-reported as white. However, low vitamin D levels were not associated with diminished OS or PFS.
The high prevalence of vitamin D insufficiency in our cohort is consistent with reports from cohorts of patients with breast cancer and metastatic colorectal cancer. A recent study of women with stages I-III breast cancer, which included a high proportion of black and Hispanic women, reported that 74% of women were deficient at baseline and also found that supplementation using standard dosing guidelines was inadequate to increase 25(OH)D levels to a normal range (34). In a cohort of 515 patients with metastatic colorectal cancer, 50% were vitamin D deficient, and an additional 32% were insufficient (35). In both of these cohorts, 25(OH)D levels were lower in black patients compared with white patients and patients of other race (34,35).
Low vitamin D levels are not unique to cancer patients, however. Among 14000 individuals who participated in the National Health and Nutrition Examination Survey (NHANES) III between 2001 and 2004, 77% had 25(OH)D levels less than 30ng/mL, with a mean level of 24ng/mL (36). In comparison with the NHANES population, we detected a higher prevalence of extreme low serum 25(OH)D levels (<10ng/mL) in our study cohort (9.1% vs 6%).
The apparent propensity toward extreme deficiency in patients with advanced pancreatic cancer may reflect malabsorption of this fat-soluble vitamin in those with pancreatic exocrine insufficiency. However, vitamin D concentration is primarily dependent on endogenous production by skin following exposure to ultraviolet rays and, to a lesser extent, on dietary consumption of vitamin D (37,38). The greater prevalence of vitamin D deficiency among black patients in our cohort is consistent with other studies (34–36,39) and likely due to reduced vitamin D photosynthesis in pigmented skin because of greater melanin content and increased absorption of UVB radiation (40). Between 2006 and 2010, black Americans had an age-adjusted incidence rate of pancreatic cancer that was 31% higher than in white Americans and an age-adjusted mortality rate that was 27% higher (41). In the NHANES III cohort, non-Hispanic black race was identified as an independent predictor of pancreatic cancer-related mortality (adjusted HR = 2.80, 95% CI = 1.23 to 6.37) (42). A recent review on racial disparities for a variety of cancer types identified pancreatic cancer as one of several cancers where increased risk among blacks was not attributable to socioeconomic status, cancer stage at diagnosis, or treatment (43). Our data do not suggest that racial disparities in survival for patients with advanced pancreatic cancer can be explained by 25(OH)D levels alone.
The published data on the prognostic role of circulating 25(OH)D levels in other cancers are generally sparse and of poor quality. In a systematic review of all published studies evaluating the impact of baseline 25(OH)D on outcome measures in a multitude of diagnoses and disease stages, five of eight demonstrated a statistically significant negative prognostic role for low 25(OH)D levels, and three demonstrated no prognostic role (44). Two studies on early-stage breast cancer produced conflicting results, and two studies on non-small cell lung cancer reported no prognostic role. Studies that demonstrated a prognostic effect of 25(OH)D levels on outcome measures included a study in melanoma and a smaller study in prostate cancer. Two studies in colon cancer reported a prognostic role for 25(OH)D; however, a larger study of 515 clinical trial participants was published following this review that showed no relationship between 25(OH)D levels and patient outcomes (35).
In the current study, we did not detect an association between serum 25(OH)D levels and patient outcome. It is possible that vitamin D may have a limited impact on the natural history of pancreatic cancer given the grim prognosis associated with advanced stage disease. On the other hand, our data may underestimate the actual prevalence of vitamin D insufficiency associated with advanced pancreatic cancer, because CALGB 80303 participants met rigorous eligibility criteria (eg, 90% of subjects had an ECOG performance status of 0 or 1). This suggests that most patients with advanced pancreatic cancer may be vitamin D insufficient, or worse. As opposed to studies emanating from single institutions, this analysis of patients participating in a National Cancer Institute-sponsored trial allowed for assessment of serum 25(OH)D levels in patients living at various latitudes across North America. In addition, the vitamin D assay that was utilized had high precision.
Nonetheless, potential limitations should be addressed. This analysis included a small number of patients who were categorized as having sufficient 25(OH)D levels, which may have prevented a robust examination of association with outcomes. Baseline 25(OH)D levels in cancer patients may not represent true steady state but rather could reflect inadequate nutrition or limited outdoor activity as influenced by morbidity from recent illness and/or burden of cancer (45). Because this study only performed 25(OH)D measurement on specimens obtained prior to the initiation of gemcitabine-based chemotherapy, the impact of chemotherapy on vitamin D status and its possible effect on patient outcomes could not be studied.
In conclusion, we detected a high prevalence of vitamin D insufficiency among patients with advanced pancreatic cancer undergoing gemcitabine-based chemotherapy. We found that vitamin D deficiency was pronounced among black patients and substantiated this finding using GWAS data for race. This observation suggests the possibility of a genetic basis for the variability between 25(OH)D levels and exposure. While the relative rarity of adequate vitamin D levels in this population may preclude detection of an association between higher vitamin D levels and patient outcomes, additional inquiry regarding genetic factors that may predict for benefit from optimized vitamin D status in patients with pancreatic cancer may be considered.
Funding
This work was supported by a 2012 Young Investigator Award from The Conquer Cancer Foundation of the American Society of Clinical Oncology to Dr. Van Loon; the Agency for Healthcare Research and Quality (AHRQ) (grant number K12HS021700) to Dr. Van Loon; and the National Cancer Institute (NCI) at the National Institutes of Health (NIH) (grant number K07CA140390-01) to Dr. Innocenti.
The research for CALGB 80303 (Alliance) was supported, in part, by grants from the National Cancer Institute (CA31946) to the Alliance for Clinical Trials in Oncology (Monica M. Bertagnolli, MD, Chair) and to the Alliance Statistics and Data Center (Daniel J. Sargent, PhD, CA33601). The content of this manuscript is solely the responsibility of the authors and does not necessarily represent the official views of the NCI, AHRQ, or NIH.
Supplementary Material
This work was previously presented in a Poster Discussion Session at the 2013 Annual Meeting of the American Society of Clinical Oncology, Chicago, IL (Abstract 4022).
References
- 1. Jensen SS, Madsen MW, Lukas J, et al. Sensitivity to growth suppression by 1alpha,25-dihydroxyvitamin D(3) among MCF-7 clones correlates with vitamin D receptor protein induction. J Steroid Biochem Mol Biol. 2002;81:123–133. [DOI] [PubMed] [Google Scholar]
- 2. Oades GM, Dredge K, Kirby RS, et al. Vitamin D receptor-dependent antitumour effects of 1,25-dihydroxyvitamin D3 and two synthetic analogues in three in vivo models of prostate cancer. BJU Int. 2002;90:607–616. [DOI] [PubMed] [Google Scholar]
- 3. Colston KW, Hansen CM. Mechanisms implicated in the growth regulatory effects of vitamin D in breast cancer. Endocr Relat Cancer. 2002;9:45–59. [DOI] [PubMed] [Google Scholar]
- 4. Palmer HG, Gonzalez-Sancho JM, Espada J, et al. Vitamin D(3) promotes the differentiation of colon carcinoma cells by the induction of E-cadherin and the inhibition of beta-catenin signaling. J Cell Biol. 2001;154:369–387. [DOI] [PMC free article] [PubMed] [Google Scholar]
- 5. Zugmaier G, Jager R, Grage B, et al. Growth-inhibitory effects of vitamin D analogues and retinoids on human pancreatic cancer cells. Br J Cancer. 1996;73:1341–1346. [DOI] [PMC free article] [PubMed] [Google Scholar]
- 6. Pettersson F, Colston KW, Dalgleish AG. Differential and antagonistic effects of 9-cis-retinoic acid and vitamin D analogues on pancreatic cancer cells in vitro. Br J Cancer. 2000;83:239–245. [DOI] [PMC free article] [PubMed] [Google Scholar]
- 7. Ohlsson B, Albrechtsson E, Axelson J. Vitamins A and D but not E and K decreased the cell number in human pancreatic cancer cell lines. Scand J Gastroenterol. 2004;39:882–885. [DOI] [PubMed] [Google Scholar]
- 8. Colston KW, James SY, Ofori-Kuragu E, et al. Vitamin D receptors and anti-proliferative effects of vitamin D derivatives in human pancreatic carcinoma cells in vivo and in vitro. Br J Cancer. 1997;76:1017–1020. [DOI] [PMC free article] [PubMed] [Google Scholar]
- 9. Mouratidis PX, Dalgleish AG, Colston KW. Investigation of the mechanisms by which EB1089 abrogates apoptosis induced by 9-cis retinoic acid in pancreatic cancer cells. Pancreas. 2006;32:93–100. [DOI] [PubMed] [Google Scholar]
- 10. Kawa S, Yoshizawa K, Tokoo M, et al. Inhibitory effect of 220-oxa-1,25-dihydroxyvitamin D3 on the proliferation of pancreatic cancer cell lines. Gastroenterology. 1996;110:1605–1613. [DOI] [PubMed] [Google Scholar]
- 11. Schwartz GG, Eads D, Rao A, et al. Pancreatic cancer cells express 25-hydroxyvitamin D-1 alpha-hydroxylase and their proliferation is inhibited by the prohormone 25-hydroxyvitamin D3. Carcinogenesis. 2004;25:1015–1026. [DOI] [PubMed] [Google Scholar]
- 12. Albrechtsson E, Jonsson T, Moller S, et al. Vitamin D receptor is expressed in pancreatic cancer cells and a vitamin D3 analogue decreases cell number. Pancreatology. 2003;3:41–46. [DOI] [PubMed] [Google Scholar]
- 13. Bland R, Markovic D, Hills CE, et al. Expression of 25-hydroxyvitamin D3-1alpha-hydroxylase in pancreatic islets. J Steroid Biochem Mol Biol. 2004;89–90: 121–125. [DOI] [PubMed] [Google Scholar]
- 14. Zehnder D, Bland R, Williams MC, et al. Extrarenal expression of 25-hydroxyvitamin d(3)-1 alpha-hydroxylase. J Clin Endocrinol Metab. 2001;86:888–894. [DOI] [PubMed] [Google Scholar]
- 15.Genetic Marker in the Vitamin D Receptor Gene Associated with Increased overall Survival for Pancreatic Cancer Patients. Lake Tahoe, NV: AACR Press Releases; June 19, 2012. [Google Scholar]
- 16. Kindler HL, Niedzwiecki D, Hollis D, et al. Gemcitabine plus bevacizumab compared with gemcitabine plus placebo in patients with advanced pancreatic cancer: Phase III trial of the cancer and leukemia group B (CALGB 80303). J Clin Oncol. 2010;28:3617–3622. [DOI] [PMC free article] [PubMed] [Google Scholar]
- 17. Antoniucci DM, Black DM, Sellmeyer DE. Serum 25-hydroxyvitamin D is unaffected by multiple freeze-thaw cycles. Clin Chem. 2005;51:258–261. [DOI] [PubMed] [Google Scholar]
- 18. Ersfeld DL, Rao DS, Body JJ, et al. Analytical and clinical validation of the 25 OH vitamin D assay for the LIAISON automated analyzer. Clin Biochem. 2004;37:867–874. [DOI] [PubMed] [Google Scholar]
- 19. Wagner D, Hanwell HE, Vieth R. An evaluation of automated methods for measurement of serum 25-hydroxyvitamin D. Clin Biochem. 2009;42:1549–1556. [DOI] [PubMed] [Google Scholar]
- 20. Holick MF. Vitamin D status: Measurement, interpretation, and clinical application. Ann Epidemiol. 2009;19:73–78. [DOI] [PMC free article] [PubMed] [Google Scholar]
- 21. Hollander M, Wolfe DA. Nonparametric Statistical Methods. New York: John Wiley & Sons; 1973. [Google Scholar]
- 22. Hothorn T, Hornik K, Zeileis A. Unbiased recursive partitioning: A conditional inference framework. Journal of Computational and Graphical Statistics. 2006;15:651–674. [Google Scholar]
- 23. Innocenti F, Owzar K, Cox NL, et al. A genome-wide association study of overall survival in pancreatic cancer patients treated with gemcitabine in CALGB 80303. Clin Cancer Res. 2012;18:577–584. [DOI] [PMC free article] [PubMed] [Google Scholar]
- 24. Jung SH, Owzar K, George SL. A multiple testing procedure to associate gene expression levels with survival. Statistics in Medicine. 2005;24:3077. [DOI] [PubMed] [Google Scholar]
- 25. Pearson K. On the criterion that a given system of deviations from the probable in the case of a correlated system of variables is such that it can be reasonably supposed to have arisen from random sampling. Philosophical Magazine Series 5. 1900;50:157–175. [Google Scholar]
- 26. Bischoff-Ferrari HA, Giovannucci E, Willett WC, et al. Estimation of optimal serum concentrations of 25-hydroxyvitamin D for multiple health outcomes. Am J Clin Nutr. 2006;84:18–28. [DOI] [PubMed] [Google Scholar]
- 27. Peto R, Peto J. Asymptotically efficient rank invariant test procedures. Journal of the Royal Statistical Society, Series A. 1972;135(2):185–207. [Google Scholar]
- 28. Cox DR, Oakes D. Analysis of Survival Data. New York, NY: Chapman and Hall; 1984. [Google Scholar]
- 29. Kruskal WH, Wallis WA. Use of ranks in one-criterion variance analysis. Journal of the American Statistical Association. 1952;47:583–621. [Google Scholar]
- 30. R Core Team. R: A Language and Environment for Statistical Computing. Vienna, Austria: R Foundation for Statistical Computing; 2013. [Google Scholar]
- 31. Therneau TM, Grambsch PM. Modeling Survival Data: Extending the Cox Model. New York, New York: Springer-Verlag; 2000. [Google Scholar]
- 32. Breen J. Zipcode: U.S. ZIP Code Database for Geocoding (ed. R package version 1.0) 2012. Available at: http://cran.r-project.org/web/packages/zipcode/index.html. Accessed May 23, 2013.
- 33. Gamer M. Package ‘irr’ (ed. R package version 0.84). 2012. Available at: http://cran.r-project.org/web/packages/irr/irr.pdf. Accessed September 13, 2013.
- 34. Crew KD, Shane E, Cremers S, et al. High prevalence of vitamin D deficiency despite supplementation in premenopausal women with breast cancer undergoing adjuvant chemotherapy. J Clin Oncol. 2009;27:2151–2156. [DOI] [PMC free article] [PubMed] [Google Scholar]
- 35. Ng K, Sargent DJ, Goldberg RM, et al. Vitamin D status in patients with stage IV colorectal cancer: Findings from intergroup trial N9741. J Clin Oncol. 2011;29:1599–1606. [DOI] [PMC free article] [PubMed] [Google Scholar]
- 36. Ginde AA, Liu MC, Camargo CA., Jr Demographic differences and trends of vitamin D insufficiency in the US population, 1988–2004. Arch Intern Med. 2009;169:626–632. [DOI] [PMC free article] [PubMed] [Google Scholar]
- 37. Bikle DD. Vitamin D: Newly discovered actions require reconsideration of physiologic requirements. Trends Endocrinol Metab. 2010;21:375–384. [DOI] [PMC free article] [PubMed] [Google Scholar]
- 38. Grant WB. An estimate of premature cancer mortality in the U.S. due to inadequate doses of solar ultraviolet-B radiation. Cancer. 2002;94:1867–1875. [DOI] [PubMed] [Google Scholar]
- 39. Nesby-O’Dell S, Scanlon KS, Cogswell ME, et al. Hypovitaminosis D prevalence and determinants among african american and white women of reproductive age: Third national health and nutrition examination survey, 1988–1994. Am J Clin Nutr. 2002;76:187–192. [DOI] [PubMed] [Google Scholar]
- 40. Clemens TL, Adams JS, Henderson SL, et al. Increased skin pigment reduces the capacity of skin to synthesise vitamin D3. Lancet. 1982;1:74–76. [DOI] [PubMed] [Google Scholar]
- 41. Howlader N, Noone AM, Krapcho M, et al. (eds). SEER Cancer Statistics Review, 1975–2010. 2013. Bethesda, MD: National Cancer Institute; Available at: http://seer.cancer.gov/csr/1975_2010/. Accessed June 23, 2014. [Google Scholar]
- 42. Jinjuvadia R, Jinjuvadia K, Liangpunsakul S. Racial disparities in gastrointestinal cancers-related mortality in the U.S. population. Dig Dis Sci. 2013;58:236–243. [DOI] [PMC free article] [PubMed] [Google Scholar]
- 43. Grant WB, Peiris AN. Differences in vitamin D status may account for unexplained disparities in cancer survival rates between african and white americans. Dermatoendocrinol. 2012;4:85–94. [DOI] [PMC free article] [PubMed] [Google Scholar]
- 44. Buttigliero C, Monagheddu C, Petroni P, et al. Prognostic role of vitamin d status and efficacy of vitamin D supplementation in cancer patients: A systematic review. Oncologist. 2011;16:1215–1227. [DOI] [PMC free article] [PubMed] [Google Scholar]
- 45. Thomas MK, Lloyd-Jones DM, Thadhani RI, et al. Hypovitaminosis D in medical inpatients. N Engl J Med. 1998;338:777–783. [DOI] [PubMed] [Google Scholar]
Associated Data
This section collects any data citations, data availability statements, or supplementary materials included in this article.