

This prospective cohort study is the first to evaluate the effectiveness of school-located influenza vaccination (SLV) by active surveillance with influenza polymerase chain reaction confirmation. SLV reduced influenza rates in schoolchildren by 31%. Unvaccinated children were indirectly protected when vaccination coverage approached 50%.
Keywords: herd immunity, influenza, influenza vaccine, school-located influenza vaccination
Abstract
Background. School-located influenza vaccination (SLV) programs can efficiently immunize large numbers of school-aged children. We evaluated the impact of SLV on laboratory-confirmed influenza and absenteeism.
Methods. Active surveillance for influenza-like illness (ILI) was conducted on 4455 children in 4 SLV intervention and 4 control elementary schools (grades K–6) matched for sociodemographic characteristics during the 2010–2011 influenza season in Los Angeles County, California. Combined nose/throat swabs were collected from febrile children with ILI at presentation to the school nurse or during absenteeism.
Results. In SLV schools, 26.9%–46.6% of enrolled students received at least 1 dose of either inactivated or live attenuated influenza vaccine compared with 0.8%–4.3% in control schools. Polymerase chain reaction for respiratory viruses (PCR) was performed on 1021 specimens obtained from 898 children. Specimens were positive for influenza in 217 (21.3%), including 2009 H1N1 (30.9%), H3 (9.2%), and B (59.9%). Children attending SLV schools, regardless of vaccination status, were 30.8% (95% confidence interval, 10.1%–46.8%) less likely to acquire influenza compared with children at control schools. Unvaccinated children were indirectly protected in the school with nearly 50% vaccination coverage compared with control schools (influenza rate, 27.1 vs 60.0 per 1000 children; P = .023). Unvaccinated children missed more school days than vaccinated children (4.3 vs 2.8 days per 100 school days; P < .001).
Conclusions. Vaccination of at least a quarter of the school population resulted in decreased influenza rates and improved school attendance. Herd immunity for unvaccinated children may occur in schools with vaccination coverage approaching 50%.
(See the Editorial Commentary by Gaglani on pages 333–5.)
School-aged children are the most important vectors for community-wide transmission of influenza [1, 2]. Children aged 5–18 years experience attack rates of 30%–50%, the highest rates of any age group [2, 3]. They also shed viruses in greater quantities and for longer periods than adults [4]. School-aged children are infected early in the influenza season, and the high intensity of social contact in schools provides a perfect mode to initiate and amplify the spread of influenza in the community [5–7]. Therefore, school-aged children are crucial targets for influenza vaccination [3, 8].
School-located vaccination (SLV) programs can reach more children at lower cost than clinic-based approaches and efficiently reduce the spread of influenza to other school-aged children, family members, and the community [9–11]. Vaccination programs that target school-aged children in the United States and elsewhere have shown reduction in rates of influenza-like illness (ILI) and medically attended acute respiratory illnesses by 6%–14% in vaccinated children and 8%–28% in unvaccinated children and the community [8, 11–14]. These rates are likely underestimated as outcomes were based on ILI-related symptoms without laboratory confirmation of influenza or other viruses. To our knowledge, this study is the first to evaluate the effectiveness of SLV by active surveillance for ILI with polymerase chain reaction (PCR) confirmation for influenza in cohorts of children attending schools with and without SLV programs.
METHODS
School-Located Vaccination Program for Influenza
Eight elementary schools (grades K–6) in 2 noncontiguous Los Angeles County (LAC) school districts were identified and paired based on enrollment size and sociodemographic data assessed from the California Department of Education. These schools serve lower and middle class communities of mostly first- and second-generation immigrants, 70%–90% of whom live in single-family homes. School administrators chose the more socioeconomically disadvantaged school of each pair as the SLV intervention school for the 2010–2011 school year.
Both trivalent (TIV) and live attenuated influenza vaccine (LAIV), as recommended for the 2010–2011 season (A/California/7/2009 [H1N1]-like virus, A/Perth /16/2009 [H3N2]-like virus, B/Brisbane/60/2008-like virus), were offered free-of-charge to all children aged ≥5 years who were attending intervention schools [15]. The vaccine matched 94.0%–99.8% of strains circulating in LAC that season [16, 17]. Vaccines were supplied by the LAC Department of Public Health (LACDPH) or the Vaccines for Children Program. The SLV program preferentially gave LAIV due to ease of nasal administration to children. Permission for vaccination was not specific for vaccine type; TIV was administered if parents requested the injection vaccine or if a child had contraindications to the live vaccine. A packet consisting of a vaccine information statement (VIS), a vaccination and respiratory virus testing consent form, and an influenza information sheet was sent to parents 3 times between September and December. Personal and automated phone calls served to remind parents to turn in consent forms. Parents in control schools received the packet without VIS and vaccination consent forms 3 times.
SLV clinics were held on site at each intervention school between October 2010 and December 2010. School nurses or a nonprofit, hospital-based mobile health nurse administered the vaccines [18]. Vaccination status was recorded in the California Immunization Registry (CAIR) for the Los Angeles-Orange County region. Children were considered “vaccinated” if they received influenza vaccine through the SLV program or if vaccination at a community site was documented in CAIR between August 2010 and May 2011. Sixty-two percent and 45% of providers in the surrounding communities of districts 1 and 2, respectively, used CAIR.
Influenza Surveillance
The period of active surveillance was determined by LACDPH prospective viral surveillance from 9 sentinel sites located throughout LAC [16]. We predetermined that active surveillance for ILI would begin in schools when ≥5% of community specimens tested positive for influenza and end when ≤5% tested positive. ILI was defined as fever (temperature ≥100.4°F) or feverishness and at least 1 of the following: cough, sore throat, runny nose, nasal congestion, headache, earache, wheezing, muscle aches, chills, anorexia, vomiting, or diarrhea [19]. Respiratory specimens were obtained from all children who presented with ILI to the school nurse's office. Absent children were called to determine the reason for absence and a same-day home visit was scheduled to obtain swabs if the child's symptoms met the ILI case definition. Children missed during absence were swabbed upon return to school if they returned within 3 days of fever onset. Specimens were collected and analyzed for each distinct ILI episode, defined as no symptom overlap for ≥7 days. A short parent interview was conducted on the day of specimen collection to assess symptoms, date of onset, household characteristics, and attitude toward influenza vaccination for the following year.
Respiratory Specimen Collection and Laboratory Analysis
A combined nose and throat specimen was collected by trained study personnel using a single flocked swab and placed in RNAlater (Ambion, Austin, TX). Laboratory technicians blinded to the child's vaccination or school intervention status isolated nucleic acid from samples using NucliSENS easyMAG or miniMAG (bioMérieux Corporation, Durham, NC). Multiplex reverse transcription-PCR (RT-PCR; Luminex xTAG respiratory virus panel, Luminex Corporation, Austin, TX) was performed for 12 viruses including influenza A (with subtype H1 and H3), influenza B, respiratory syncytial virus (subgroups A and B), parainfluenza virus (types 1, 2, and 3), rhinovirus, adenovirus, and human metapneumovirus. Specimens positive for influenza A and negative for subtypes H1 and H3 were presumed to be 2009 H1N1 based on the epidemic strains in LAC during the surveillance period [16].
Absenteeism
Each school provided absentee logs. The first 2 months of the school year were used to define the baseline absentee rates. Reason for absence was recorded as illness or nonillness and with or without fever if reported by parents. For school administrative purposes, days of absence did not include the day a child is sent home early from school with illness.
Outcomes
The primary outcome of this study was PCR-confirmed influenza among cohorts of children in intervention schools compared with those in control schools. Secondary outcomes were rates of ILI, symptoms, and school absenteeism. We also assessed indirect protection in unvaccinated cohorts attending intervention schools vs control schools. In a post-hoc analysis, intervention schools were divided into those with approximately 30% vaccination coverage (VC) and those with nearly 50% VC.
Statistical Analysis
For the power analysis, we estimated 35% VC in intervention schools, 5% VC in control schools, 30% ILI attack rate, and 40% influenza PCR positivity based on our 2009–2010 pilot study. Approximately 4100 children would allow detection of ≥30% influenza risk reduction with 80% power and 2-sided alpha significance level of 0.05.
Categorical and continuous variables were compared using Pearson χ2 and independent sample 2-tailed t tests, respectively. Wilcoxon signed-rank test was used to compare nonparametric data. For assessment of clinical effectiveness, point estimates and 95% confidence intervals (CI) for the incidence rate ratios (RRs) were calculated. Effectiveness or reduction in laboratory-confirmed influenza illness was equal to (1 − RR) × 100%. Multiple logistic regression analysis was used to determine risk factors for PCR-confirmed influenza. Statistical analyses were performed using SPSS version 19.0 (IBM Corp., Armonk, NY). All tests were 2-tailed with a significance level of 0.05. Both school districts and the institutional review boards at Children's Hospital Los Angeles and LACDPH approved the study.
RESULTS
Study Participants
Of 4540 children enrolled during the school year, we excluded 75 children not enrolled during the surveillance period and 10 children enrolled in the Head Start Pre-kindergarten Program at 1 school, leaving 4455 children in the final analysis. Children in SLV intervention and control schools had similar characteristics (Table 1). Although socioeconomic disadvantage status was higher in the intervention schools, household characteristics and baseline absenteeism were similar among children who developed ILI symptoms and were tested for influenza.
Table 1.
Demographic Characteristics of Children Attending the Four Intervention and Four Control Schools, Los Angeles County, 2010–2011a
| Characteristic (n = 4455) | Intervention | Control | P Value |
|---|---|---|---|
| Number of students | 2368 | 2087 | … |
| Number of students per school (mean [range]) | 592 (552–662) | 522 (496–559) | NS |
| Class size (median [range]) | 26 (6–38) | 26 (8–38) | NS |
| Grade (range) | K–6 | K–6 | NS |
| Age (ye, mean [range]) | 8.3 (5–13) | 8.2 (5–13) | NS |
| Male (%) | 51.6 | 52.7 | NS |
| Race or ethnic group (%) | NS | ||
| Hispanic | 67.1 | 65.3 | |
| Asian | 27.3 | 26.1 | |
| White | 1.6 | 2.5 | |
| Black | 0.4 | 0.9 | |
| Other/unknown | 3.6 | 5.2 | |
| Socioeconomic disadvantage statusb (%) | 79.4 | 69.2 | <.001 |
| Baseline absenteeism rate (per 100 school days)c | 2.3 | 2.4 | NS |
| Adults in household (median [range])d | 2 (1–7) | 2(1–8) | NS |
| Children in household (median [range])d | 3 (1–12) | 2 (1–9) | NS |
| Bedrooms in house (median [range])d | 3 (1–6) | 3 (1–6) | NS |
| Smokers at home (%)d | 14.9 | 12.4 | NS |
Abbreviation: NS, not significant. P > 0.05.
a Student demographic data including race or ethnic background and socioeconomic disadvantage status were reported by each school.
b Socioeconomically disadvantaged is defined by the California Department of Education as a student who is eligible for the free or reduced-price lunch program or a student neither of whose parents have received a high school diploma.
c Baseline absenteeism rate was calculated based on absent days of all enrolled children during September and October 2010.
d Household characteristics were obtained from parent interviews of 898 children with influenza-like illness symptoms and tested for influenza at least once during the surveillance period.
Influenza Vaccination
The SLV programs vaccinated 774 of 2368 (32.7%) children attending intervention schools (range, 24.7%–45.1%; Figure 1); 131 (16.9%) received TIV and 643 (83.1%) received LAIV. An additional 39 (1.6%) children had documented receipt of influenza vaccine in CAIR. Thus, 813 (34.3%) children (range, 26.9%–46.6%) received influenza vaccine in intervention schools. Age, gender, and race/ethnicity of vaccinated students were similar to the distribution among enrolled students. In control schools, 2.7% (range, 0.8%–4.3%) of children had influenza vaccine documentation in CAIR from a community site.
Figure 1.
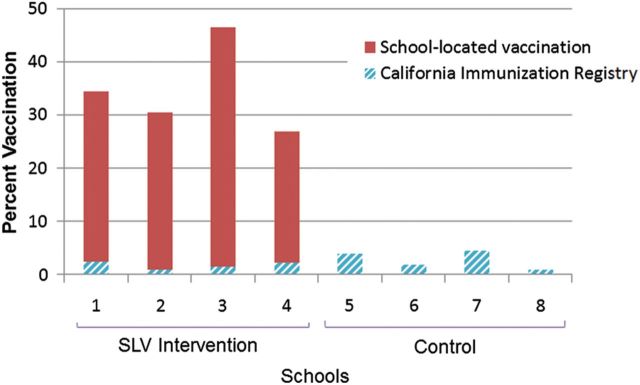
Influenza vaccination coverage in intervention and control schools by school-located vaccination (SLV) and community physicians, as documented in the Los Angeles-Orange County California immunization registry, 2010–2011.
Surveillance and Respiratory Specimen Collection
During active surveillance conducted from 1 January 2011 to 15 April 2011, while influenza activity was present in LAC, 1023 episodes of ILI in 898 children (20.2% of enrolled children) were detected for which respiratory swabs were obtained. One hundred fourteen children experienced 2 episodes, 9 experienced 3 episodes, and 2 had 4 episodes of ILI. Specimens were collected from 927 (47.3%) of 1959 episodes of school absences due to fever during the surveillance period. Swabs were obtained from the same proportion of febrile absent episodes in intervention and control schools (47.3% vs 47.4%; P = .976).
Laboratory-Confirmed Influenza
Of 1023 episodes of ILI, 1021 respiratory specimens were available for PCR testing (Figure 2A and 2B). Of those, 217 (21.3%) were positive for influenza, including 67 (30.9%) influenza A 2009 H1N1, 20 (9.2%) influenza A subtype H3, and 130 (59.9%) influenza B. Most (203, 93.5%) PCR-confirmed influenza cases occurred in unvaccinated children. Age, gender, and race/ethnicity of influenza cases were similar to those of enrolled children.
Figure 2.

A, Respiratory viruses identified by reverse transcription-polymerase chain reaction (RT-PCR) from 343 (33.6%) children with influenza-like illness (ILI) from all study schools, Los Angeles County, 2010–2011. Significantly more influenza viruses were detected compared with other viruses. RT-PCR did not identify a respiratory virus in 678 (66.3%) children with ILI. B, Incidence rates of PCR-confirmed influenza and noninfluenza respiratory viruses in control and intervention schools. Higher rates of influenza were observed in control schools without school-located influenza vaccination (SLV) programs (58.0 vs 40.1 per 1000 children; P = .006), while rates of noninfluenza respiratory viruses remained similar in control and SLV intervention schools (30.8 vs 24.0 per 1000 children; P = .163).
For all enrolled children, attending schools with SLV intervention reduced influenza rates by 30.8% (95% CI, 10.1%–46.8%) compared with control schools (Figures 2B and 3A). Children attending the school with 50% VC, regardless of vaccination status, were 59.4% (95% CI, 28.6%–76.9%) less likely to acquire influenza compared with children in control schools. Influenza rates among unvaccinated children were reduced in the 50% VC school by 54.5% (95% CI, 8.0%–77.5%) compared with the control schools and 51.9% (95% CI, 1.2%–76.6%) compared with the 30% VC schools (Figure 3B). Unvaccinated children attending control schools and 30% VC schools had similar rates of influenza.
Figure 3.
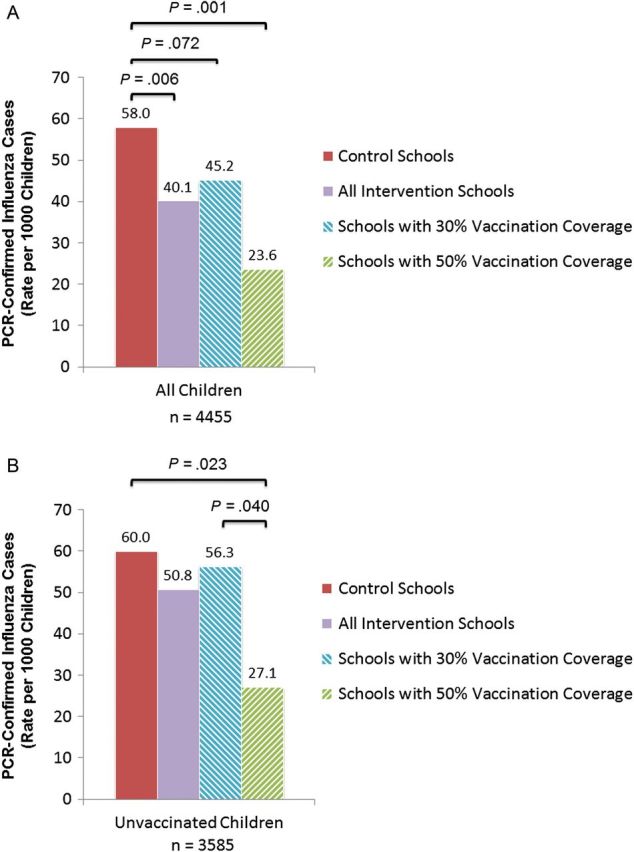
Polymerase chain reaction (PCR)–confirmed influenza rates in control and school-located influenza vaccination intervention schools by vaccination coverage during influenza-like illness surveillance period in all enrolled children, regardless of vaccination status (A) and in all unvaccinated children (B), Los Angeles County, 2010–2011.
Vaccine effectiveness against PCR-proven influenza in any child attending any school in this study was 67.0% (95% CI, 45.4%–80.1%) overall, 66.8% (95% CI, 17.6%–86.6%) for 2009 H1N1, 78.3% (95% CI, −61.7% to 97.1%) for influenza A (H3N2), and 65.7% (95% CI, 34.8%–81.9%) for influenza B. Of 16 vaccinated children who acquired influenza, 8 (50.0%) received TIV, 6 (37.5%) received LAIV, and 2 (12.5%) did not have vaccine type recorded in CAIR; 10 (62.5%) had influenza B, 5 (31.3%) had influenza A H1N1, and 1 (6.3%) had influenza A H3. In a logistic regression model that included vaccination status, school intervention status, age, class size, gender, and ethnicity, only lack of influenza vaccination was a significant predictor of acquiring PCR-positive influenza (RR, 3.12; 95% CI, 1.86–5.21).
Influenza-like Illness
A trend toward higher frequency of ILI was suggested in control schools compared with intervention schools (21.4 vs 19.1%; P = .058; Figure 4). Significantly more ILI occurred in the control schools (21.4%) and schools with 30% VC (20.7%) compared with 50% VC (14.0%; both P < .001). The epidemic curve flattened as VC increased.
Figure 4.
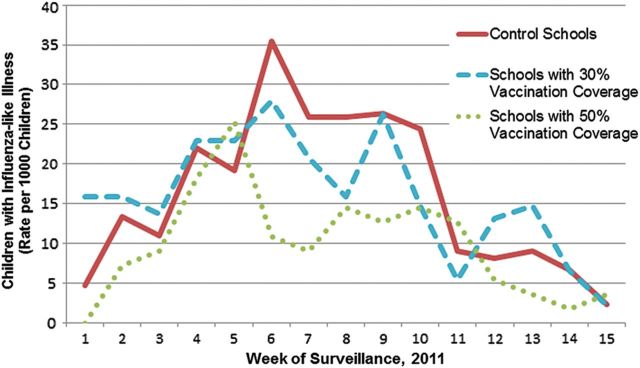
Influenza-like illness during the surveillance period in school-located influenza vaccination intervention and control schools by influenza vaccination coverage rates, Los Angeles County, 2010–2011.
Presenting Symptoms
Supplemental Table 1 shows differences in presenting symptoms in children with and without PCR-confirmed influenza. Children with PCR-confirmed influenza suffered a longer duration of illness compared with those with ILI from other causes (3.3 vs 2.7 days; P < .001). When parents of the children with ILI were asked if they would vaccinate their child at school in the following year, 587/795 (73.8%) would provide consent, 127(16.0%) would not, and 81 (10.2%) did not know.
Absenteeism
A total of 7861 episodes of school absences, including 4974 (63.3%) with known illness and 1959 (24.9%) with parent report of fever, occurred during the 15-week surveillance period. Children missed between 0 and 13 days per absence episode. All-cause absentee rates among all enrolled children were higher in control schools compared with SLV intervention schools (4.2 vs 3.9 days per 100 school days; P = .020). Fewer children in control schools had zero days of absenteeism compared with those in SLV intervention schools (549 [26.3%] vs. 793 [33.5%]; P < .001). Unvaccinated children missed more school days compared with vaccinated children during the surveillance period (4.3 vs 2.8 per 100 school days; P < .001). Children who tested positive for influenza missed more school days per episode compared with those with other causes of ILI (2.3 vs 1.9 days; P < .001).
DISCUSSION
This study is the first to provide laboratory-confirmed validation of the effectiveness of an SLV program. With active ILI surveillance and influenza PCR confirmation, we found that vaccination of at least a quarter of school enrollees lowered the incidence of influenza by more than 30%. Even though disease activity is expected to rise in all schools, SLV programs decreased the height of the number of illnesses, an important goal of public health interventions for easing manageability of the epidemic. The study fills the gap posed by existing studies that only assess ILI as a nonspecific outcome [8, 11–14]. Prevention of influenza illness in children interrupts transmission to household members and the community [5, 11, 13, 20] and is the optimal strategy for minimizing disease burden during influenza season and pandemics [3, 21]. Evidence for direct and indirect protection among schoolchildren conferred by vaccination through SLV programs further validates this strategy.
Vaccination resulted in 67% direct effectiveness against influenza. Our result falls within the range of vaccine effectiveness estimates demonstrated in other studies during the same season [22, 23]. Having the option of both LAIV and TIV is important for SLV programs [9, 24], although several pediatric studies have shown superior efficacy of LAIV compared with TIV [25–29]. Nearly two-thirds of the vaccine failures in this study were due to influenza B. We did not subtype the influenza B strains. Use of the newer quadrivalent vaccines that target 2 B strains may prevent more infections in vaccinated children [30, 31].
Indirect protection also was observed in our study. Vaccination of nearly 50% of a school's enrollees conferred 54% indirect protection to unvaccinated children. This vaccination percentage falls within the estimated crude herd immunity threshold for influenza of 30%–80%, although the threshold is likely to vary greatly between strains [20, 32]. While many SLV programs set a vaccination goal of 50%, this goal is difficult to achieve [9, 24]. Despite substantial efforts to promote our SLV program, we did not reach our desired target of 50% vaccination in all schools. SLV in published studies ranges from 5% to 73% [9]. Even among parents of children with active ILI symptoms in this study, more than a quarter remained undecided or against vaccination. To improve parental consent, additional research is needed in order to determine how to change parental perception about risk and severity of influenza illness vs benefit and risk of vaccination. In addition, full support of the school administration and school nurses along with partnership with local health departments are important for successful programs [9, 18].
Unvaccinated children attending any school acquired influenza more than 3 times more often and missed more days of school than their vaccinated peers. Furthermore, children with confirmed influenza suffered more symptoms for longer duration and missed more days of school per episode compared with children with noninfluenza respiratory viral infections. School attendance is important for a child's educational and social development. Studies have shown that school performance declines as absenteeism increases [33], and more instructional time would increase student performance on standardized tests [34]. Absenteeism also results in lost revenue to public schools due to attendance-based funding distribution laws in many states [35].
We acknowledge that limitations exist in this study. It was conducted over a single influenza season. The school districts enrolled a large proportion of Hispanics and Asians and fewer whites and blacks; also, most families were socioeconomically disadvantaged. These aspects may affect generalizability of the results, particularly to schools with high-income families that may have fewer household members and less crowding. However, schools are the primary site where children contact each other and spread influenza; our study documents influenza reduction by vaccination in schools. More socioeconomically disadvantaged children attended SLV intervention schools. Lower socioeconomic status has been associated with higher rates of influenza illness and complications [36, 37]. Therefore, we may have seen more influenza in those children due to differences in economic status, skewing the data toward a lower effectiveness of SLV programs. Despite this limitation, we still saw protection of children attending schools with SLV programs. Using CAIR likely underestimated VC in both control and intervention schools. The potential for misclassification of children who received vaccine elsewhere cannot be quantified. Therefore, the best comparison is between all children at intervention and control schools where we found more than 30% reduction in influenza. However, the comparison of unvaccinated children must be interpreted with caution.
With the final enrollment numbers, ILI attack rate, and influenza PCR-positivity rate, the study was underpowered (power = 62%, alpha = 0.05), yet we still found a significant reduction in influenza illness in SLV intervention schools. We likely would have identified more influenza cases if surveillance had started prior to the schools' winter break and prior to detection of influenza in LAC [5]. Higher rates of illness may have further emphasized differences between intervention and control schools. Nasopharyngeal aspirates have been considered the specimen of choice for influenza detection. Combined nasal/throat swabs were performed for convenience in the school or home setting. Moreover, the diagnostic yield of combined nose/throat swabs is similar to or higher than that of nasopharyngeal aspirates in pediatric and adult studies using RT-PCR [38, 39]. The ILI case definition was purposefully broad to capture all possible influenza cases. However, the broad definition may partially explain why the very sensitive multiplex RT-PCR did not detect a respiratory virus in two-thirds of children with ILI. We may have missed children with more severe illness who were absent from school, scheduled a doctor's appointment, or declined a home visit. To our knowledge, there were no children hospitalized with influenza illness.
Vaccination of schoolchildren is the most effective way to reduce influenza illness each year. SLV programs allow for increased opportunities for vaccination to confer direct and herd immunity among children that will lead to indirect protection of the community. Public health departments and schools must work together to inform parents and provide organized, efficient SLV programs in order to reach a target VC of 50% or greater.
Supplementary Data
Supplementary materials are available at Clinical Infectious Diseases online (http://cid.oxfordjournals.org). Supplementary materials consist of data provided by the author that are published to benefit the reader. The posted materials are not copyedited. The contents of all supplementary data are the sole responsibility of the authors. Questions or messages regarding errors should be addressed to the author.
Notes
Acknowledgments. We thank our school nurses, Andres Centeno and Lenoa Rios, and our dedicated study personnel including Anya Agopian, Adriana Ardy, Nicole Barragan, Yulissa Chen, Caroline Curley, John Diaz De Caro, Chrysanthy Ha, Jim Hung, Edward Kim, Leticia Marquez, Prajakta Parab, Lauren Senkbeil, Michael Ta, Desirae Tovar, and Camille Wolpe.
Financial support. This work was supported by the Thrasher Foundation Early Career Award and National Institutes of Health grant 5 K23 HD072774-02 awarded to P. S. P.
Potential conflicts of interest. L. M. is a speaker for Merck, Novartis, and Medimmune. All other authors report no potential conflicts.
All authors have submitted the ICMJE Form for Disclosure of Potential Conflicts of Interest. Conflicts that the editors consider relevant to the content of the manuscript have been disclosed.
References
- 1.Glezen WP, Couch RB. Interpandemic influenza in the Houston area, 1974–76. N Engl J Med. 1978;298:587–92. doi: 10.1056/NEJM197803162981103. [DOI] [PubMed] [Google Scholar]
- 2.Monto AS, Sullivan KM. Acute respiratory illness in the community. Frequency of illness and the agents involved. Epidemiol Infect. 1993;110:145–60. doi: 10.1017/s0950268800050779. [DOI] [PMC free article] [PubMed] [Google Scholar]
- 3.Medlock J, Galvani AP. Optimizing influenza vaccine distribution. Science. 2009;325:1705–8. doi: 10.1126/science.1175570. [DOI] [PubMed] [Google Scholar]
- 4.Frank AL, Taber LH, Wells CR, Wells JM, Glezen WP, Paredes A. Patterns of shedding of myxoviruses and paramyxoviruses in children. J Infect Dis. 1981;144:433–41. doi: 10.1093/infdis/144.5.433. [DOI] [PubMed] [Google Scholar]
- 5.Glezen WP, Couch RB, Taber LH, et al. Epidemiologic observations of influenza B virus infections in Houston, Texas, 1976–1977. Am J Epidemiol. 1980;111:13–22. doi: 10.1093/oxfordjournals.aje.a112865. [DOI] [PubMed] [Google Scholar]
- 6.Mossong J, Hens N, Jit M, et al. Social contacts and mixing patterns relevant to the spread of infectious diseases. PLoS Med. 2008;5:e74. doi: 10.1371/journal.pmed.0050074. [DOI] [PMC free article] [PubMed] [Google Scholar]
- 7.Neuzil KM, Hohlbein C, Zhu Y. Illness among schoolchildren during influenza season: effect on school absenteeism, parental absenteeism from work, and secondary illness in families. Arch Pediatr Adolesc Med. 2002;156:986–91. doi: 10.1001/archpedi.156.10.986. [DOI] [PubMed] [Google Scholar]
- 8.Piedra PA, Gaglani MJ, Kozinetz CA, et al. Herd immunity in adults against influenza-related illnesses with use of the trivalent-live attenuated influenza vaccine (CAIV-T) in children. Vaccine. 2005;23:1540–8. doi: 10.1016/j.vaccine.2004.09.025. [DOI] [PubMed] [Google Scholar]
- 9.Hull HF, Ambrose CS. Current experience with school-located influenza vaccination programs in the United States: a review of the medical literature. Hum Vaccin. 2011;7:153–60. doi: 10.4161/hv.7.2.13668. [DOI] [PMC free article] [PubMed] [Google Scholar]
- 10.White T, Lavoie S, Nettleman MD. Potential cost savings attributable to influenza vaccination of school-aged children. Pediatrics. 1999;103:e73. doi: 10.1542/peds.103.6.e73. [DOI] [PubMed] [Google Scholar]
- 11.King JC, Stoddard JJ, Gaglani MJ, et al. Effectiveness of school-based influenza vaccination. N Engl J Med. 2006;355:2523–32. doi: 10.1056/NEJMoa055414. [DOI] [PubMed] [Google Scholar]
- 12.Monto AS, Davenport FM, Napier JA, Francis T. Effect of vaccination of a school-age population upon the course of an A2-Hong Kong influenza epidemic. Bull World Health Organ. 1969;41:537–42. [PMC free article] [PubMed] [Google Scholar]
- 13.Glezen WP, Gaglani MJ, Kozinetz CA, Piedra PA. Direct and indirect effectiveness of influenza vaccination delivered to children at school preceding an epidemic caused by 3 new influenza virus variants. J Infect Dis. 2010;202:1626–33. doi: 10.1086/657089. [DOI] [PMC free article] [PubMed] [Google Scholar]
- 14.Rudenko LG, Slepushkin AN, Monto AS, et al. Efficacy of live attenuated and inactivated influenza vaccines in schoolchildren and their unvaccinated contacts in Novgorod, Russia. J Infect Dis. 1993;168:881–7. doi: 10.1093/infdis/168.4.881. [DOI] [PubMed] [Google Scholar]
- 15.Fiore AE, Uyeki TM, Broder K, et al. Prevention and control of influenza with vaccines: recommendations of the Advisory Committee on Immunization Practices (ACIP), 2010. MMWR Recomm Rep. 2010;59(RR-8):1–62. [PubMed] [Google Scholar]
- 16.Los Angeles County Department of Public Health. Surveillance Systems Used to Monitor Seasonal Influenza, 2011–2012. Available at: http://www.publichealth.lacounty.gov/acd/docs/Flu/FluSurveillance2011-12.pdf. Accessed 1 January 2013.
- 17.Centers for Disease Control and Prevention. Update: influenza activity—United States, 2010–11 season, and composition of the 2011–12 influenza vaccine. MMWR Morb Mortal Wkly Rep. 2011;60:705–12. [PubMed] [Google Scholar]
- 18.Wilson D, Sanchez KM, Blackwell SH, Weinstein E, El Amin AN. Implementing and sustaining school-located influenza vaccination programs: perspectives from five diverse school districts. J Sch Nurs. 2013;29:303–14. doi: 10.1177/1059840513486011. [DOI] [PubMed] [Google Scholar]
- 19.Centers for Disease Control and Prevention. Seasonal Influenza. Available at: http://www.cdc.gov/flu/about/disease/symptoms.htm. Accessed 11 March 2014.
- 20.Loeb M, Russell ML, Moss L, et al. Effect of influenza vaccination of children on infection rates in Hutterite communities: a randomized trial. JAMA. 2010;303:943–50. doi: 10.1001/jama.2010.250. [DOI] [PubMed] [Google Scholar]
- 21.Basta NE, Chao DL, Halloran ME, Matrajt L, Longini IM., Jr Strategies for pandemic and seasonal influenza vaccination of schoolchildren in the United States. Am J Epidemiol. 2009;170:679–86. doi: 10.1093/aje/kwp237. [DOI] [PMC free article] [PubMed] [Google Scholar]
- 22.Treanor JJ, Talbot HK, Ohmit SE, et al. Effectiveness of seasonal influenza vaccines in the United States during a season with circulation of all three vaccine strains. Clin Infect Dis. 2012;55:951–9. doi: 10.1093/cid/cis574. [DOI] [PMC free article] [PubMed] [Google Scholar]
- 23.Ohmit SE, Petrie JG, Malosh RE, et al. Influenza vaccine effectiveness in the community and the household. Clin Infect Dis. 2013;56:1363–9. doi: 10.1093/cid/cit060. [DOI] [PMC free article] [PubMed] [Google Scholar]
- 24.Effler PV, Chu C, He H, et al. Statewide school-located influenza vaccination program for children 5–13 years of age, Hawaii, USA. Emerg Infect Dis. 2010;16:244–50. doi: 10.3201/eid1602.091375. [DOI] [PMC free article] [PubMed] [Google Scholar]
- 25.Ohmit SE, Victor JC, Rotthoff JR, et al. Prevention of antigenically drifted influenza by inactivated and live attenuated vaccines. N Engl J Med. 2006;355:2513–22. doi: 10.1056/NEJMoa061850. [DOI] [PMC free article] [PubMed] [Google Scholar]
- 26.Ashkenazi S, Vertruyen A, Aristegui J, et al. Superior relative efficacy of live attenuated influenza vaccine compared with inactivated influenza vaccine in young children with recurrent respiratory tract infections. Pediatr Infect Dis J. 2006;25:870–9. doi: 10.1097/01.inf.0000237829.66310.85. [DOI] [PubMed] [Google Scholar]
- 27.Treanor JJ, Kotloff K, Betts RF, et al. Evaluation of trivalent, live, cold-adapted (CAIV-T) and inactivated (TIV) influenza vaccines in prevention of virus infection and illness following challenge of adults with wild-type influenza A (H1N1), A (H3N2), and B viruses. Vaccine. 1999;18:899–906. doi: 10.1016/s0264-410x(99)00334-5. [DOI] [PubMed] [Google Scholar]
- 28.Belshe RB, Edwards KM, Vesikari T, et al. Live attenuated versus inactivated influenza vaccine in infants and young children. N Engl J Med. 2007;356:685–96. doi: 10.1056/NEJMoa065368. [DOI] [PubMed] [Google Scholar]
- 29.Hoft DF, Babusis E, Worku S, et al. Live and inactivated influenza vaccines induce similar humoral responses, but only live vaccines induce diverse T-cell responses in young children. J Infect Dis. 2011;204:845–53. doi: 10.1093/infdis/jir436. [DOI] [PMC free article] [PubMed] [Google Scholar]
- 30.Jain VK, Rivera L, Zaman K, et al. Vaccine for prevention of mild and moderate-to-severe influenza in children. N Engl J Med. 2013;369:2481–91. doi: 10.1056/NEJMoa1215817. [DOI] [PubMed] [Google Scholar]
- 31.Centers for Disease Control and Prevention. Prevention and control of seasonal influenza with vaccines. Recommendations of the Advisory Committee on Immunization Practices—United States, 2013–2014. MMWR Recomm Rep. 2013;62(RR-07):1–43. [PubMed] [Google Scholar]
- 32.Fine PEM, Mulholland K. Community Immunity. In: Plotkin SA, Orenstein WA, Offit PA, editors. Vaccines. 6th ed. Elsevier; 2013. pp. 1395–412. [Google Scholar]
- 33.Gottfried MA. The detrimental effects of missing school: evidence from urban siblings. Am Jf Educ. 2011;117:147–82. [Google Scholar]
- 34.Marcotte DE, Hemelt SW. Unscheduled closings and student performance. Education Finance and Policy. 2008;3:316–38. [Google Scholar]
- 35.ChalkBoard_Project. Using Average Daily Attendance as a Basis for Distributing State School Revenue. Available at: http://www.chalkboardproject.org/images/PDF/Attendance.pdf. Accessed 8 January 2014.
- 36.Iwane MK, Chaves SS, Szilagyi PG, et al. Disparities between black and white children in hospitalizations associated with acute respiratory illness and laboratory-confirmed influenza and respiratory syncytial virus in 3 US counties—2002–2009. Am J Epidemiol. 2013;177:656–65. doi: 10.1093/aje/kws299. [DOI] [PubMed] [Google Scholar]
- 37.Quinn SC, Kumar S, Freimuth VS, Musa D, Casteneda-Angarita N, Kidwell K. Racial disparities in exposure, susceptibility, and access to health care in the US H1N1 influenza pandemic. Am J Public Health. 2011;101:285–93. doi: 10.2105/AJPH.2009.188029. [DOI] [PMC free article] [PubMed] [Google Scholar]
- 38.Lambert SB, Whiley DM, O'Neill NT, et al. Comparing nose-throat swabs and nasopharyngeal aspirates collected from children with symptoms for respiratory virus identification using real-time polymerase chain reaction. Pediatrics. 2008;122:e615–20. doi: 10.1542/peds.2008-0691. [DOI] [PubMed] [Google Scholar]
- 39.de la Tabla VO, Masiá M, Antequera P, et al. Comparison of combined nose-throat swabs with nasopharyngeal aspirates for detection of pandemic influenza A/H1N1 2009 virus by real-time reverse transcriptase PCR. J Clin Microbiol. 2010;48:3492–5. doi: 10.1128/JCM.01105-10. [DOI] [PMC free article] [PubMed] [Google Scholar]
Associated Data
This section collects any data citations, data availability statements, or supplementary materials included in this article.