Abstract
Motivation: We introduce Census 2, an update of a mass spectrometry data analysis tool for peptide/protein quantification. New features for analysis of isobaric labeling, such as Tandem Mass Tag (TMT) or Isobaric Tags for Relative and Absolute Quantification (iTRAQ), have been added in this version, including a reporter ion impurity correction, a reporter ion intensity threshold filter and an option for weighted normalization to correct mixing errors. TMT/iTRAQ analysis can be performed on experiments using HCD (High Energy Collision Dissociation) only, CID (Collision Induced Dissociation)/HCD (High Energy Collision Dissociation) dual scans or HCD triple-stage mass spectrometry data. To improve measurement accuracy, we implemented weighted normalization, multiple tandem spectral approach, impurity correction and dynamic intensity threshold features.
Availability and implementation: Census 2 supports multiple input file formats including MS1/MS2, DTASelect, mzXML and pepXML. It requires JAVA version 6 or later to run. Free download of Census 2 for academic users is available at http://fields.scripps.edu/census/index.php.
Contact: jyates@scripps.edu
Supplementary information: Supplementary data are available at Bioinformatics online.
1 INTRODUCTION
Over the past decade, proteomic analysis by mass spectrometers has become an essential tool for addressing important biological questions. Initially, mass spectrometers were used to identify components of a proteome, but now they are commonly used to quantitate proteomic differences induced by different biological conditions. Accurate quantitation benefits from a higher resolution mass spectrometer, which often reduces instrument scanning speed. We previously reported the development of the software Census that facilitates the quantitation of large proteomic datasets. Census (Park et al., 2008) was initially developed to analyze MS data using metabolic labeling for quantitation, but it is also capable of analyzing MS data with isobaric tags. With the development of faster high-resolution mass spectrometers, such as Thermo Scientific™ Velos LTQ-Orbitrap, Velos LTQ-Orbitrap Elite, Q-Exactive and AB SCIEX Triple-TOF, quantitation with isobaric tags has become more efficient. After the analysis of a large number of isobaric tag datasets, we have improved Census for this increasingly popular quantitation method.
2 DESIGN AND IMPLEMENTATION
Census 2 is composed of two parts: a quantitative analysis module that builds chromatographs from spectra and calculates ratios of relative peptide abundance or measures fragment ion intensities (isobaric labeling), and a qualitative module that normalizes peak intensities to correct sample mixing error, filter out noisy peaks and perform triple-stage mass spectrometry (MS3) quantitative analysis and dual scan analysis. Census 2 has been developed in Java and is operating system independent. The user can run Census 2 on personal Windows/Macintosh desktop computer or deploy it onto a high performance server and run in console mode for multiple users. Census 2 uses indices to access mass spectral data by random file access to retrieve data quickly without using a large amount of computer memory.
2.1 Data acquisition
Several different data acquisition approaches have been proposed for quantitative analysis using either Tandem Mass Tag (TMT) or Isobaric Tags for Relative and Absolute Quantification (iTRAQ). The combination of dual fragmentation methods for tandem spectral acquisition such as CID/HCD can improve the number of identifications while optimizing collision energy for quantification. Another approach is to perform HCD in an MS3 scan to eliminate interference from co-fragmenting peaks in the MS1 isolation window.
2.1.1 CID-HCD dual scans
In CID-HCD dual scan configuration, the selected parent ion is first fragmented by CID (for peptide identification) and then by HCD (for peptide quantification) (Kocher et al., 2009). Census 2 can analyze CID-HCD dual scans to improve identification sensitivity while allowing accurate quantitative results. Users can define the number of consecutive CID or HCD scans. Census 2 compares precursor ions with properly matched corresponding scans.
2.1.2 MS3 quant
In the method proposed by Ting et al. (2011), quantification is performed using a MS3 HCD scan. We implemented MS3-based quantitation in Census 2. Census 2 compares precursor mass in MS2 and logged information in MS3 to properly match corresponding scans.
2.2 Accurate measurement
For isobaric labeling, we have developed computational algorithms to improve sensitivity of quantitative measurements. Users can customize quantitative parameters in the census_config.xml file.
2.2.1 Weighted normalization
Normalization in the quantitative analysis is important to correct systematic errors, such as those from imprecise sample mixing. Census 2 uses the fact that the majority of proteins do not change abundance in standard well-controlled experiments to correct reporter ion intensities. It extracts reporter ion intensities for each channel and generates distributions of intensities. Census 2 assigns different weights based on overall intensities and calculates intensity correction values (Taylor, 1982).
2.2.2 Multiple tandem spectra
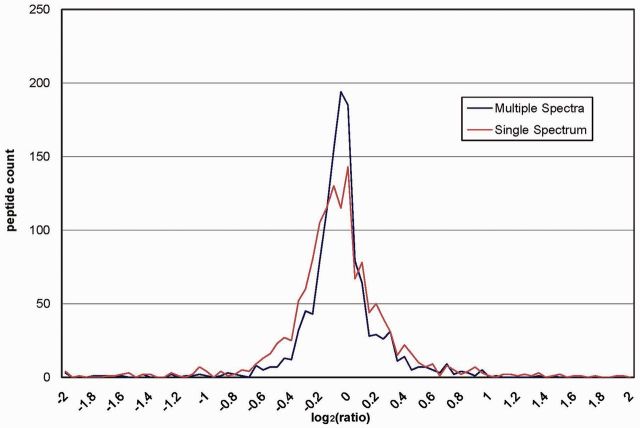
While repeated sampling of the same ion does not benefit identifications, each scan provides independent quantitative information that can be harnessed to increase accuracy from reporter ion intensity variance. For example, running DTASelect2 with –t 0 option generates redundant scans to improve quantitative accuracy by increasing the number of measurements (Tabb et al., 2002). In this way, Census 2 increases quantitative accuracy by removing errors from intensity fluctuation (Fig. 1).
Fig. 1.
Protein ratio distribution for 1:1 standard mixture. Data are from pulsed Q collision induced dissociation experiment on a 1:1 mixture of Mouse Embryonic Fibroblast (MEF) cell lysate labeled with 126 and 127 (TMT), respectively
2.2.3 Impurity correction
Isotopic impurities in iTRAQ or TMT reagents result in small but significant bleeding into neighboring reporter ion channels. As these impurities coincide with and are indistinguishable from the neighboring reporter ions, the quantitative results can be improved by correcting reporter ion isotope values. The user can define correction values in percentages as provided by the reagent manufacturers.
2.2.4 Dynamic intensity threshold
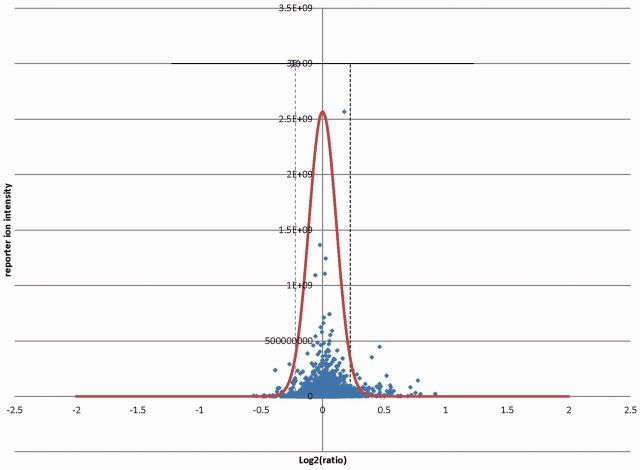
The accuracy of quantitative measurement is improved when higher reporter ion intensities are used. Low intensity peaks that are close to background noise can deviate from correct values. Figure 2 shows ratio versus reporter ion intensity plot from HCD 1:1 mixture of mouse liver lysate. Census 2 dynamically generates a distribution of reporter ion intensities and fits it into normal distribution. It then calculates intensity thresholds with user’s defined parameters such as a ∼95% confidence interval (µ ± 2σ).
Fig. 2.
Intensity versus ratio distribution from HCD 1:1 mixture of mouse liver lysate labeled with 126 and 127 (TMT), respectively
3 SUMMARY AND FUTURE DIRECTION
Since original Census was released, we have implemented additional features and algorithmic improvements. In Census 2, isobaric labeling analysis is one of notable features we added. We will continue enhancing Census 2 for new proteomic technologies.
Funding: Sung Kyu Robin Park (AG031097, MH100175, UPENN GM1040, UCLA/NHLBI Proteomics Centers HHSN268201000035C), Daniel B. McClatchy (MH067880), Xuemei Han (UCLA/NHLBI Proteomics Centers HHSN268201000035C), Harshil Shah (TSRI Proteomics Core, UCLA/NHLBI Proteomics Centers HHSN268201000035C), Meha Singh (U19 AI063603), Navin Rauniyar (PROTEO/SFP1981, TSRI Proteomic Core), James Moresco (P41GM103533), Jolene Diedrich (HoffmanRocheSFP-2063), Claire Delahunty (Rochester/DE008921, MH067880), John R. Yates III (P41GM103533, R01 MH067880, R01 HL079442).
Conflict of Interest: none declared.
Supplementary Material
REFERENCES
- Park SK, et al. A quantitative analysis software tool for mass spectrometry-based proteomics. Nat. Methods. 2008;5:319–322. doi: 10.1038/nmeth.1195. [DOI] [PMC free article] [PubMed] [Google Scholar]
- Kocher T, et al. High precision quantitative proteomics using iTRAQ on an LTQ Orbitrap: a new mass spectrometric method combining the benefits of all. J. Proteome Res. 2009;8:4743–4752. doi: 10.1021/pr900451u. [DOI] [PubMed] [Google Scholar]
- Ting L, et al. MS3 eliminates ratio distortion in isobaric multiplexed quantitative proteomics. Nat. Methods. 2011;8:937–940. doi: 10.1038/nmeth.1714. [DOI] [PMC free article] [PubMed] [Google Scholar]
- Taylor JR. An Introduction to Error Analysis: The Study of Uncertainties in Physical Measurements. Mill Valley, CA: University Science Books; 1982. [Google Scholar]
- Tabb DL, et al. DTASelect and Contrast: tools for assembling and comparing protein identifications from shotgun proteomics. J. Proteome Res. 2002;1:21–26. doi: 10.1021/pr015504q. [DOI] [PMC free article] [PubMed] [Google Scholar]
Associated Data
This section collects any data citations, data availability statements, or supplementary materials included in this article.


