Abstract
Aim:
Biomarkers and image markers of Alzheimer's disease (AD), such as cerebrospinal fluid Aβ42 and p-tau, are effective predictors of cognitive decline or dementia. The aim of this study was to integrate these markers with a disease progression model and to identify their abnormal ranges.
Methods:
The data of 395 participants, including 86 normal subjects, 108 early mild cognitive impairment (EMCI) subjects, 120 late mild cognitive impairment (LMCI) subjects, and 81 AD subjects were obtained from the Alzheimer's Disease Neuroimaging Initiative (ADNI) database. For the participants, baseline and long-term data on cerebrospinal fluid Aβ42 and p-tau, hippocampal volume, and ADAS-cog were available. Various linear and nonlinear models were tested to determine the associations among the ratio of Aβ42 to p-tau (the Ratio), hippocampal volume and ADAS-cog.
Results:
The most likely models for the Ratio, hippocampal volume, and ADAS-cog (logistic, Emax, and linear models, respectively) were used to construct the final model. Baseline disease state had an impact on all the 3 endpoints (the Ratio, hippocampal volume, and ADAS-cog), while APOEε4 genotype and age only influence the Ratio and hippocampal volume.
Conclusion:
The Ratio can be used to identify the disease stage for an individual, and clinical measures integrated with the Ratio improve the accuracy of mild cognitive impairment (MCI) to AD conversion forecasting.
Keywords: Alzheimer's disease, mild cognitive impairment, Aβ42, p-tau, hippocampus, ADAS-cog, disease progression model, NONMEM
Introduction
Recent neuropathology and biomarker studies have found that the pathological changes in Alzheimer's disease (AD), particularly beta-amyloid plaques and neurofibrillary tangles (NFT), may precede the onset of clinical disease by as long as 20-30 years1,2,3. A logical next step for further investigation of these changes is to express the disease process in terms of a series of measurable biological indicators. A disease progression model is a good choice because it can provide a basis for learning from prior clinical experience and summarize knowledge in a quantitative fashion. Almost all of the current models describe disease progression by only using the longitudinal AD Assessment Scale-cognitive subscale (ADAS-cog) scores. Holford and Peace first developed a linear disease progression model to describe longitudinal changes in ADAS-cog data over time in mild-to-moderate AD patients4. Several nonlinear models were subsequently developed because the linear model was considered insufficient to portray cognitive decline in disease progression. Samtani et al developed a logistic model to describe the longitudinal change of ADAS-cog scores for mild cognitive impairment (MCI) patients5. Gomeni et al reported an indirect physiological response model for mild-to-moderate AD patients, assuming constant kin and kout to be time-variant6. These models do not capture subtle biochemical or physiologic changes and may have a large variation, resulting in poor prediction. The progression of the disease is usually very slow and requires long-term data collection for an accurate analysis. Disease progression models with more physiologic inputs may be more appropriate for chronic degenerative diseases7. The current challenge is finding a way to integrate the biomarkers to a disease progression model. Jack et al suggested a well-accepted model to describe the temporal evolution of AD biomarkers versus time8. The original hypothesis was that the curves followed a Sigmoid function. Several other biomarkers' dynamic models have been developed since then, such as linear and exponential models9. These models lacked mathematical proof and description, and as such, they were only conceptual description models.
The most widely studied cerebrospinal fluid (CSF) biomarkers include the CSF 42 amino acid form of Aβ (Aβ42) and phosphorylated tau protein (p-tau), which have been shown to serve as in vivo proxy measures of amyloid plaques and NFT, respectively10,11,12,13. The consensus of scientists worldwide is that in the disease's evolution process, AD biomarkers do not develop in an identical manner. These biomarkers develop in a sequential yet partially overlapped manner. Discussion regarding the initiating event in the biological cascade that eventually leads to AD has been controversial. The amyloid cascade hypothesis assumes that a series of causal events are initiated by abnormal Aβ production/aggregation14,15,16. An alternative hypothesis is that p-tau develops first, but is confined to subcortical and medial temporal limbic areas. Neocortical Aβ deposits develop thereafter, aiding the antecedent tau-related neurodegeneration widely spreading by unknown mechanisms17,18,19,20. The sequence of this biological cascade is not consistent between individuals, so neither Aβ42 nor p-tau alone is sufficient to accurately diagnose the onset of AD. The changes in CSF Aβ42 and p-tau are very slow, and they approach plateaus at different times, limiting their utility for longitudinal measurement. The ratio of CSF Aβ42 to p-tau (the Ratio) may provide a promising strategy for monitoring the onset of AD. Because the level of CSF Aβ42 demonstrates a decrease over time, while that of p-tau demonstrates an increase over time, the Ratio always decreases in a more apparent manner.
Anomalies of the Ratio lead to neurodegeneration, possibly due to the direct neurotoxicity of aggregated Aβ and the collapse of the neuronal transport system that is caused by p-tau21. The first region in the brain showing significant atrophy during AD progression is the hippocampus, which plays an important role in the formation of new memories. The hippocampus can also provide measures of cerebral atrophy, due to the loss of synapses and neurons22,23,24. In addition, a prospective longitudinal cohort study found that greater atrophy in the hippocampal subfields predicted MCI conversion, whereas larger hippocampal volumes predicted cognitive stability and/or improvement25. Therefore, hippocampal volume is an essential indicator of disease progression in AD.
All of these pathological changes eventually lead to a loss of memory and functional ability, which are reflected by ADAS-cog. The disease progression model and biomarkers' models are discrete entities at present, but they are in fact connected. Because of the current lack of mathematical models, the abnormal range for many markers is not yet known. The objective of this study is to integrate these into disease progression models and to find out their abnormal ranges. We put forward an empirical model where clinical continuum of AD is initiated by an abnormality of the Ratio, followed by hippocampal atrophy and cognitive impairment. A detailed disease progression model can be established by finding associations between the Ratio, hippocampal volume, and ADAS-cog.
Materials and methods
Study details
Data were provided by the ADNI database (http://adni.loni.usc.edu/). This database is open to the public and allows authorized scientists to access imaging, clinical, genomic, and biomarker data for the purpose of scientific investigation, teaching, or planning clinical research studies. The primary goal of ADNI is to investigate whether serial MRI, PET, other biological markers, and clinical and neuropsychological assessment can be combined to measure the progression of MCI and early AD. Determining sensitive, specific markers of very early AD progression can aid researchers and clinicians in developing new treatments and monitoring their effectiveness. This can also reduce the time and cost of clinical trials.
The ADNI study began in 2004 and included 400 subjects diagnosed with MCI, 200 subjects with early AD, and 200 normal elderly (NL) subjects. The initial phase of the study was known as ADNI1. In 2009, ADNI1 was extended with ADNI GO, which assessed the existing ADNI1 cohort and added 200 participants identified as early MCI (EMCI). The objective of this phase was to examine biomarkers in an earlier stage of the disease. In 2011, as ADNI GO was ending, ADNI2 began. ADNI2 assessed participants from the ADNI1/ADNI GO cohort and added the following new participants: 150 NL, 100 EMCI, 150 late MCI (LMCI) and 150 mild AD patients.
We included 395 subjects from the ADNI study (Table 1), for whom baseline data on Aβ42, p-tau, hippocampal volume and ADAS-cog were available. Statistical analysis was conducted to determine whether we should consider the variation among phases of the study. A one-way ANOVA did not identify a significant difference between phases when the significance threshold was set at 0.01. Therefore, we treated all data as heterogeneous in subsequent data processing.
Table 1. Demographic characteristics of participants.
| Parameter | Normal | EMCI | LMCI | AD |
|---|---|---|---|---|
| Number | 86 | 108 | 120 | 81 |
| Age (Year) | 72.7 (56.2–89.6) | 70.4 (55–88.3) | 71.9 (48.1–85.9) | 75.1 (58.2–89.6) |
| Female (%) | 48 (55.8) | 45 (41.7) | 48 (40.0) | 33 (40.7) |
| Education (Year) | 16 (6–20) | 16 (11–20) | 16 (4–20) | 16 (9–20) |
| White (%) | 69 (80.2) | 104 (96.3) | 116 (96.7) | 74 (91.4) |
| Married (%) | 58 (67.4) | 85 (78.7) | 97 (80.8) | 71 (87.7) |
| APOEε4=0 (%) | 56 (65.1) | 52 (48.2) | 50 (41.7) | 19 (23.5) |
| APOEε4=1 (%) | 28 (32.6) | 47 (43.5) | 47 (39.2) | 44 (54.3) |
| APOEε4=2 (%) | 2 (2.3) | 9 (8.3) | 23 (19.1) | 18 (22.2) |
| Aβ42 (μg/mL) | 209.2 (99.2–311.4) | 180.3 (86.1–327.3) | 149.1 (40.5–04.3) | 131.8 (81.8–280.1) |
| p-tau (μg/mL) | 27.8 (6.9–95) | 32.9 (9.9–89.1) | 37.2 (10.8–136.0) | 49.8 (22.3–145.5) |
| The Ratio | 7.7 (1.6–30.3) | 5.2 (1.3–21.3) | 3.8 (1.0–23.6) | 2.4 (0.6–7.7) |
| ADAS-cog | 7.67 (0–17) | 8 (1–16) | 10.83 (1–27) | 21 (9–38) |
| Hippocampus (mL) | 7.609 (5.172–9.543) | 7.197 (4.554–9.993) | 6.678 (3.514–9.902) | 5.856 (4.065–7.804) |
The table was summarised as mean (range) for continuous data and count (percentage) for categorical data.
Model software
Dataset preparation, exploration and visualization were performed using R (version 2.15.0). Disease progression models were established using extended least squares regression by NONMEM (version 7.2, Icon Development Solutions, Ellicott City, MD, USA). The model building strategy that we used was based on an approach that is widely accepted in the pharmacometrics community. Various models were tested, and model selection was based on mechanistic plausibility, parameter estimate precision, and the objective function value (OFV). The disease progression model we used was established by subroutine ADVAN6 with TOL equal to 5 in NONMEM, using the first-order conditional estimation (FOCE) method without η-ε interaction. Relevant covariates were screened by visual inspection, using Xpose Version 4.0 (Uppsala University, Uppsala, Sweden) via multiple forward selection and backward elimination steps. The difference in OFVs between hierarchical models was assumed to have an approximate χ2 probability distribution, with the number of degrees of freedom equal to the difference in the number of parameters between the models. Covariates were considered significant when the difference between OFVs, with and without the covariate, was greater than 7.88 (P<0.005).
Model performance evaluation
Bootstrap analysis
A total of 1000 bootstrap replicates were randomly generated from the original data, then refitted to the final model. Median parameter estimates and 95% confidence intervals (CI) obtained from these bootstrap replications were compared with those obtained from the original dataset.
The visual predictive check (VPC)
VPC was constructed based on 1000 stochastic simulations from the final model. The median of the dependent variable (DV) and nonparametric 95% CI were then calculated (at the 2.5th and 97.5th percentiles) for the observed and all of the simulated datasets to graphically assess whether simulations were able to reproduce both the central trend and variability in the observed data.
Model progression
Base model
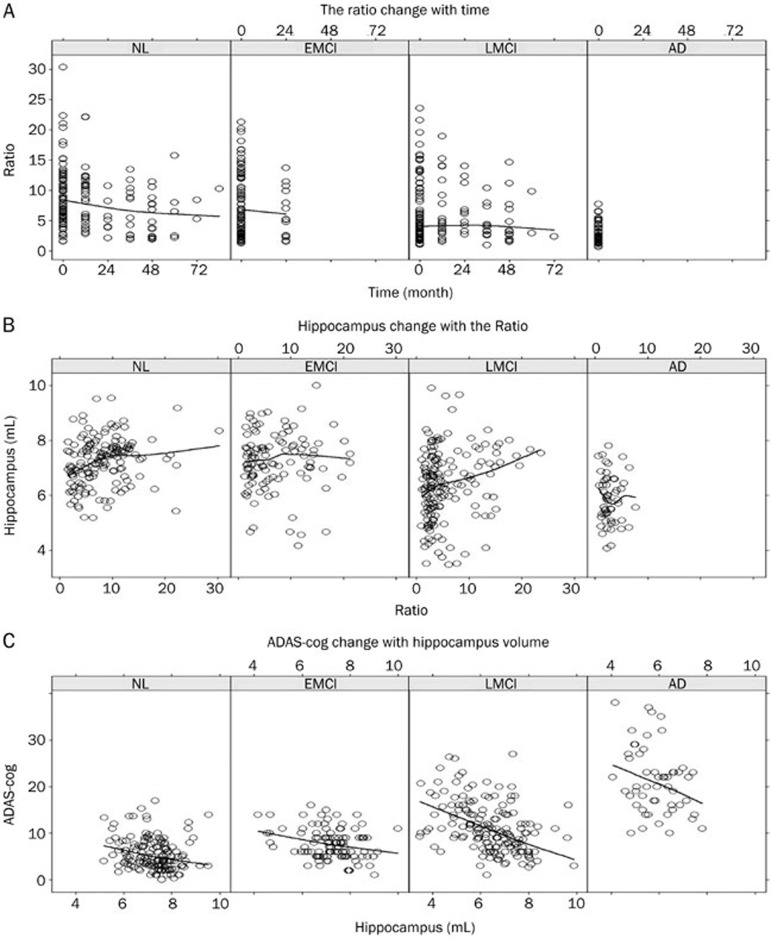
Various linear and nonlinear models were tested to determine the associations among time, the Ratio, hippocampal volume, and ADAS-cog. Brief descriptions and mathematical expressions are listed in Table 2. The changes of the Ratio over time, hippocampal volume with the Ratio, and ADAS-cog with hippocampal volume are all depicted in Figure 1, where we tested linear, Emax and Sigmoid models. In addition, because biological systems were self-limited, we also tested a logistic model with homeostatic control systems for the Ratio. The rate of change of the Ratio was governed by a constant K and itself, describing the phenomenon where the rate of change first increased and then decreased with increase of the Ratio. The Akaike Information Criterion (AIC) was used to compare these non-nested models, which mainly focused on gauging how well the models conformed to the data.
Table 2. Model comparison.
| No | Model description | Mathematical expression | AIC | ΔAIC |
|---|---|---|---|---|
| 1 | The Ratio (R): linear model |  |
1527.26a | – |
| 2 | The Ratio (R): Emax model |  |
1528.69 | 1.43 |
| 3 | The Ratio (R): sigmoid model |  |
1503.43 | −23.83 |
| 4 | The Ratio (R): logistic model |  |
1493.96 | −33.3 |
| 5 | The Ratio (R): logistic model Hippocampal volume (V): linear model | 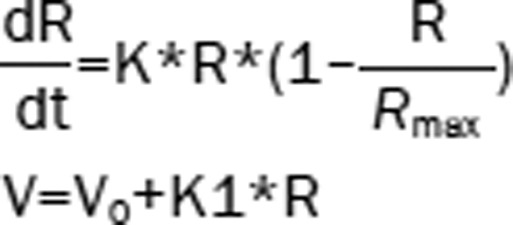 |
1799.68b | – |
| 6 | The Ratio (R): logistic model Hippocampal volume (V): Emax model | 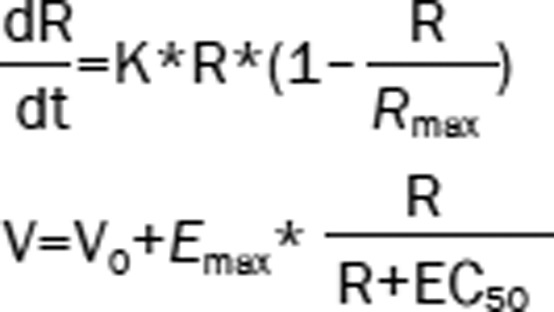 |
1703.77 | −95.91 |
| 7 | The Ratio (R): logistic model Hippocampal volume (V): Sigmoid model | 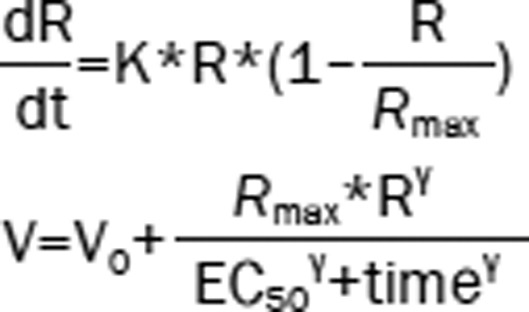 |
1707.04 | −92.64 |
| 8 | The Ratio (R): logistic model Hippocampal volume (V): Emax model ADAS-cog (S): linear model | 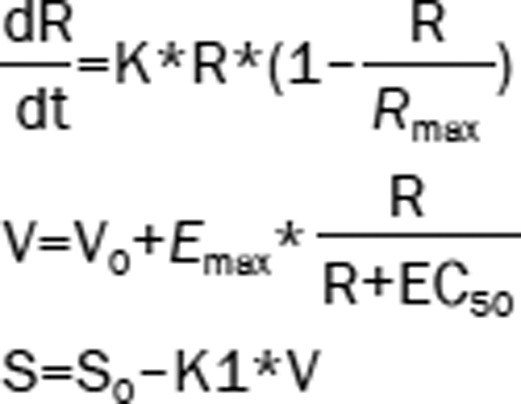 |
3650.75c | – |
| 9 | The Ratio (R): logistic model Hippocampal volume (V): Emax model ADAS-cog (S): Emax model | 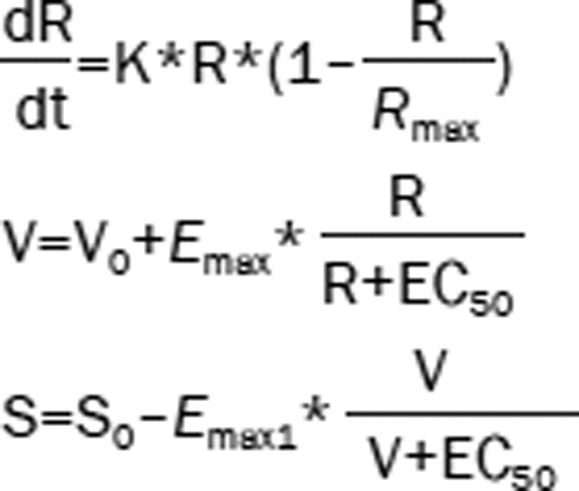 |
3652.75 | 2 |
R0 baseline of the ratio; V0 baseline of hippocampal volume; S0 baseline of ADAS-cog; R0=Aβ0/p-tau0
Rmax was fixed at 30, the largest value observed for the Ratio.
a The AICs of model 2–4 were compared with that of model 1;
b the AICs of model 6–7 were compared with that of model 5;
c the AIC of model 9 was compared with that of model 8; −, not included in the OFV comparison.
Figure 1.
(A) The Ratio change over time; (B) hippocampal volume change with the Ratio; (C) ADAS-cog change with hippocampal volume. The solid line represents the loss regression line. The observed data are represented by circles.
Covariate model
According to the results of previous studies, covariates of interest in AD include disease state (DS), age, APOEε4 genotype and sex. We confirmed that there was no obvious correlation among these covariates. The ethnicity of the patients and their levels of education were reported to influence the disease progression, but we did not analyze these factors because of data bias. The effects of covariates were modeled using a linear equation (Eq 1).
 |
where PTVi is the value of model parameter for individual i, θ is a correlation coefficient estimated for covariate, covi is individual's covariate value.
Categorical covariates were mapped to values of 0, 1, 2, and so on. APOEε4 is the best-established genetic risk factor for AD, predicting an earlier onset of AD and faster cognitive decline. The APOEε4 genotype was categorized into 0 APOEε4 allele (APOEε4=0), 1 APOEε4 allele (APOEε4=1) and 2 APOEε4 alleles (APOEε4=2). Gender was categorized to 0 for male (SEX=0) or 1 for female (SEX=1). DS was categorized to normal (DS=0), EMCI (DS=1), LMCI (DS=2), and AD (DS=3).
Results
The parameters of final model
Given the criteria we used to select the model, the most likely models (Table 2) for the Ratio over time, hippocampal volume with the Ratio and ADAS-cog with hippocampal volume were logistic, Emax and linear models, respectively, with the formulas in Model 8 used as the integrated base model. Because the trends between ADAS-cog and hippocampal volume were inconsistent for different disease states (Figure 1C), a uniform model covering all disease states was unavailable. We divided the four disease states into two subgroups (NL and EMCI, LMCI and AD) according to different rates of cognitive decline and further modified Model 8 in Table 2 (Eq 7,8).
 |
The mathematical formulas of the final model were as follows (Eq 2,3,4,5,6,7,8,9):
 |
where R is the value of the Ratio. V is the value of hippocampal volume. S is the value of ADAS-cog. K is a constant controlling the change rate of the Ratio. Rmax equals to 30, the largest observed value of the Ratio. R0 is the base value of the Ratio when both DS and APOEε4 are equal to 0. θ1 is the correlation coefficient of DS on the Ratio. θ2 is the correlation coefficient of APOEε4 on the Ratio. V0 is the base value of hippocampal volume when age equals to 0. θ3 is the correlation coefficient of age on hippocampal volume. θ4 is the correlation coefficient of DS on EC50. S0 is the base value of ADAS-cog when DS equals to 0. K1 is the slope of ADAS-cog changed with hippocampal volume for NL and EMCI subject. K2 is the slope of ADAS-cog changed with hippocampal volume for LMCI and AD subject, and θ5 is the correlation coefficient of DS on ADAS-cog.
The results of the estimates in the final model are summarized in Table 3. The baseline of the Ratio decreased with the aggravation of disease and the increased number of APOEε4 alleles: NL with 0 APOEε4 allele showed the maximum value of 8.09, while AD with 2 APOEε4 alleles showed the minimum value of 1.55. As time progressed, the Ratio decreased. Using the final model, we could see that the Ratio for different subgroups showed the same declining trend, but with different baseline values.
Table 3. Results of the final integrated model.
| Parameter | Original dataset |
Bootstrap replicatesa |
||||
|---|---|---|---|---|---|---|
| Estimate (%RSE) | 95% Confidence interval | Median | 95% Confidence interval | |||
| K | −0.0134 (12) | −0.0166 | −0.0102 | −0.0133 | −0.0167 | −0.00982 |
| R0 | 8.09 (5) | 7.34 | 8.84 | 8.07 | 5.77 | 10.13 |
| θ1 | 1.08 (17) | 0.72 | 1.44 | 1.08 | 0.55 | 1.59 |
| θ2 | 1.65 (15) | 1.18 | 2.12 | 1.66 | 0.890 | 2.42 |
| V0 (mL) | 6.97 (12) | 5.38 | 8.56 | 7.01 | 4.02 | 9.91 |
| θ3 (mL·Year−1) | 0.0484 (15) | 0.0339 | 0.0629 | 0.0488 | 0.0252 | 0.0727 |
| Emax (mL) | 4.42 (12) | 3.39 | 10.80 | 4.41 | 2.17 | 6.62 |
| EC50 | 0.707 (26) | 0.340 | 1.070 | 0.690 | 0.266 | 1.140 |
| θ4 | 0.432 (31) | 0.167 | 0.693 | 0.433 | 0.0395 | 0.904 |
| S0 | 11.6 (14) | 8.44 | 14.8 | 11.6 | 6.2 | 17.0 |
| θ5 | 4.56 (8.0) | 3.38 | 5.46 | 4.53 | 2.87 | 6.15 |
| K1 (mL−1) | 0.96 (23) | 0.53 | 1.39 | 0.96 | 0.47 | 1.45 |
| K2 (mL−1) | 1.36 (19) | 0.85 | 1.88 | 1.35 | 0.722 | 2.003 |
| BSV for K | 0.345 (21) | 0.0569 | 0.633 | 0.335 | 0.0358 | 0.680 |
| BSV for R0 | 0.341 (4) | 0.287 | 0.395 | 0.339 | 0.283 | 0.395 |
| BSV for V0 | 0.0347 (15) | 0.0149 | 0.0545 | 0.0348 | 0.0119 | 0.0615 |
| BSV for EC50 | 0.931 (10) | 0.561 | 1.300 | 0.934 | 0.512 | 1.394 |
| BSV for S0 | 0.0408 (12) | 0.0121 | 0.0541 | 0.0404 | 0.0211 | 0.0622 |
| AE for the R | 1.11 (13) | 0.557 | 1.660 | 1.09 | 0.570 | 1.613 |
| AE for V | 0.0391 (13) | 0.0196 | 0.0586 | 0.0388 | 0.0183 | 0.0633 |
| AE for S | 6.75 (9) | 4.36 | 9.14 | 6.67 | 4.28 | 9.10 |
| OFV | 3259.22 | – | – | 3232.00 | 3032.63 | 3428.23 |
BSV, between subject variability; AE, additional error; −, not included in the base model.
a Nonparametric bootstrap stratified by patient population (n=1000).
The baseline of hippocampal volume showed a downward trend with increase in age: every year the hippocampal volume reduced by 0.048 mL. EC50 showed an increased trend with aggravation of disease: 0.707 mL for NL and 1.997 mL for AD. The results suggest that hippocampal volumes decrease faster for individuals in a more serious disease state because of the higher EC50.
The baseline of ADAS-cog increased with the aggravation of disease: 13.7 for NL and 27.35 for AD. The four groups were divided into two subgroups, using different slopes of linear models. The results show that the subgroups in different disease states demonstrated different increasing trends: ADAS-cog increased more rapidly if the subjects were in AD or LMCI stages.
These results were all consistent with our hypothesis that a lower Ratio indicates a more severe disease state.
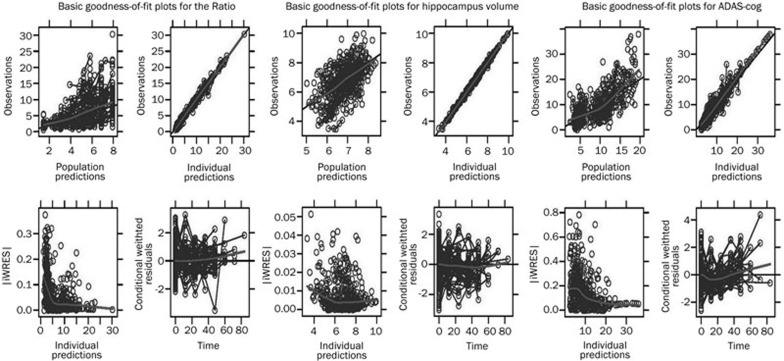
Overall, the final model parameters were well estimated, with reasonable confidence intervals and in good agreement with results calculated by the bootstrap (Table 3). The correlations of population predictions versus observations and individual predictions versus observations were in good agreement. The weighted residuals were, in general, randomly scattered around the zero line. Upon inclusion of the covariates into the model, we confirmed visually that there was no trend in the distribution of random effects in the final model (Figure 2).
Figure 2.
Basic goodness-of-fit plots for the final model.
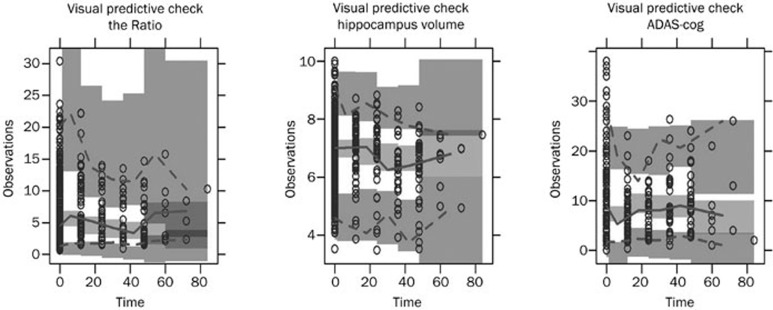
The results of VPC, show that the distribution of the observed data was contained within the empirical distribution of the estimates predicted by the final model over 1000 simulations. This indicates that the final model prediction was reasonable for both the point estimates as well as the distributions (Figure 3).
Figure 3.
Visual predictive check from 1000 simulations. The solid line represents the median observed data, and the gray field around it represents a simulation-based 95% confidence interval for the median. The observed 5% and 95% percentiles are presented with dashed lines, and the gray fields around them are their 95% confidence intervals. The observed data are represented by circles.
Using the mean and 95% confidence interval, we were able to determine the corresponding scope of the Ratio to each disease state (Table 4). The mathematical expression for the Ratios' baseline was as Eq 2.
Table 4. Corresponding scope of the Ratio to each disease state.
| Genotype | NL | EMCI | LMCI | AD |
|---|---|---|---|---|
| APOEε4=0 | 8.09 (7.34–8.34) | 7.01d (5.91–8.11) | 5.93 (4.48–7.38) | 4.85 (3.05–6.65) |
| APOEε4=1 | 6.44a (5.22b–7.16c) | 5.36 (3.79–6.93) | 4.28 (2.36–6.20) | 3.20 (0.93–5.47) |
| APOEε4=2 | 4.79 (3.10–5.98) | 3.71 (1.67–5.75) | 2.63 (0.24–5.02) | 1.55 (0–4.29) |
The table was summarised as mean (95% confidence interval).
R0=8.09 (7.34, 8.84); θ1=1.08 (0.73, 1.43); θ2=1.65 (1.18, 2.12). Values are expressed as typical value (range).
a 6.44=8.09–.65;
b 5.22=7.34–2.12;
c 7.16=8.34–1.18;
d 7.01=8.09–1.08; the rests followed the same rules.
Comparison of LMCI-converters and LMCI non-converters
Two important goals in AD research are predicting the conversion of MCI to AD and identifying fast and slow disease progression in individual patients. In our established disease progression model, a lower Ratio was related to faster cognitive decline. The next question we examined was whether the model could predict MCI conversion. In the dataset, MCI was subdivided into EMCI and LMCI, and only some LMCI patients converted to AD (LMCI-converters). The comparison between LMCI-converters and LMCI non-converters (Table 5) was performed to see whether the Ratio was a good predictor. The results showed that the mean Ratio of LMCI-converters was always lower than that of LMCI non-converters, regardless of which APOEε4 group they belonged to.
Table 5. Comparison of LMCI-converters and LMCI non-converters. The table was summarised as mean (range).
| Parameter | LMCI non-convertor | LMCI-convertor | ||||
|---|---|---|---|---|---|---|
| Total | 100 | 13 | ||||
| APOEε4 | 0 | 1 | 2 | 0 | 1 | 2 |
| Number | 40 | 40 | 20 | 3 | 7 | 3 |
| Age (year) | 72.1 (48.1–85.4) | 71.7 (56.5–82.7) | 66.5 (58.5–76.2) | 70.2 (67.4–72.8) | 71.7 (65.1–78.8) | 66.6 (64.6–70.1) |
| ADAS-cog | 10.26 (1.00–27.00) | 11.73 (3.00–21.00) | 11.16 (5.00–16.00) | 10.33 (9.00–11.00) | 13.71 (9.00–22.33) | 19.11 (13.33–26.33) |
| Hippo-Campus (mL) | 7.028 (4.087–9.902) | 6.549 (4.425–9.613) | 6.165 (4.338–7.920) | 5.827 (3.858–7.686) | 4.663 (3.514–5.914) | 5.315 (4.704–6.346) |
| Aβ42 (μg/mL) | 203.4 (127.4–304.3) | 146.3 (92.1–263.8) | 122.8 (84.5–156.2) | 208.1 (165.2–249.4) | 140.9 (114.2–163.2) | 112.5 (80.6–137.7) |
| p-tau (μg/mL) | 33.1 (10.8–91.4) | 48.2 (19.1–136.0) | 52.4 (19.5–98.8) | 49.7 (17.0–109.3) | 51.7 (31.4–119.6) | 44.7 (31.7–61.0) |
| The Ratio | 9.38 (1.62–23.59) | 3.72 (1.01–9.30) | 2.67 (1.16–4.64) | 8.47 (1.51–14.67) | 3.49 (0.95–4.86) | 2.6 (1.95–3.32) |
Discussion
Some improvements have been made in our study, compared with previous models. It is assumed that an AD patient will transition from normal to EMCI, then to LMCI, and finally to AD if the observation period is long enough. Due to the nonlinearity of disease progression, the model for one specific disease stage cannot describe the disease progression of another stage. All stages of the disease were considered in our study, including NL, EMCI, LMCI, and AD. Other studies only considered one disease stage, such as MCI or AD. Therefore, our model can be applied to the whole spectrum of AD progression even when disease stage changes. In addition, 7 years of data is available for some individuals, which is beneficial in examining the long-term changes of AD progression. More importantly, we have introduced a novel disease progression model which integrates three endpoints. This model is different from previous ones which empirically model the disease progress with clinical scores only. Instead of treating Aβ42, p-tau and hippocampal volume as covariates, our model utilizes them to develop a timeline disease progression model which can be applied to the entire AD spectrum from normal to dementia. In conventional longitudinal analyses, as treated as covariates, the values of Aβ42, p-tau and hippocampal volume are generally assumed to be time-invariant. In progressive chronic diseases, these assumptions are not realistic because the biological functions may deteriorate over time. Thus, a disease progression model that characterizes the time-varying disease status is desired, which not only describes the change of the score but also the changes of biomarkers and imaging markers. Through our model, people can obtain not only a model of ADAS-cog but also a model of biomarkers, imaging markers and their abnormal ranges. Finally, we have partially achieved the two most important goals in AD study: predicting conversion of MCI to AD and identifying fast and slow disease progression in individuals. As demonstrated by the results, individuals with a lower ratio deteriorate faster and convert from MCI to AD more easily.
The APOE gene encodes a protein called apolipoprotein E, which is a major component of a specific type of lipoprotein called very low-density lipoproteins (VLDLs). The ε4 version of the APOE gene may increase the risk for an individual to develop AD by an unknown mechanism. Some researchers have found that this allele is associated with an increased number of amyloid plaques, while others have found that it is associated with elevated p-tau26. In either case, APOEε4 is related to a decreased Ratio, which is consistent with our findings. The results of this study indicate that each additional copy of the APOEε4 allele may decrease the Ratio by 1.65.
Disease state (DS) is an important factor that influences numerous important progression parameters. From NL to AD, the Ratio will decrease by 1.08 as DS increases by one level. Higher DS level is also related to smaller hippocampal volume, through its influence on EC50. In all disease states, hippocampal volume will decrease with an increase in age. LMCI and AD groups show faster cognitive decline than NL and EMCI groups.
Clinical criteria, which are often subjective and dependent on clinical judgment, are insufficient to identify early stages of AD when considered alone. In recent decades, the use of more objective biochemical and imaging markers, either replacing or complementing these clinical approaches, to facilitate an early and accurate diagnosis of the illness, has been investigated extensively. Studies have shown that individuals with lower levels of CSF Aβ42 and higher levels of p-tau develop AD more frequently. Hence, the Ratio can be used to identify the early stages of AD and explore the subsequent events during AD progression. The combination of these two biomarkers appears to be superior to a single biomarker because only a slight change in either Aβ42 or p-tau is detected over relatively short intervals. Caroli and Frisoni even proposed that the CSF load was nearly disconnected from the disease stage, as they found changes in CSF biomarkers alone were not significantly associated with the annual decline in cognitive and functional scores in MCI and AD groups27. However, the change in the Ratio is more apparent over time because of the opposite tendency shown by the two biomarkers. Furthermore, although there is no doubt that Aβ42 and p-tau are involved in the pathogenesis of AD, the clarified sequence is still unclear. However, the Ratio decreases regardless of which biomarker changes first.
Predicting MCI-convertors is an important goal in AD research. MCI, the most widely used indicator, poorly predicts whether an individual will deteriorate to AD because some patients convert while others remain relatively stable. Various studies of the identification of MCI-converters have been published, which suggests that clinical measures, in combination with CSF biomarkers or imaging markers, may improve the accuracy of conversion forecasting28,29,30. The results of our study suggest that a combination of Ratio and LMCI can improve the predictive accuracy of LMCI-converters. Patients in the LMCI state with a lower Ratio are more likely to convert to AD.
There are some limitations of the present study. To date, CSF biomarkers have only been collected for a limited number of ADNI participants. Due to the relatively small sample size and short follow-up time, especially for AD, we could not make full use of the non-linear mixed effect model, which might be more appropriate for large samples and long periods.
Despite these limitations, this study makes unique contributions. To the best of our knowledge, this is the first study to introduce a model that explicitly describes the entire course of AD by identifying the mathematical relations between the Ratio over time, hippocampal volume with the Ratio, and ADAS-cog with hippocampal volume. Moreover, the same modeling strategy can be readily applied to systematically test hypotheses about the temporal relationships between other biomarkers and other neurodegenerative diseases.
In summary, the developed cascade model was suitable for describing the progression from NL to AD. Baseline disease state (DS) has an impact on all of the three endpoints (the Ratio, hippocampal volume and ADAS-cog), while APOEε4 genotype and age only influence the Ratio and hippocampal volume, respectively. The model provided a suitable tool for clinical trial simulations and could aid in the design of efficient clinical trials in the future. Using the Ratio, we are able to approximate the disease stage of an individual. Clinical measures in combination with the Ratio can improve the accuracy of MCI to AD conversion forecasting.
Author contribution
Wei LU, Tian-yan ZHOU, and Yue QIU designed the research; Yue QIU performed the research; Yue QIU and Liang LI analyzed data; and Yue QIU wrote the paper.
Acknowledgments
Data collection and sharing for this paper was provided by the Alzheimer's disease Neuroimaging Initiative (ADNI, National Institutes of Health Grant U01 AG024904). ADNI is funded by the National Institute on Aging, the National Institute of Biomedical Imaging and Bioengineering, and through generous contributions from the following: Abbott; Alzheimer's Association; Alzheimer's Drug Discovery Foundation; Amorfix Life Sciences Ltd; Astra Zeneca; Bayer Health Care; Bio Clinica, Inc; Biogen Idec Inc; Bristol-Myers Squibb Company; Eisai Inc; Elan Pharmaceuticals Inc; Eli Lilly and Company; F Hoffmann-La Roche Ltd and its affiliated company Genentech, Inc; GE Healthcare; Innogenetics, NV; Janssen Alzheimer Immunotherapy Research & Development, LLC; Johnson & Johnson Pharmaceutical Research & Development LLC; Medpace, Inc; Merck & Co, Inc; Meso Scale Diagnostics, LLC; Novartis Pharmaceuticals Corporation; Pfizer Inc; Servier; Synarc Inc; and Takeda Pharmaceutical Company. The Canadian Institutes of Health Research is providing funds to support ADNI clinical sites in Canada. Private sector contributions are facilitated by the Foundation for the National Institutes of Health (www.fnih.org). The grantee organization is the Northern California Institute for Research and Education, and the study is coordinated by the Alzheimer's Disease Cooperative Study at the University of California, San Diego, USA. ADNI data are disseminated by the Laboratory for Neuro Imaging at the University of California, Los Angeles, USA. This research was also supported by NIH grants P30 AG010129, K01 AG030514, and the Dana Foundation.
References
- Nelson PT, Braak H, Markesbery WR. Neuropathology and cognitive impairment in Alzheimer disease: a complex but coherent relationship. J Neuropathol Exp Neurol. 2009;68:1–14. doi: 10.1097/NEN.0b013e3181919a48. [DOI] [PMC free article] [PubMed] [Google Scholar]
- Sperling RA, Aisen PS, Beckett LA, Bennet DAD, Craft S, Fagan AM, et al. Toward defining the preclinical stages of Alzheimer's disease: Recommendations from the National Institute on Aging-Alzheimer's Association workgroups on diagnostic guidelines for Alzheimer's disease. Alzheimer Dement. 2011;7:280–92. doi: 10.1016/j.jalz.2011.03.003. [DOI] [PMC free article] [PubMed] [Google Scholar]
- Morris JC, Storandt M, McKeel DWJ, Rubin EH, Price JL, Grant EA, et al. Cerebral amyloid deposition and diffuse plaques in “normal” aging: evidence for pre-symptomatic and very mild Alzheimer's disease. Neurology. 1996;46:707–19. doi: 10.1212/wnl.46.3.707. [DOI] [PubMed] [Google Scholar]
- Holford NH, Peace KE. Methodologic aspects of a population pharmacodynamic model for cognitive effects in Alzheimer patients treated with tacrine. Proc Natl Acad Sci U S A. 1992;89:11466–70. doi: 10.1073/pnas.89.23.11466. [DOI] [PMC free article] [PubMed] [Google Scholar]
- Samtani MN, Farnum M, Lobanov V, Yang E, Raghavan N, Dibernardo A, et al. An improved model for disease progression in patients from the Alzheimer's disease neuroimaging initiative. J Clin Pharmacol. 2011;52:629–44. doi: 10.1177/0091270011405497. [DOI] [PubMed] [Google Scholar]
- Gomeni R, Simeoni M, Zvartau-Hind M, Irizarry MC, Austin D, Gold M. Modeling Alzheimer's disease progression using the disease system analysis approach. Alzheimers Dement. 2012;8:39–50. doi: 10.1016/j.jalz.2010.12.012. [DOI] [PubMed] [Google Scholar]
- Mould DR. Models for disease progression: new approaches and uses. Clin Pharmacol Therapeut. 2012;92:125–31. doi: 10.1038/clpt.2012.53. [DOI] [PubMed] [Google Scholar]
- Jack CR, Knopman DS, Jagust WJ, Shaw LM, Aisen PS, Weiner MW, et al. Hypothetical model of dynamic biomarkers of the Alzheimer's pathological cascade. Lancet Neurol. 2010;9:119–28. doi: 10.1016/S1474-4422(09)70299-6. [DOI] [PMC free article] [PubMed] [Google Scholar]
- Mouiha A, Duchesne S. Toward a dynamic biomarker model in Alzheimer's disease. J Alzheimers Dis. 2012;30:91–100. doi: 10.3233/JAD-2012-111367. [DOI] [PubMed] [Google Scholar]
- Clark CM, Xie S, Chittams J, Ewbank D, Peskind E, Galasko D, et al. Cerebrospinal fluid tau and beta-amyloid: how well do these biomarkers reflect autopsy-confirmed dementia diagnoses. Arch Neurol. 2003;60:1696–702. doi: 10.1001/archneur.60.12.1696. [DOI] [PubMed] [Google Scholar]
- Shaw LM, Korecka M, Clark CM, Lee VM, Trojanowski JQ. Biomarkers of neurodegeneration for diagnosis and monitoring therapeutics. Nat Rev Drug Discov. 2007;6:295–303. doi: 10.1038/nrd2176. [DOI] [PubMed] [Google Scholar]
- Liu SJ, Wang JZ. Alzheimer-like tau phosphorylation induced by wortmannin in vivo and its attenuation by melatonin. Acta Pharmacol Sin. 2002;23:183–7. [PubMed] [Google Scholar]
- Hochfeld WE, Lee S, Rubinsztein DC. Therapeutic induction of autophagy to modulate neurodegenerative disease progression. Acta Pharmacol Sin. 2013;34:600–4. doi: 10.1038/aps.2012.189. [DOI] [PMC free article] [PubMed] [Google Scholar]
- Glenner GG, Wong CW. Alzheimer's disease and Down's syndrome: sharing of a unique cerebrovascular amyloid fibril protein. Biochem Biophys Res Commun. 1984;122:1131–5. doi: 10.1016/0006-291x(84)91209-9. [DOI] [PubMed] [Google Scholar]
- Hardy J, Selkoe DJ. The amyloid hypothesis of Alzheimer's disease: progress and problems on the road to therapeutics. Science. 2002;297:353–6. doi: 10.1126/science.1072994. [DOI] [PubMed] [Google Scholar]
- Wang J, Wang Z. Role of melatonin in Alzheimer-like neurodegeneration. Acta Pharmacol Sin. 2006;27:41–9. doi: 10.1111/j.1745-7254.2006.00260.x. [DOI] [PubMed] [Google Scholar]
- Duyckaerts C, Uchihara T, Seilhean D, He Y, Hauw JJ. Dissociation of Alzheimer type pathology in a disconnected piece of cortex. Acta Neuropathol. 1997;93:501–7. doi: 10.1007/s004010050645. [DOI] [PubMed] [Google Scholar]
- Fagan AM, Mintun MA, Mach RH, Lee SY, Dence CS, Shah AR, et al. Inverse relation between in vivo amyloid imaging load and cerebrospinal fluid Abeta42 in humans. Ann Neurol. 2006;59:512–9. doi: 10.1002/ana.20730. [DOI] [PubMed] [Google Scholar]
- Fagan AM, Roe CM, Xiong C, Mintun MA, Morris JC, Holtzman DM. Cerebrospinal fluid tau/beta-amyloid42 ratio as a prediction of cognitive decline in non-demented older adults. Arch Neurol. 2007;64:343–9. doi: 10.1001/archneur.64.3.noc60123. [DOI] [PubMed] [Google Scholar]
- Price JL, Morris JC. Tangles and plaques in non-demented aging and “preclinical” Alzheimer's disease. Ann Neurol. 1999;45:358–68. doi: 10.1002/1531-8249(199903)45:3<358::aid-ana12>3.0.co;2-x. [DOI] [PubMed] [Google Scholar]
- He L, Lu J, Yue Z. Autophagy in ageing and ageing-associated diseases. Acta Pharmacol Sin. 2013;34:605–11. doi: 10.1038/aps.2012.188. [DOI] [PMC free article] [PubMed] [Google Scholar]
- Mummery CJ, Patterson K, Price CJ, Ashburner J, Frackowiak RSJ, Hodges JR. A voxel-based morphometry study of semantic dementia: Relationship between temporal lobe atrophy and semantic memory. Ann Neurol. 2000;47:36–45. [PubMed] [Google Scholar]
- Han Y S, Zheng WH, Bastianetto S, Chabot JG, Quirion R. Neuroprotective effects of resveratrol against β-amyloid-induced neurotoxicity in rat hippocampal neurons: involvement of protein kinase C. Br J Pharmacol. 2004;141:997–1005. doi: 10.1038/sj.bjp.0705688. [DOI] [PMC free article] [PubMed] [Google Scholar]
- Rong XF, Wang XL. An overview of biomarkers in Alzheimer's disease. Yao Xue Xue Bao. 2012;47:551–7. [PubMed] [Google Scholar]
- Apostolova LG, Dutton RA, Dinov ID, Hayashi KM, Toga AW, Cummings JL, et al. Conversion of mild cognitive impairment to Alzheimer disease predicted by hippocampal atrophy maps. Arch Neurol. 2006;63:693–9. doi: 10.1001/archneur.63.5.693. [DOI] [PubMed] [Google Scholar]
- Kester MI, van der Flier WM, Mandic G, Blankenstein MA, Scheltens P, Muller M. Joint effect of hypertension and APOE genotype on CSF biomarkers for Alzheimer's disease. J Alzheimers Dis. 2010;20:1083–90. doi: 10.3233/JAD-2010-091198. [DOI] [PubMed] [Google Scholar]
- Caroli A, Frisoni GB. The Alzheimer's disease neuroimaging initiative. The dynamics of Alzheimer's disease biomarkers in the Alzheimer's disease neuroimaging initiative cohort. Neurobiol Aging. 2010;31:1263–74. doi: 10.1016/j.neurobiolaging.2010.04.024. [DOI] [PMC free article] [PubMed] [Google Scholar]
- Palmqvist S, Hertze J, Minthon L, Wattmo C, Zetterberg H, Blennow K, et al. Comparison of brief cognitive tests and CSF biomarkers in predicting Alzheimer's disease in mild cognitive impairment: six-year follow-up study. PLoS One. 2012;7:e38639. doi: 10.1371/journal.pone.0038639. [DOI] [PMC free article] [PubMed] [Google Scholar]
- Ewers M, Walsh C, Trojanowski JQ, Shaw LM, Petersen RC, Jack CR, Jr, et al. Prediction of conversion from mild cognitive impairment to Alzheimer's disease dementia based upon biomarkers and neuropsychological test performance. Neurobiol Aging. 2012;33:1203–14. doi: 10.1016/j.neurobiolaging.2010.10.019. [DOI] [PMC free article] [PubMed] [Google Scholar]
- Cui Y, Liu B, Luo S, Zhen X, Fan M, Liu T, et al. Identification of Conversion from mild cognitive impairment to Alzheimer's disease using multivariate predictors. PLoS One. 2011;6:e21896. doi: 10.1371/journal.pone.0021896. [DOI] [PMC free article] [PubMed] [Google Scholar]


