

Abstract
Genomic imprinting leads to parent-of-origin specific gene expression and is determined by epigenetic modification of genes. The paternally expressed gene insulin-like growth-factor 2 (IGF2) is located about ∼100 kb from the maternally expressed non-coding gene H19 on human chromosome 11, and both genes play major roles in embryonic and placental growth. Given adverse gestational environments can influence DNA methylation patterns in extra-embryonic tissues, we hypothesized that prenatal exposure to endocrine disrupting chemicals (EDCs) alters H19 and IGF2 methylation in placenta. Our study was restricted to a total of 196 women co-enrolled in the Predictors of Preeclampsia Study and the Harvard Epigenetic Birth Cohort. First trimester urine concentrations of 8 phenols and 11 phthalate metabolites were measured and used to characterize EDC exposure profiles. We assessed methylation of differentially methylated regions (DMRs) by pyrosequencing of H19, IGF2DMR0, and IGF2DMR2 and correlated values with phenol and phthalate metabolites. We also assessed overall expression and allele-specific expression of H19 and IGF2. We found several significant associations between DNA methylation and additive biomarker measurements. A significant decrease in H19 methylation was associated with high level of the sum (Σ) of phthalate metabolites and metabolites of low molecular weight (LMW) phthalates. Σphthalate and LMW phthalate concentrations were inversely associated with IGF2DMR0 methylation values. Variation in methylation was not associated with changes in allele-specific expression. However increased deviation of allele-specific expression of H19 was associated with Σ di(2-ethylhexyl) phthalate metabolites and high molecular weight phthalates. Neither methylation nor expression of these imprinted regions had a significant impact on birth length or birth weight. Overall, our study provides new insight into an epigenetic mechanism that occurs following EDC exposure.
Keywords: Endocrine Disruptors, Epidemiology, Imprinting, Methylation, allele-specific expression
1. Introduction
There is increasing concern over exposure to endocrine disrupting compounds (EDCs) because they can antagonize or mimic the effects of the body's endogenous hormones, such as testosterone, estrogen, or thyroid hormone (Birnbaum 2013). Exposure of children and neonates to these compounds is particularly worrisome because it can potentially impact structural and functional development, which may influence disease manifestation later in life (Barker 1997). The concern over pertubations during early growth has been reinforced by a number of studies that have associated adult diseases, such as hypertension, heart disease, and type 2 diabetes with in utero and early postnatal stressors, including chemical exposure, maternal caloric restriction, and prenatal stress (Eubig et al. 2010; Markham and Koenig 2011; Roseboom et al. 2011). This “fetal programming” permanently alters fetal physiology as a result of environmental conditions.
Phthalates and phenols are widely studied due to ubiquitous human exposure to these classes of suspected EDCs. Phthalates, diesters of phthalic acid, are a family of synthetic chemicals widely in a variety of consumer products. High molecular weight phthalates, such as di(2-ethylhexyl) phthalate (DEHP), are commonly used as plasticizers in flexible plastic used in flooring, wall coverings, food contact applications and medical devices (Hauser and Calafat 2005; Koch and Calafat 2009). Low-molecular weight phthalates, such as diethyl phthalate (DEP) are used as solvents in personal care products such as lotion, and in lacquers, varnishes and coatings (Meeker et al. 2009a). Exposure to phthalates may occur via dietary ingestion, percutaneous absorption, and parenteral exposure from medical devices (Hauser and Calafat 2005; Koch and Calafat 2009). Bisphenol A (BPA) is one of the most widely studied phenols, which is commonly used in the manufacture of polycarbonate plastics, thermal paper and epoxy resins used in the lining of food cans (Calafat et al. 2008a). Other phenols include triclosan (TCS), an antimicrobial agent found in soap (Calafat et al. 2008a), and benzophenone-3 (BP3), a phenol used in sunscreen to absorb ultraviolet radiation (Calafat et al. 2008b).
There is accumulating evidence that epigenetic mechanisms play an important role in modulating gene-environment interactions. Due to their involvement in embryogenesis and placental development and growth, imprinted genes may play a particularly important role in the developmental origins of disease. Genomic imprinting refers to the epigenetic mechanism through which a subset of genes are monoallelically expressed in a parent-of-origin specific manner. The majority of imprinted genes are located in clusters of differentially methylated regions (DMRs), including imprinting control regions (ICRs) (Reik and Walter 2001). Insulinlike growth factor 2 (IGF2) and H19 are two reciprocally expressed imprinted genes located on chromosome 11p15.5 that play a major role in fetal and placental growth. The paternally expressed IGF2 encodes insulin-like growth factor II, which is a mitogen involved in embryonic growth. Maternally expressed H19 is located approximately 130kb downstream of IGF2, and encodes for a non-coding RNA, which down regulates cellular proliferation (Gabory et al. 2006; Gabory et al. 2010).
Several animal and human epidemiologic studies have indicated that adverse gestational environments such as famine, low dietary folate, pre-eclampsia, gestational diabetes, maternal alcohol consumption and smoking can influence DNA methylation in the offspring and placenta, as well as future disease risk (Waterland et al. 2006; Nomura et al. 2013; Haycock and Ramsay 2009; Suter et al. 2011). However, few studies have examined epigenetic profiles in tissues following exposure to phenols or phthalates. We hypothesized that prenatal exposure to EDCs may alter the epigenetic profile of human tissues. We chose to analyze placenta tissue, given its critical role in regulating fetal growth. Our study population consisted of 179 women enrolled in two Boston-Based birth cohorts with information on first-trimester exposure to 11 phthalates and 8 phenols. The primary aim in this study was to evaluate if maternal first trimester urinary concentrations of phthalates and phenols biomarkers were correlated with DNA methylation and allele-specific expression of H19 and IGF2 in placenta samples.
2. Materials and Methods
2.1 Study population
Our study population consisted of women concurrently enrolled in two large birth cohorts, the Harvard Epigenetic Birth Cohort (HEBC) and the Predictors of Preeclampsia Study (POPS) at the Brigham and Women's Hospital (BWH) in Boston, MA. The HEBC was started to study prenatal determinants of epigenetic markers in cord blood and placenta. The HEBC comprises 1,941 mother-child dyads, and data and biospecimens were collected from June 2007 to June 2009-(Michels et al. 2011). The POPS study is a prospective study of women beginning their prenatal care within clinics and private practices affiliated with the Brigham and Women's Hospital (N=1,608) in 2007. Urine samples were gathered at the first prenatal visit (<16 weeks gestation), and at 4 additional visits during pregnancy. Additional information about this cohort has been published elsewhere (McElrath et al. 2012). Our study was restricted to a total of 196 women enrolled in both studies who contributed a first-trimester urine sample between 2007 and 2009. Methylation and allele-specific analysis experiments were restricted to women-infant dyads who did not give birth to twins, had information on infant sex, and had available placenta for RNA processing, resulting in a final sample size of 179. Study participant characteristics for these 179 women are listed in Table 1.
Table 1. Characteristics of Study Participants Used to assess Association between H19 and IGF2 Methylation and EDC Burden.
| Characteristics | |
| Pre-pregnancy BMI* (kg/m2), Mean (SD) | 25.45 (5.74) |
| Maternal Age (yrs), Mean (SD) | 32.91 (5.01) |
| Ethnicity | |
| White non-Hispanic, N (%) | 126 (70.39) |
| Hispanic or Latino, N (%) | 25 (14.00) |
| Asian/Pacific-Islander, N (%) | 5 (2.79) |
| Black/African-American, N (%) | 23 (12.85) |
| Infant Sex | |
| Female, N (%) | 94 (51.93) |
| Male, N (%) | 85 (46.96) |
| Smoke During Pregnancy | |
| No, N (%) | 174 (97.21) |
| Yes, N (%) | 5 (2.79) |
| Maternal Conditions (chart abstracted) | |
| Gestational Diabetes, N (%) | 10 (5.59) |
| Pregnancy-Induced Hypertension, N (%) | 8 (4.47) |
| Preeclampsia, N (%) | 1 (0.56) |
| Mode of Delivery (nmiss=4) | |
| Spontaneous, N (%) | 37 (20.67) |
| Induced, N (%) | 28 (15.64) |
| Caesarean Section, N (%) | 110 (61.45) |
| Neonatal Characteristics | |
| Gestational Age (wks), Mean (SD) | 39.01 (1.24) |
| Birth Weight (g), Mean (SD) | 3471.63 (456.44) |
| Birth Length (cm), Mean (SD) | 49.45 (2.37) |
BMI=Body Mass Index
2.2 Ethics Statement
The participation of human subjects occurred after informed consent was obtained. The study protocols were approved by the Institutional Review Board of the Brigham and Women's Hospital.
2.3 Urine sample collection
Urine samples from the first prenatal visit (<16 weeks) were collected in polypropylene urine cups and frozen at −80°C. Subsequently, samples were defrosted at 4°C overnight. Each sample was vortexed well and specific gravity (SG) was measured at BWH using a handheld refractometer (Atago, Bellevue, WA) that was calibrated with deionized water before each measurement. After another round of vortexing, samples were aliquoted to 1.6 mL polypropylene tubes and refrozen at -80°C. For each participant, one tube was shipped on dry ice overnight to the CDC for measurement of urinary concentrations of phthalate metabolites and phenols.
2.4 Urinary phthalate and phenol concentrations
Urinary concentrations of 8 phenols and 11 phthalate metabolites were measured using the on-line solid phase extraction-high performance liquid chromatography-isotope dilution-tandem mass spectrometry approaches described previously (Silva et al. 2008; Ye et al. 2005). We measured concentrations of total (free plus conjugate) species. Quality control materials, prepared at the CDC with pooled human urine, were analyzed in each batch along with standard, blank, and study samples. The limit of detection (LOD) ranged from 0.2 to 1.2 μg/L for phthalates and from 0.2 to 2.3 μg/L for phenols.
2.5 Sample Prep
Placenta samples were collected immediately following delivery in the sub-sterile room (if patient was in the operating room) or in the soiled utility room (patient gave vaginal delivery). Collected placenta tissues for DNA extraction were snap-frozen and stored in liquid nitrogen. Tissues for RNA extraction were stored in RNAlater (Ambion, Carlsbad, CA) at −20°C until further processing. All placenta samples used in this study were taken from the upper layer near the cord (Near Upper; NU), consisting of predominantly fetal cells.
2.6 DNA Isolation
DNA was isolated from placenta tissue using the QIAmp DNA Mini Kit (Qiagen, Hilden, Germany) according to manufacturer's instructions.
2.7 Bisulfite Conversion and DNA Methylation Asssays
Bisulfite conversion of placenta DNA was performed according to manufacturer's instructions (alternate protocol 2) using the EZ-96 DNA Methylation Kit (Zymo Research, Irvine, USA). Bisulfite conversion was performed in duplicate for every sample.
2.8 DNA methylation assays
Pyrosequencing was performed on duplicate bisulfite-converted DNA samples using the Pyromark Q24 pyrosequencer (Qiagen, Hilden, Germany) as previously described (Rancourt et al. 2012). Percent methylation was assessed across CpG sites within the following DMRs: IGF2DMR0 (6 CpG sites), IGF2DMR2 (7 CpG sites), and H19 (8 CpG sites) and the mean of the duplicate measures was used for statistical analyses. Two assays with 3 CpG sites each were used to analyze IGF2DMR0 methylation, and the average of all 6 CpG sites were used for our analyses. Primers are listed in Supplementary Table 1.
2.9 RNA Isolation
Using the mirVANA RNA Isolation Kit (Ambion Inc., Austin, TX), RNA was isolated according to the manufacturer's protocol.
2.10 Allele-specific expression assays
H19 and IGF2 genotyping assays were performed on 25 ng of cord blood genomic DNA as previously described (Rancourt et al. 2013). cDNA was synthesized with the High Capacity cDNA Reverse Transcrition Kit (Applied Biosystems, Foster City, USA). Allele-specific expression was performed in duplicate as previously described (Rancourt et al. 2013). Briefly, SNP analysis was performed on cDNA with the Pyromark Q24 pyrosequencer (Qiagen). Primer sequence and chromosomal locations for pyroassays are listed in Supplementary Table 2. Pyrosequencing allele-specific values are reported as the average of the two duplicates of percentage of expression from each allele, adding up to 100%. The expected value of allele-specific expression for an imprinted gene is 100% expression from one of the parental alleles and 0% from the other.
2.11 qRT-PCR
Overall expression of H19 and IGF2 was performed on the subset of samples used for allele-specific expression (n=124) using qRT-PCR. The qRT-PCR was performed using predesigned PrimeTime qPCR Assays for H19 and IGF2 from Integrated DNA Technologies (IDT). The qRT-PCR reaction was performed with TaqMan Gene Expression Master Mix (Applied Biosystems) according to manufacturer's instructions on a Life Technologies 7900HT qPCR machine at the Harvard Medical School ICCB Screening Facility with reverse transcription controls. The qRT-PCR cycling conditions were as follows: 50°C for 2 min, 95°C for 10 min, 40 cycles of 95°C for 15 sec and 60°C for 60 sec. All qRT-PCR data was normalized using the PrimeTime GAPDH Assay (IDT). Delta Ct (ΔCt) was defined as the expression difference between the target gene and GAPDH: ΔCt = CtGene of Interest − CtGAPDH. All samples were analyzed in triplicate.
2.12 Statistical analysis
Urine dilutions were normalized using SG, which is less sensitive to pregnancy stage than urinary creatinine (Williams 2005). Dilution adjustment was performed using the formula Pc=P[(1.014 −1)/(SG-1)] (Boeniger et al. 1993; Teass A 1998), where Pc is the specific gravity-corrected phthalate/phenol concentration, P is the observed phthalate/phenol concentration, SG is the specific gravity of the urine sample, and 1.014 is the median SG of the study population. Due to the inadequate purity of analytic standards, we applied a correction factor of 0.66 to monoethyl phthalate (MEP) and 0.72 to monobenzyl phthalate (MBzP) (CDC 2012) before the statistical analysis. Urinary concentrations of phenols and phthalates below the LOD were given an imputed value equal to one-half of the LOD (Hornung RW 1990). To assess the sensitivity of our results to the method of dealing with low metabolite levels, we imputed another commonly used value in this context, LOD/sqrt(2). Given these results were of similar magnitude and did not change any of our interpretations, we only reported the estimates based on imputing LOD/2. To reduce the influence certain compounds on summations to estimate EDC burden associated with molecular weight, concentrations were converted to mol/L.
Collinearity between individual compounds was initially explored by estimating the Spearman correlation for each pairwise combination of phenols and phthalates metabolites. To determine the degree to which we could capture the variation in one compound based on metabolites with similar characteristics, we predicted the log transformed concentration of each compound based on the log transformed summation of all other compounds (and other specified groupings) in linear models. Given the violation of the constant variance assumption for some compounds, inference based on the model parameters was precluded, but the estimates were valid. Therefore we assessed predictive precision by estimating the Spearman correlation between the log(concentrations) predicted by our model and the actual log(concentration) of each compound. Considering all possible groupings of other phthalates, we determined the subgroup of phthalates for which the summation provided the most significant correlation between the actual and predicted log(concentrations) of each metabolite. After determining this informative subgroup for each phthalate metabolite, we defined the most predictive subgroup overall as the phthalates were represented among the at least two of informative subsets. This procedure was repeated for the phenols. Significance was determined at α-level=0.05, correcting for multiple testing using the Bonferroni-Holm approach.
Methylation level was modeled as a function of log transformed EDC urinary concentration, adjusting for relevant covariates. All models were adjusted for infant sex, maternal smoking and maternal age. Based on robust standard errors, a Wald test was utilized to identify statistically significant (p<0.05) changes in methylation associated with EDC concentrations and possible additive interactions between EDC concentrations and infant sex on methylation. Among models for which this interaction was significant, the association between EDC concentrations and methylation was reported separately for males and females. Similar models were used to model overall expression of H19 and IGF2. Among a subset of the study population, a generalized linear model was used to model deviation from allele-specific expression, specifying a gamma distribution, and using the log link. Model coefficients and 95% confidence intervals were exponentiated to provide the relative loss of allele-specific expression associated with an increase in EDC exposure. These models for allele-specific expression were adjusted for maternal age, and effect modifications by sex were assessed by adding an interaction term between EDC exposure and infant sex. Mode of delivery could introduce unwanted variation in RNA levels if associated with RNA stability. However, it was not a significant predictor of either overall expression (IGF2 Deviance test; p=0.86; H19 Deviance test; p=0.60) or deviation from allele-specific expression (IGF2 Deviance test; p=0.45; H19 Deviance test; p=0.41), and therefore was not included our models. The data was analyzed using R version 3.0.2 software and visualized using the ggplot2 package.
3. Results
3.1 Correlations of urinary concentrations of phthalate metabolites and phenols in first-trimester pregnant women
We measured 11 phthalate metabolites and 8 phenols in first trimester urine samples from 196 women (summarized in Supplementary Tables 3 and 4). To explore shared variation between individual phthalates and phenols, we performed pair-wise Spearman correlations (Supplementary Figures 1 and 2). Among the phthalates, moderate correlations were observed between compounds of a similar molecular weight, with very strong correlations between DEHP metabolites. Generally, we observed weaker correlations between individual phenols, with the strongest estimated association between methyl paraben (MePB) and propyl paraben (PrPB) (p=0.80). Between the individual phthalate concentrations with phenol concentration (Supplementary Figure 3), a few compound concentrations showed statistically significant, albeit low, correlations with each other, including Bisphenol A (BPA) and Monocarboxyoctyl phthalate (MCOP) (ρ=0.30). However, overall the phenols and phthalates were not highly correlated with one another.
This shared variation among specific groupings of compounds precludes discerning the impact of an individual phenol or phthalate. Among closely correlated compounds, the downstream impact of one may be inappropriately attributed to another. Given observational data, EDC profiles are therefore best summarized by summations of informative categories of compounds. To assess how well each metabolite was captured by these categories, we evaluated the precision with which we could predict urinary concentrations of individual compounds based on the summation of all other compounds and by specific groupings of other compounds. For example, among the metabolites of high molecular weight phthalates, we predicted the concentrations of each metabolite based on the log transformed summation of all other metabolites of high molecular weight phthalates (Figure 1). Categorizing the phthalate and phenol metabolites into specific groups (molecular weight, DEHP metabolite, or paraben status) generally increased the correlations between the actual and predicted compound level as compared to the summation of all phthalate or phenol metabolites.
Figure 1. Summary of Spearman Correlation Coefficients Values for Predicted (A) Phthalates and (B) Phenols Concentrations.

We calculated the spearman correlation coefficient between the actual and predicted concentrations of phthalate metabolites (A) and phenols (B) For phthalates, we calculated these values between each individual metabolite and the following groups of metabolites: across all other compounds, grouped by molecular weight (high vs low), DEHP metabolites, the compounds that are the most predictive for the individual phthalate, and the most predictive compounds overall. For phenols, we calculated these values between each individual phenol and the following groups of phenols: across all other compounds, grouped by paraben status, the compounds that are the most predictive for the individual phenol, and the most predictive compounds overall. Increased red shading refers to increased values for spearman correlation coefficient.
By considering all possible groupings, we determined the subgroup of other phthalates for which the log transformed summation provided the most significant Spearman correlation between the actual and predicted log (concentrations) of each compound (Supplementary Figure 4). Several individual phthalates were present in this most informative subgroup for a number of other compounds. For instance, including MnBP urinary concentrations in this summation provided the most significant correlation between predicted and actual levels for MBzP, MEP, and MiBP concentrations. As shown in Figure 1, each phthalate and phenol is strongly correlated with the summation of their most predictive subgroup.
After determining this informative subgroup for each phthalate metabolite, we defined the most predictive subgroup overall as the metabolites represented in at least two of the most informative subgroups. For phthalates, this list was composed of MnBP, MCOP, MCPP, MEHHP, MEOHP, MiBP. The most predictive subgroup of phenols included 2,4DCP, 2,5DCP, BuPB, BPA, and MePB. When using this most predictive subset, we estimated significant Spearman correlation between actual and predicted concentrations for every phthalate except for MCNP and MEP. For phenols, these statistics were significant for only PrPB, MePB, BuPB, and 2,5-DCP. These statistical methods illustrate that a relatively high proportion of the variability in the concentrations of several EDCs can be predicted by the concentrations of all the other compounds.
3.2 Associations between DNA Methylation of IGF2 and H19 and urinary concentrations of individual phthalates and phenols biomarkers
Table 1 lists the participant characteristic for the women who were included in our methylation analyses. Three germ-line derived DMRs were analyzed to measure methylation levels of H19 and IGF2. Pyrosequencing assays were performed to measure percent methylation across CpG sites within the following DMRs: IGF2DMR0 (6 CpG sites), IGF2DMR2 (7 CpG sites), and H19 (8 CpG sites). Ranges of methylation levels averaged across all CpG sites for all individuals were 27-52% for H19, 37-63% for IGF2DMR0, and 16-42% for IGF2DMR2. Inter-individual variation across CpG loci of each DMR was relatively constant; therefore the average methylation level across the CpG sites for each DMR was used in all analyses. The mean methylation of H19 and IGF2 did not significantly vary by infant sex (univariate test; T=-0.692, p=-0.490; T=-0.346, p=0.730, respectively).
To explore the impact of prenatal EDC exposure on placental DNA methylation, we modeled DNA methylation as a function each individual, log transformed, maternal urine phthalate and phenol metabolites concentrations, adjusting for maternal age, smoking status, and infant sex (Table 2). To investigate whether sex modified the association between EDC concentration and methylation on the additive scale, an interaction term was added to these models. Among models for which this interaction was statistically significant, the association between EDC concentration and methylation was reported separately for males and females (Table 3). No statistically significant associations were found between maternal urine concentrations of individual phthalate metabolites and placenta H19 or IGF2DMR2 DNA methylation. For both male and female infants, an increase in MEOHP or MEP was associated with decreased methylation in IGF2DMR0 methylation. The urinary concentrations of three of the four metabolites of di(2-ethylhexyl) phthalate (DEHP) measured were significantly associated with decreased IGF2DMR0 methylation in placenta samples from female infants, but were not associated with methylation levels in placenta samples from male infants (Table 3). In contrast to phthalates, there was little evidence that individual phenol concentrations were correlated with the analyzed DNA methylation. While the associations between urinary concentrations of methyl paraben (MePB), butyl paraben (BuPB) and triclosan and IGF2DMR2 DNA methylation were significantly different between male and female placenta samples, only higher BuPB and MePB levels were significantly associated with decreased IGF2DMR2 DNA methylation in male placentas. No significant associations were found for H19 or IGF2DMR0.
Table 2. Association between H19, IGF2DMR2, and IGF2DMR0 Placenta DNA Methylation and Maternal Phthalate and Phenol Metabolites Urine Concentrations.
| Change in Methylation per log(mol/L) (95% CI) ‡ | |||
|---|---|---|---|
| H19 | IFG2 DMR0 | IFG2 DMR2 | |
| Phthalates | |||
| MnBP | -0.150 (-0.575, 0.274) | -0.217 (-0.786, 0.351) | -0.548 (-1.197, 0.101) |
| MBzP | -0.142 (-0.454, 0.170) | 0.195 (-0.193, 0.583) | 0.099 (-0.369, 0.567) |
| MCNP | -0.028 (-0.493, 0.438) | -0.381 (-0.825, 0.063) | 0.322 (-0.218, 0.863) |
| MCOP | 0.112 (-0.187, 0.412) | 0.141 (-0.227, 0.509) | 0240 (-0.276, 0.756) |
| MCPP | 0.174 (-0.082, 0.431) | 0.060 (-0.294, 0.413) | 0.050† (-0.484, 0.584) |
| MECPP | -0.161 (-0.429, 0.108) | -0.406*† (-0.78, -0.032) | 0.121 (-0.343, 0.584) |
| MEHHP | -0.081 (-0.320, 0.158) | -0.321† (-0.647, 0.004) | 0.033 (-0.389, 0.455) |
| MEHP | 0.092 (-0.117, 0.302) | -0.233† (-0.542, 0.076) | -0.004 (-0.405, 0.397) |
| MEOHP | -0.088 (-0.335, 0.159) | -0.349* (-0.684, -0.014) | 0.049 (-0.387, 0.485) |
| MEP | -0.278 (-0.573, 0.016) | -0.350* (-0.673, -0.027) | -0.266 (-0.707, 0.175) |
| MiBP | -0.138 (-0.539, 0.262) | -0.185 (-0.73, 0.359) | -0.543 (-1.221, 0.134) |
| Phenols | |||
| DCP | 0.173 (-0.145, 0.492) | 0.046 (-0.307, 0.399) | -0.207 (-0.709, 0.295) |
| 2,5-DCP | 0.002 (-0.225, 0.229) | 0.087 (-0.204, 0.378) | -0.089 (-0.436, 0.258) |
| BuPB | 0.094 (-0.105, 0.294) | 0.091 (-0.150, 0.332) | -0.188† (-0.499, 0.122) |
| BP-3 | 0.157 (-0.018, 0.333) | 0.001 (-0.211, 0.213) | 0.061 (-0.23, 0.351) |
| BPA | 0.091 (-0.275, 0.457) | -0.182 (-0.681, 0.316) | -0.098 (-0.935, 0.74) |
| MePB | 0.093 (-0.190, 0.375) | 0.015 (-0.322, 0.351) | -0.084† (-0.563, 0.394) |
| PrPB | 0.079 (-0.133, 0.290) | -0.077 (-0.322, 0.167) | -0.302 (-0.677, 0.074) |
| TCS | 0.089 (-0.103, 0.280) | -0.096 (-0.298, 0.106) | 0.002† (-0.303, 0.307) |
Adjusted for maternal age, smoking status, and infant sex.
p<0.05 for compound.
p<0.05 for interaction by infant sex.
Coeff=Coefficient, CI=Confidence Interval
Table 3.
Comparison of H19, IGF2DMR2, and IGF2DMR0 Placenta DNA Methylation and Maternal Phthalate and Phenol Metabolite Urine Concentrations for Categories with Significant Interactions by Sex of Infant. Estimated change in methylation per log(mol/L) increase in metabolite.
| IFG2 DMR0‡ | ||
| Phthalates | Males Coeff (CI) | Females Coeff (CI) |
| MECPP | 0.071 (-0.381, 0.523) | -0.925* (-1.528, -0.323) |
| MEHHP | 0.005 (-0.395, 0.405) | -0.689* (-1.217, -0.160) |
| MEHP | 0.120 (-0.350, 0.591) | -0.593* (-1.004, -0.181) |
| IFG2 DMR2‡ | ||
| Phthalates | Males Coeff (CI) | Females Coeff (CI) |
| MCPP | 0.618 (-0.008, 1.244) | -0.584 (-1.382, 0.214) |
| Phenols | ||
| BuPB | -0.522* (-0.894, -0.151) | 0.110 (-0.338, 0.557) |
| MePB | -0.645* (-1.259, -0.031) | 0.440 (-0.239, 1.118) |
| TCS | -0.386 (-0.841, 0.069) | 0.232 (-0.169, 0.633) |
Adjusted for maternal age, smoking status, and sex of infant.
p<0.05 within sub-group.
Coeff=Coefficient, CI=Confidence Interval
3.3 Associations between DNA Methylation of IGF2 and H19 and additive urinary concentrations of phthalates and phenols biomarkers
Due to the observed correlation between several phenol and phthalates, it is possible that the associations between individual compounds and methylation are confounded by other metabolites. For this reason, we decided to summarize EDC profiles by summations of compounds with similar characteristics, which have demonstrated shared variation. To investigate any interaction between total phenol and phthalate burden on methylation, methylation was modeled as additive contribution of a log transformed summation of phthalates, a log transformed summation of phenols, and an interaction between these two variables, adjusting for maternal age, smoking status, and infant sex. For all DMRs analyzed, there was no statistically significant interaction between total phenol and phthalate burden on methylation (Supplementary Figure 5). Therefore, we evaluated how additive concentrations of phthalates and phenols metabolites separately correlate with DNA methylation of imprinted genes. For phthalates, we categorized body burden into four different categories: ΣPhthalates (all phthalates), High Molecular Weight (HMW), LMW, and DEHP metabolites. For phenols, we categorized body burden into three groups: ΣPhenols (all phenols), Paraben, and Non-Paraben. Similarly to our individual chemical calculations, we investigated significant interactions between body burden EDC urinary concentrations and infant sex.
For additive phthalate groups, we found LMW phthalate concentrations inversely associated with H19 methylation values in placenta (a decrease of -0.38% per log(mol/L); [Confidence interval -0.73%, -0.02%]; Figure 2). Similarly, Σphthalates were inversely associated with H19 methylation values in placenta (a decrease of 0.46% per log(mol/L); [Confidence interval -0.86%, -0.05%%]). Σphthalate, DEHP, and LMW phthalate concentrations were inversely associated with IGF2DMR0 methylation values (decrease of 0.55% [Confidence interval -0.97%, -0.14%], and 0.41% [Confidence interval -0.789%, -0.025%] per log(mol/L), respectively). The associations between DEHP metabolite concentrations and IGF2DMR0 were statistically significantly different for placentas from male and female infants. DEHP metabolite (decrease of 0.80% per log(mol/L) [Confidence interval -1.363%, -0.24%]) concentrations were inversely correlated with IGF2DMR0 methylation in placentas from female infants. HMW concentrations were not associated with IGF2DMR0 methylation values in placentas from male or female infants. Additionally, no statistically significant interactions were found for maternal urine Σphthalate metabolite concentrations and infant's sex on IGF2DMR2 DNA methylation values.
Figure 2. Comparison of H19, IGF2DMR2, and IGF2DMR0 DNA Methylation and Additive Maternal Phthalate Urine Concentrations.
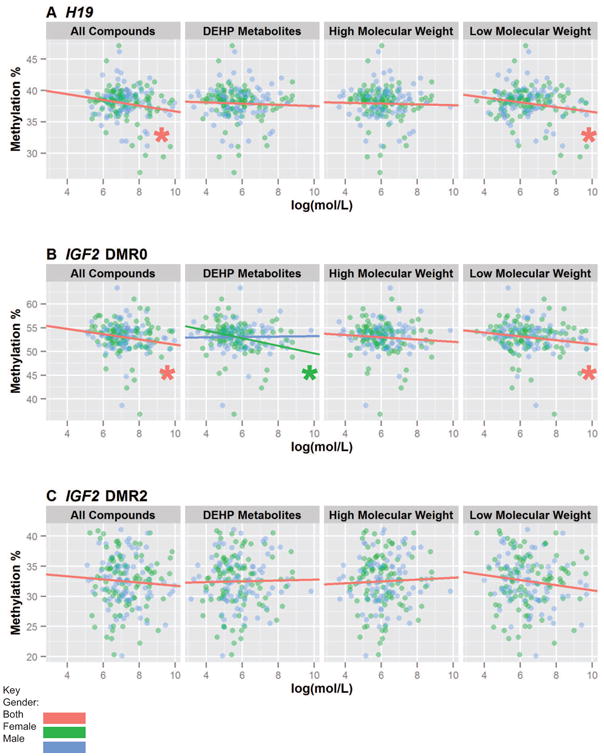
Shown are the correlations between A) H19, B) IGF2DMR0, and C) IGF2DMR2 placental DNA methylation with additive phthalate biomarker measurements. Phthalates were categorized into Σphthalates, DEHP metabolites, low molecular weight compounds, and high molecular weight compounds. A Wald test was performed to identify if sex had a significant interaction with methylation. If it did not, the overall association between EDC and methylation was reported independently, and if it was, the association was reported separately for males and females. (*p<0.05)
We also investigated how the urinary concentrations of phenol groups (ΣPhenols, Paraben, and Non-Paraben) correlated with methylation of these imprinted genes (Figure 3). In contrast to the phthalate categories, we did not find any statistically significant associations with infant's sex or EDC levels on H19 or IGF2DMR0 methylation levels. The associations between Σphenol and paraben concentrations and IGF2DMR0 were statistically significantly different for placentas from male and female infants. Decreased methylation values for IGF2DMR2 were associated with both increased Σphenols (decrease of 0.66% per log(mol/L)[Confidence interval -1.25%, -0.06%]) and parabens (decrease of 0.67% per log(mol/L)[Confidence interval -1.26%, -0.07%]) urine concentrations, but only in males.
Figure 3. Comparison of H19, IGF2DMR2, and IGF2DMR0 DNA Methylation of the Placenta and Additive Maternal Phenol Urine Concentrations.
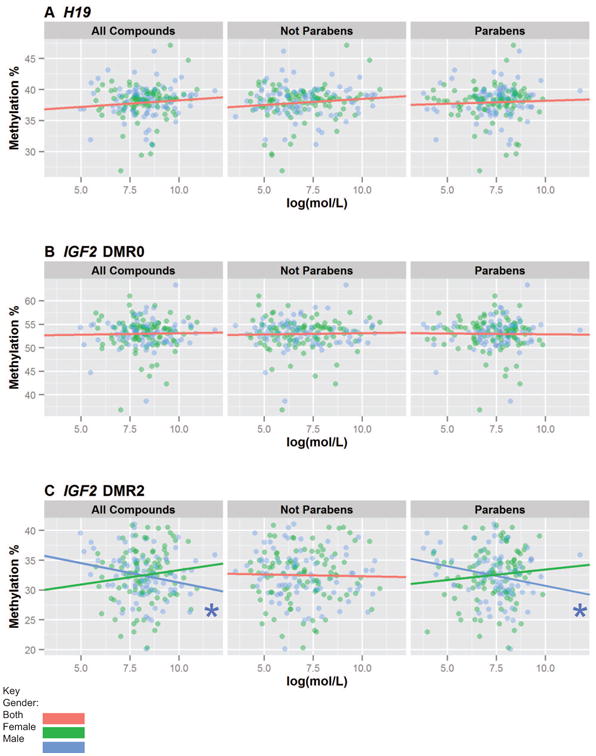
Shown are the correlations between A) H19, B) IGF2DMR0, and C) IGF2DMR2 placental DNA methylation with additive phenol biomarker measurements. Phenols were categorized into Σphenols, additive parabens, and additive non-parabens. A Wald test was performed to identify if sex had a significant interaction with methylation. If it did not, the overall association between EDC and methylation was reported independently, and if it was, the association was reported separately for males and females. (*p<0.05)
3.4 Associations between overall and allele-specific expression of IGF2 and H19, urinary concentrations of phthalates and phenols biomarkers, and birth outcomes
While DNA methylation contributes to its control, imprinting is defined by the expression of one of the parentally inherited alleles, and repression of the other. Allele-specific expression was analyzed among a subset of informative individuals: 67 individuals heterozygous for the rs2585 SNP within the coding region of IGF2, and 78 individuals heterozygous for rs3741219 within the H19 transcript. Maternal and fetal characteristics were not significantly different between the entire study population and these subgroups (Supplementary Table 5). Prior studies have indicated there is normal variation in imprinting maintenance, which has lead others to create three relatively lenient categories of imprinting status (Rancourt et al. 2013): Loss of imprinting (LOI) as between 40 and 60% expression from each allele; relaxation of imprinting (ROI) from 25 to 39 and 61 to 75%; and normal imprinting from 0 to 24 and 76 to 100%. Imprinting of IGF2 was normal for all placenta samples. LOI and ROI at H19 was observed in 3% (n=3) and 12% (n=10) of the placenta samples, respectively (Table 4). We did not observe ROI or LOI for IGF2. Considering the variability of allele-specific expression in H19, we modeled deviation from allele-specific expression of one allele as a function of EDC exposure, adjusting for maternal age and infant sex (Table 5). The associations between HMW and DEHP metabolites and H19 expression were significantly different for placentas from male and female infants, therefore we reported these separately (Table 6). Among males, an increase in HMW and DEHP concentrations was associated was associated with an approximate 10% greater deviation from H19 allele-specific expression (Table 6). Allele-specific expression was not associated with methylation of either H19 or IGF2 DMRs (Supplementary Figure 6). However, when we excluded three influential points from the analysis of H19, one observation with low methylation and the observations with the highest methylation levels, we did observe significant increased deviation from allele-specific expression associated with decreased methylation (ρ= -0.34, p=0.003).
Table 4. Prevalence of LOI and ROI for H19 and IGF2.
| H19 | ||
| Normal Imprinting n (%) | Relaxation of Imprinting n (%) | Loss of Imprinting n (%) |
| 72 (85%) | 10 (12%) | 3 (3%) |
| IGF2 | ||
| Normal Imprinting n (%) | Relaxation of Imprinting n (%) | Loss of Imprinting n (%) |
| 74 (100%) | 0 (0%) | 0 (0%) |
Table 5. Relative deviation from allele-specific expression of H19 associated with an increase in EDC burden.
| Relative Deviation in Allele-specific Expression per log(Σmol/L) (95% CI) ‡ | |
|---|---|
| Phthalates | |
| HMW | 1.019† (0.957, 1.084) |
| LMW | 0.976 (0.924, 1.031) |
| DEHP | 1.018† (0.963, 1.075) |
| ΣPhthalates | 0.991 (0.923, 1.064) |
| Phenols | |
| Parabens | 0.965 (0.917, 1.016) |
| Non-Parabens | 1.012 (0.974, 1.05) |
| ΣPhenols | 0.991 (0.94, 1.044) |
Adjusted for maternal age, smoking status, and infant sex.
p<0.05 for compound.
p<0.05 for sex interaction.
Coeff=Coefficient, CI=Confidence Interval
Table 6. Significant effect modification by sex on the impact of EDC burden on the relative deviation from allele-specific expression and overall expression of H19.
| Relative Deviation in Allele-specific Expression per log(mol/L) (95% CI) ‡ | ||
| Phthalates | Males | Females |
| HMW | 1.107* (1.016, 1.207) | 0.945 (0.873, 1.023) |
| DEHP | 1.096* (1.011, 1.188) | 0.959 (0.895, 1.028) |
| Change in Expression (ΔCt) per log(mol/L) (95% CI) ‡ | ||
| Phthalates | Males | Females |
| ΣPhthalates | -0.324* (-0.627, -0.021) | 0.053 (-0.112, 0.218) |
Adjusted for maternal age, smoking status, and infant sex.
p<0.05 within sub-group.
Coeff=Coefficient, CI=Confidence Interval
Considering that methylation changes may impact overall expression, we also analyzed overall expression of H19 and IGF2 by qRT-PCR. IGF2DMR2 and H19 methylation were not associated with overall expression, but we observed a weak correlation between IGF2DMR0 methylation and overall expression (ρ=0.25, p=0.006). When we investigated possible associations between overall expression and metabolite levels, we did not find any significant associations between IGF2 overall expression and EDC burden (Table 7). An increase in total phthalates was associated with a decrease in H19 expression, but only among males (Table 7).
Table 7. Association between H19, and IGF2 gene expression and Additive Maternal Phthalate and Phenol Metabolites Urine Concentrations.
| Change in Expression (ΔCt) per log(mol/L) (95% CI) ‡ | ||
|---|---|---|
| H19 | IGF2 | |
| Phthalates | ||
| HMW | -0.033 (-0.171, 0.106) | -0.105 (-0.298, 0.089) |
| LMW | -0.081 (-0.243, 0.081) | -0.023 (-0.281, 0.236) |
| DEHP | -0.035 (-0.156, 0.087) | -0.133 (-0.311, 0.046) |
| ΣPhthalates | -0.118† (-0.303, 0.067) | -0.118 (-0.406, 0.17) |
| Phenols | ||
| Parabens | 0.099 (-0.016, 0.215) | 0.096 (-0.089, 0.282) |
| Non-Parabens | 0.061 (-0.034, 0.156) | 0.024 (-0.106, 0.155) |
| ΣPhenols | 0.112 (-0.003, 0.227) | 0.090 (-0.089, 0.268) |
Adjusted for maternal age, smoking status, and infant sex.
p<0.05 for compound.
p<0.05 for sex interaction.
Coeff=Coefficient, CI=Confidence Interval
Also, we did not observe any associations between methylation, allele-specific expression, or overall expression and gestational age, birth weight or birth length in our adjusted models (Supplementary Table 6).
4. Discussion
While several studies have suggested that adverse in utero environments can affect DNA methylation in embryonic and extra-embryonic tissues, it remains largely unknown whether prenatal exposure to the EDC classes of phthalates and phenols affects the human epigenome. Since EDCs can have a profound impact on the infant's endocrine profile, any effect on DNA methylation or disruption of genomic imprinting would be of great importance. Our study investigated how first trimester individual and additive phthalate and phenol biomarker exposure correlates with H19 and IGF2 methylation and allele-specific expression in placenta samples. We chose to analyze DNA methylation in placenta because the placenta plays a vital role in fetal growth by performing many critical physiological functions, and acts as an endocrine organ to produce a number of hormones, cytokines, and signaling molecules, and thus may be a target for endocrine disruption (Jansson and Powell 2007). We chose to measure first trimester EDC concentrations because this marks a critical period in epigenetic reprogramming, and early gestation is a particularly vulnerable window of development, as demonstrated by results of the Dutch Hunger Winter Study (Schulz 2010). Our rationale to focus on H19 and IGF2 was based on several factors. IGF2 and H19 are two reciprocally critical imprinted genes implicated in fetal and embryonic growth. Notably, IGF2 may be implicated in the placental supply of maternal nutrients (Constancia et al. 2002). Prior in vivo studies have demonstrated that BPA exposure is linked to aberrant DNA methylation of H19 and IGF2, suggesting that these genes may be particularly susceptible to EDC exposure (Susiarjo et al. 2013; Chao et al. 2012). However, it is likely that other genes and pathways are affected by prenatal EDC exposure, and this should be explored in future studies.
Overall, we found larger degrees of shared variance among the urinary concentrations of phthalate biomarkers than of phenols. We found several strong, statistically significant correlations between concentrations of individual phthalate metabolites, but weaker linear associations between individual phenols. Our results are in agreement with a recent study also found that several phthalates and phenols were significantly correlated with one another (Tefre de Renzy-Martin et al. 2013) Not surprisingly, considering they originate from the same parent compound, the concentrations of individual DEHP biomarker metabolites correlate very strongly with each other, which is in agreement with prior studies (Meeker et al. 2009b; Frederiksen et al. 2010; Becker et al. 2004). The oxidized metabolites of DEHP (MEHHP, MECPP, MEOHP) aggregate closer with each other than with the simple monoester MEHP. MEHP is a primary bioactive metabolite, whereas MEHHP, MECPP, and MEOHP are secondary metabolites. The longer half-lives of the oxidized metabolites likely contribute to these aggregation patterns (Koch et al. 2006). Importantly, it has been previously proposed that MEHP may be a good indicator of phase I biotransformation (Meeker et al. 2012). Also, MnBP and MiBP, the metabolites of DnBP and DiBP, aggregated very closely together. Considering DnBP and DiBP are isomers and are often used interchangeably in products, exposure to these compounds is likely concurrent, contributing to the close aggregation of their metabolites in our study population.
Compared to the phthalates, the individual correlations between the phenols are weaker. In agreement with a prior study reporting a high correlation between the urinary concentrations of PrPB and MePB (Ye et al. 2006), we observed that the parabens correlated fairly well with each other, but PrPB and MePB exhibited stronger correlation and aggregation with each other than with BuPB. Parabens are frequently found in combination in cosmetic products, although some parabens are used more frequently than others. For example, one study reported BuPB was generally present in fewer cosmetic products (16%) than PrPB (38%) and MePB (98%) (Rastogi et al. 1995). This likely contributes to the observed major determinants in variation among the various parabens we examined, along with contributing to why BuPB has a lower GM in our study population compared to PrPB and MePB.
Overall, our exposure data assessment suggests concurrent exposure to several phthalates and phenols. However, due to the lack of interaction between phthalates and phenols together, we analyzed DNA methylation and allele-specific expression with additive phthalate and phenol groupings, separate from one another. It has been suggested that grouping subjects into exposure quintiles or categories may reduce exposure misclassification due to within-subject variability (Adibi et al. 2008). In our study, we used a continuous summative measurement of specific EDC categories of compounds with similar characteristics, which have demonstrated shared variation, such as HWM phthalates. We propose the use of additive measurements better represents the shared variability of these compounds, and may help to reduce exposure misclassification bias.
Our results suggest that epigenetic modifications in the placenta following EDC exposure may be sexually dimorphic and EDC class-specific. We observed several statistically significant sex interactions for phenols and IGF2DMR2 methylation values, and phthalates and IGF2DMR0 methylation values. Interestingly, we found male placenta samples more susceptible to altered IGF2DMR2 DNA methylation following certain phenol exposures, and female placenta samples were more susceptible for altered IGF2DMR0 DNA methylation following certain phthalate exposures. These preliminary data suggest that phenols and phthalates may have differential effects on placenta imprinting methylation. The placenta largely determines the environment to which the developing fetus is exposed, and placental growth responds to maternal influences, such as nutrition and environmental exposures. How the placenta responds to these maternal influences may be sex-specific, as is the case in pre-eclamptic pregnancies (Anway et al. 2005; Kundakovic et al. 2013).
Our findings suggest that prenatal exposure to these EDCs alter methylation levels in the placenta, thereby potentially affecting placenta or fetal programming during development. Several prior studies have suggested that prenatal exposure to toxicants is associated with small differences in placenta DNA methylation. For example, smoking and alcohol during pregnancy have been associated with altered placenta DNA methylation in humans (Suter et al. 2011; Wilhelm-Benartzi et al. 2012). Prenatal exposure to chlorpyrifos-methyl has been found to decrease placenta H19 methylation by approximately 6% in rodents (Shin et al. 2012). To our knowledge, ours is the first study to evaluate how prenatal exposure to multiple phthalates and phenols correlates with methylation in human extra-embryonic tissue. Prenatal BPA exposure and DNA methylation of imprinted loci in placenta has been examined in one rodent study (Susiarjo et al. 2013). Briefly, Susiarjo et al exposed pregnant mice to BPA examined DNA methylation of the H19/Igf2 ICR via pyrosequencing in embryos and placenta. Embryos, but not placentas, from BPA-exposed mice had significantly lower methylation (51.6% in non-exposed controls vs. 42.3% in BPA-exposed) of H19/Igf2 ICR. We found that individual urinary concentrations of phthalate metabolites, and not phenols, were associated with differences in DNA methylation for H19 and IGF2. We believe there are several factors contributing to differences found in our study compared to Susiarjo et al. We used human samples that included measurements of several prenatal EDCs, rather than focusing on a single compound. We also examined DNA methylation at term rather than during embryogenesis, and were not able to measure methylation in embryonic tissue. However, the two studies revealed notable similarities, e.g. both studies did not observe changes in birth weight. Prior research has shown that disruption of one of the IGF-II alleles reduces body weight in mice, but it is possible that body weight at a later stage of development may be affected (DeChiara et al. 1990). Interestingly, both studies observed that allelic expression data was not highly correlated with observed methylation changes. Our observations on LOI also correlate with one prior study that investigated the prevalence of LOI of H19 and IGF2 at birth. Rancourt et al. found LOI of IGF2 in 22% of individuals in the cord blood but 0% in placenta. Furthermore, LOI status did not correspond to aberrant methylation levels or with changes in overall gene expression (Rancourt et al. 2013). These findings contribute to the increasing body of evidence on the lack of correlation between DNA methylation and overall or allele-specific expression (Weaver et al. 2010).
Our study adds to the evidence that prenatal exposure, particularly to EDCs, influences DNA methylation in the placenta. Perturbed IGF2/H19 methylation in placenta indicates that the developing fetus may be exposed to an adverse gestational environment. We did not, however, observe adverse birth outcomes in associated with prenatal EDC exposure. It is likely that at birth is not the appropriate timing for assessment of adverse responses to in utero exposure to EDCs. Adverse gestational conditions may have implications for health later in life. The concern over perturbations during early growth has been reinforced by a number of studies that have associated adult diseases, such as hypertension, heart disease, type 2 diabetes, and obesity with in utero and early postnatal stressors, including maternal caloric restriction, prenatal stress, and chemical exposure (Eubig et al. 2010; Markham and Koenig 2011; Roseboom et al. 2011). Our study reveals new evidences for altered DNA methylation following prenatal EDC exposure. These changes may be adaptive or adverse, and it is possible that they may linked to a predisposition for adverse health outcomes during puberty or adulthood. Our results may also serve as a backdrop for future studies to examine other epigenetic alterations following EDC exposure. Future studies should also be conducted to assess development outcomes later in life, including metabolic diseases.
The mechanisms of how phthalates and phenols exert epigenetic effects are still under investigation. To date, BPA has been the most well characterized EDC in its ability to exert its effects through estrogen receptors (ERs). MEHP has also been shown to suppress estradiol production in the ovary in a receptor-mediated pathway (Lovekamp-Swan and Davis 2003). It is possible that methylation changes following EDC exposure are elicited through altered cell signaling, potentially via estrogen receptor signaling. Prior research has also demonstrated that Bisphenol A exposure can induce the generation of reactive oxygen species. Increased oxidative stress has been associated with problems during pregnancy, such as pre-eclampsia. A recent study identified a novel mechanism for oxidative stress to promote altered imprinting through canonical NF-κB signaling (Yang et al. 2014). We propose that prenatal exposure to EDCs introduces an adverse gestational environment, which results in aberrant methylation. This adverse gestational environment may be elicited through increased oxidative stress, which in turn can affect imprinting gene methylation.
A limitation of our study was the use of a single spot urine measurement. Several prior studies evaluated the correlations of select phthalate and phenol biomarker concentrations in pregnant women and women of reproductive age at different time points (Adibi et al. 2008; Peck et al. 2010; Braun et al. 2012). Reproducibility in biomarker measurements varies considerably depending on the chemical. While BPA has a fairly low intraclass correlation coefficient (ICC), other phenols have higher reproducibility (Philippat et al. 2013; Meeker et al. 2013; Braun et al. 2011). One study suggested that while paraben levels were more variable during pregnancy than before pregnancy, a single urine measurement may reasonably represent a person's exposure over several months and a single urine measurement during pregnancy may suitably represent gestational exposure (Smith et al. 2012). Reproducibility in phthalate biomarker measurements also varies depending on the study and chemical (Adibi et al. 2008) (Irvin et al. 2010). However, a considerable strength of our study was the measurement of EDC exposure during the first trimester, which represents the critical window of exposure for inducing aberrant genomic imprinting. EDC exposure outside of this window did not induce epigenetic changes in embryonic or extra-embryonic tissue in mice (Susiarjo et al. 2013).Since humans are exposed to a wide variety of chemicals simultaneously, prior studies have suggested more comprehensive measurements of several phthalates and phenols for epidemiological studies (Kim et al. 2013). A strength of our study was the measurement of several phthalates and phenols, as well as the statistical modeling using additive biomarker measurements to characterize body burden. An additional strength of our study was the considerable sample size, thereby increasing precision and possibly accuracy of our results.
5. Conclusions
In summary, our work has demonstrated that prenatal exposure to phthalates and phenols may perturb methylation of the imprinting genes H19 and IGF2 in the placenta. Prenatal exposures to HMW and DEHP metabolite phthalates were associated with aberrant imprinting of H19 in male newborns. Importantly, DNA methylation alterations following prenatal phthalate and phenol exposure may be sexually dimorphic, and are specific to the EDC chemical class. Consistent with prior research, we did not observe correlations between methylation and allele-specific expression nor with birth outcomes. Future studies should be conducted to further elucidate the mechanisms of prenatal EDC exposure on epigenetic modifications in extraembryonic and embryonic tissues.
Supplementary Material
Highlights.
We describe exposure profiles of phenols and phthalates in 196 pregnant women.
Significant associations were found between H19/IGF2 DNA methylation and exposures.
We examined associations between methylation, expression and birth outcomes.
Acknowledgments
The authors are indebted to Dr. Antonia Calafat her team at the National Center for Environmental Health at the CDC for biomarker measurements.
Funding: Jessica LaRocca was supported by the Harvard University Center for the Environment Ziff Environmental Fellowship. A.M. Binder was supported by Training Grant T32HD060454 in Reproductive, Perinatal and Pediatric Epidemiology from the National Institute of Child Health and Human Development, National Institutes of Health. Dr. Michels was supported by grant K01ES015771 from the National Institute of Environmental Health Sciences, National Institutes of Health. The Epigenetic Birth Cohort was funded by research grant R21CA128382 from the National Cancer Institute, National Institutes of Health. Dr. McElrath was in part supported by R01ES018872 from the National Institute of Environmental Health Sciences, National Institutes of Health.
Footnotes
Publisher's Disclaimer: This is a PDF file of an unedited manuscript that has been accepted for publication. As a service to our customers we are providing this early version of the manuscript. The manuscript will undergo copyediting, typesetting, and review of the resulting proof before it is published in its final citable form. Please note that during the production process errors may be discovered which could affect the content, and all legal disclaimers that apply to the journal pertain.
References
- Birnbaum LS. State of the science of endocrine disruptors. Environmental health perspectives. 2013;121(4):A107. doi: 10.1289/ehp.1306695. [DOI] [PMC free article] [PubMed] [Google Scholar]
- Barker DJ. Maternal nutrition, fetal nutrition, and disease in later life. Nutrition. 1997;13(9):807–813. doi: 10.1016/s0899-9007(97)00193-7. [DOI] [PubMed] [Google Scholar]
- Eubig PA, Aguiar A, Schantz SL. Lead and PCBs as risk factors for attention deficit/hyperactivity disorder. Environmental health perspectives. 2010;118(12):1654–1667. doi: 10.1289/ehp.0901852. [DOI] [PMC free article] [PubMed] [Google Scholar]
- Markham JA, Koenig JI. Prenatal stress: role in psychotic and depressive diseases. Psychopharmacology (Berl) 2011;214(1):89–106. doi: 10.1007/s00213-010-2035-0. [DOI] [PMC free article] [PubMed] [Google Scholar]
- Roseboom TJ, Painter RC, van Abeelen AF, Veenendaal MV, de Rooij SR. Hungry in the womb: what are the consequences? Lessons from the Dutch famine. Maturitas. 2011;70(2):141–145. doi: 10.1016/j.maturitas.2011.06.017. [DOI] [PubMed] [Google Scholar]
- Hauser R, Calafat AM. Phthalates and human health. Occupational and environmental medicine. 2005;62(11):806–818. doi: 10.1136/oem.2004.017590. [DOI] [PMC free article] [PubMed] [Google Scholar]
- Koch HM, Calafat AM. Human body burdens of chemicals used in plastic manufacture. (Philosophical transactions of the Royal Society of London Series B).Biological sciences. 2009;364(1526):2063–2078. doi: 10.1098/rstb.2008.0208. [DOI] [PMC free article] [PubMed] [Google Scholar]
- Meeker JD, Sathyanarayana S, Swan SH. Phthalates and other additives in plastics: human exposure and associated health outcomes. (Philosophical transactions of the Royal Society of London Series B).Biological sciences. 2009a;364(1526):2097–2113. doi: 10.1098/rstb.2008.0268. [DOI] [PMC free article] [PubMed] [Google Scholar]
- Calafat AM, Ye X, Wong LY, Reidy JA, Needham LL. Urinary concentrations of triclosan in the U.S. population: 2003-2004. Environmental health perspectives. 2008a;116(3):303–307. doi: 10.1289/ehp.10768. [DOI] [PMC free article] [PubMed] [Google Scholar]
- Calafat AM, Wong LY, Ye X, Reidy JA, Needham LL. Concentrations of the sunscreen agent benzophenone-3 in residents of the United States: National Health and Nutrition Examination Survey 2003--2004. Environmental health perspectives. 2008b;116(7):893–897. doi: 10.1289/ehp.11269. [DOI] [PMC free article] [PubMed] [Google Scholar]
- Reik W, Walter J. Genomic imprinting: parental influence on the genome. Nat Rev Genet. 2001;2(1):21–32. doi: 10.1038/35047554. [DOI] [PubMed] [Google Scholar]
- Gabory A, Ripoche MA, Yoshimizu T, Dandolo L. The H19 gene: regulation and function of a non-coding RNA. Cytogenet Genome Res. 2006;113(1-4):188–193. doi: 10.1159/000090831. [DOI] [PubMed] [Google Scholar]
- Gabory A, Jammes H, Dandolo L. The H19 locus: role of an imprinted non-coding RNA in growth and development. Bioessays. 2010;32(6):473–480. doi: 10.1002/bies.200900170. [DOI] [PubMed] [Google Scholar]
- Waterland RA, Dolinoy DC, Lin JR, Smith CA, Shi X, Tahiliani KG. Maternal methyl supplements increase offspring DNA methylation at Axin Fused. Genesis. 2006;44(9):401–406. doi: 10.1002/dvg.20230. [DOI] [PubMed] [Google Scholar]
- Nomura Y, Lambertini L, Rialdi A, Lee M, Mystal EY, Grabie M, et al. Global Methylation in the Placenta and Umbilical Cord Blood From Pregnancies With Maternal Gestational Diabetes, Preeclampsia, and Obesity. Reprod Sci. 2013 doi: 10.1177/1933719113492206. [DOI] [PMC free article] [PubMed] [Google Scholar]
- Haycock PC, Ramsay M. Exposure of mouse embryos to ethanol during preimplantation development: effect on DNA methylation in the h19 imprinting control region. Biol Reprod. 2009;81(4):618–627. doi: 10.1095/biolreprod.108.074682. [DOI] [PubMed] [Google Scholar]
- Suter M, Ma J, Harris A, Patterson L, Brown KA, Shope C, et al. Maternal tobacco use modestly alters correlated epigenome-wide placental DNA methylation and gene expression. Epigenetics. 2011;6(11):1284–1294. doi: 10.4161/epi.6.11.17819. [DOI] [PMC free article] [PubMed] [Google Scholar]
- Michels KB, Harris HR, Barault L. Birthweight, Maternal Weight Trajectories and Global DNA Methylation of LINE-1 Repetitive Elements. PLoS One. 2011;6(9) doi: 10.1371/journal.pone.0025254. [DOI] [PMC free article] [PubMed] [Google Scholar]
- McElrath TF, Lim KH, Pare E, Rich-Edwards J, Pucci D, Troisi R, et al. Longitudinal evaluation of predictive value for preeclampsia of circulating angiogenic factors through pregnancy. American journal of obstetrics and gynecology. 2012;207(5):407 e401–407. doi: 10.1016/j.ajog.2012.08.010. [DOI] [PubMed] [Google Scholar]
- Silva MJ, Preau JL, Jr, Needham LL, Calafat AM. Cross validation and ruggedness testing of analytical methods used for the quantification of urinary phthalate metabolites. J Chromatogr B Analyt Technol Biomed Life Sci. 2008;873(2):180–186. doi: 10.1016/j.jchromb.2008.08.017. [DOI] [PubMed] [Google Scholar]
- Ye X, Kuklenyik Z, Needham LL, Calafat AM. Automated on-line column-switching HPLC-MS/MS method with peak focusing for the determination of nine environmental phenols in urine. Anal Chem. 2005;77(16):5407–5413. doi: 10.1021/ac050390d. [DOI] [PubMed] [Google Scholar]
- Rancourt RC, Harris HR, Michels KB. Methylation levels at imprinting control regions are not altered with ovulation induction or in vitro fertilization in a birth cohort. Hum Reprod. 2012;27(7):2208–2216. doi: 10.1093/humrep/des151. [DOI] [PMC free article] [PubMed] [Google Scholar]
- Rancourt RC, Harris HR, Barault L, Michels KB. The prevalence of loss of imprinting of H19 and IGF2 at birth. FASEB J. 2013;27(8):3335–3343. doi: 10.1096/fj.12-225284. [DOI] [PMC free article] [PubMed] [Google Scholar]
- Williams J. Williams Obstetrics. New York: McGraw-Hill; 2005. [Google Scholar]
- Boeniger MF, Lowry LK, Rosenberg J. Interpretation of urine results used to assess chemical exposure with emphasis on creatinine adjustments: a review. Am Ind Hyg Assoc J. 1993;54(10):615–627. doi: 10.1080/15298669391355134. [DOI] [PubMed] [Google Scholar]
- Teass A, B R, DeBord D. Application of Biological Monitoring Methods. In: Eller P, editor. NIOSH Manual of Analytical Method. Cincinnati: National Institute for Occupational Safety and Health Division of Physical Sciences and Engineering; 1998. [Google Scholar]
- CDC. Fourth national report on human exposure to environmental chemicals, updated tables. [accessed Feb 1 2012]; year. Available: [ http://www.cdc.gov/exposurereport/pdf/FourthReport_UpdatedTables_Feb2012.pdf]
- Hornung RW, R L. Estimation of average concentrations in the presence of nondetectable values. Appl Occup Environ Hyg. 1990;5:46–51. [Google Scholar]
- Jansson T, Powell TL. Role of the placenta in fetal programming: underlying mechanisms and potential interventional approaches. Clin Sci (Lond) 2007;113(1):1–13. doi: 10.1042/CS20060339. [DOI] [PubMed] [Google Scholar]
- Schulz LC. The Dutch Hunger Winter and the developmental origins of health and disease. Proceedings of the National Academy of Sciences of the United States of America. 2010;107(39):16757–16758. doi: 10.1073/pnas.1012911107. [DOI] [PMC free article] [PubMed] [Google Scholar]
- Constancia M, Hemberger M, Hughes J, Dean W, Ferguson-Smith A, Fundele R, et al. Placental-specific IGF-II is a major modulator of placental and fetal growth. Nature. 2002;417(6892):945–948. doi: 10.1038/nature00819. [DOI] [PubMed] [Google Scholar]
- Susiarjo M, Sasson I, Mesaros C, Bartolomei MS. Bisphenol a exposure disrupts genomic imprinting in the mouse. PLoS genetics. 2013;9(4):e1003401. doi: 10.1371/journal.pgen.1003401. [DOI] [PMC free article] [PubMed] [Google Scholar]
- Chao HH, Zhang XF, Chen B, Pan B, Zhang LJ, Li L, et al. Bisphenol A exposure modifies methylation of imprinted genes in mouse oocytes via the estrogen receptor signaling pathway. Histochem Cell Biol. 2012;137(2):249–259. doi: 10.1007/s00418-011-0894-z. [DOI] [PubMed] [Google Scholar]
- Tefre de Renzy-Martin K, Frederiksen H, Christensen J, Boye Kyhl H, Andersson AM, Husby S, et al. Current exposure of 200 pregnant Danish women to phthalates, parabens and phenols. Reproduction. 2013 doi: 10.1530/REP-13-0461. [DOI] [PubMed] [Google Scholar]
- Meeker JD, Hu H, Cantonwine DE, Lamadrid-Figueroa H, Calafat AM, Ettinger AS, et al. Urinary phthalate metabolites in relation to preterm birth in Mexico city. Environmental health perspectives. 2009b;117(10):1587–1592. doi: 10.1289/ehp.0800522. [DOI] [PMC free article] [PubMed] [Google Scholar]
- Frederiksen H, Jorgensen N, Andersson AM. Correlations between phthalate metabolites in urine, serum, and seminal plasma from young Danish men determined by isotope dilution liquid chromatography tandem mass spectrometry. Journal of analytical toxicology. 2010;34(7):400–410. doi: 10.1093/jat/34.7.400. [DOI] [PubMed] [Google Scholar]
- Becker K, Seiwert M, Angerer J, Heger W, Koch HM, Nagorka R, et al. DEHP metabolites in urine of children and DEHP in house dust. International journal of hygiene and environmental health. 2004;207(5):409–417. doi: 10.1078/1438-4639-00309. [DOI] [PubMed] [Google Scholar]
- Koch HM, Preuss R, Angerer J. Di(2-ethylhexyl)phthalate (DEHP): human metabolism and internal exposure-- an update and latest results. International journal of andrology. 2006;29(1):155–165. doi: 10.1111/j.1365-2605.2005.00607.x. discussion 181-155. [DOI] [PubMed] [Google Scholar]
- Meeker JD, Calafat AM, Hauser R. Urinary phthalate metabolites and their biotransformation products: predictors and temporal variability among men and women. Journal of exposure science & environmental epidemiology. 2012;22(4):376–385. doi: 10.1038/jes.2012.7. [DOI] [PMC free article] [PubMed] [Google Scholar]
- Ye X, Bishop AM, Reidy JA, Needham LL, Calafat AM. Parabens as urinary biomarkers of exposure in humans. Environmental health perspectives. 2006;114(12):1843–1846. doi: 10.1289/ehp.9413. [DOI] [PMC free article] [PubMed] [Google Scholar]
- Rastogi SC, Schouten A, de Kruijf N, Weijland JW. Contents of methyl-, ethyl-, propyl-, butyl- and benzylparaben in cosmetic products. Contact Dermatitis. 1995;32(1):28–30. doi: 10.1111/j.1600-0536.1995.tb00836.x. [DOI] [PubMed] [Google Scholar]
- Adibi JJ, Whyatt RM, Williams PL, Calafat AM, Camann D, Herrick R, et al. Characterization of phthalate exposure among pregnant women assessed by repeat air and urine samples. Environmental health perspectives. 2008;116(4):467–473. doi: 10.1289/ehp.10749. [DOI] [PMC free article] [PubMed] [Google Scholar]
- Anway MD, Cupp AS, Uzumcu M, Skinner MK. Epigenetic transgenerational actions of endocrine disruptors and male fertility. Science. 2005;308(5727):1466–1469. doi: 10.1126/science.1108190. [DOI] [PMC free article] [PubMed] [Google Scholar]
- Kundakovic M, Gudsnuk K, Franks B, Madrid J, Miller RL, Perera FP, et al. Sex-specific epigenetic disruption and behavioral changes following low-dose in utero bisphenol A exposure. Proceedings of the National Academy of Sciences of the United States of America. 2013;110(24):9956–9961. doi: 10.1073/pnas.1214056110. [DOI] [PMC free article] [PubMed] [Google Scholar]
- Wilhelm-Benartzi CS, Houseman EA, Maccani MA, Poage GM, Koestler DC, Langevin SM, et al. In utero exposures, infant growth, and DNA methylation of repetitive elements and developmentally related genes in human placenta. Environmental health perspectives. 2012;120(2):296–302. doi: 10.1289/ehp.1103927. [DOI] [PMC free article] [PubMed] [Google Scholar]
- Shin HS, Seo JH, Jeong SH, Park SW, Park Y, Son SW, et al. Exposure of pregnant mice to chlorpyrifos-methyl alters embryonic H19 gene methylation patterns. Environ Toxicol. 2012 doi: 10.1002/tox.21820. [DOI] [PubMed] [Google Scholar]
- DeChiara TM, Efstratiadis A, Robertson EJ. A growth-deficiency phenotype in heterozygous mice carrying an insulin-like growth factor II gene disrupted by targeting. Nature. 1990;345(6270):78–80. doi: 10.1038/345078a0. [DOI] [PubMed] [Google Scholar]
- Weaver JR, Sarkisian G, Krapp C, Mager J, Mann MR, Bartolomei MS. Domain-specific response of imprinted genes to reduced DNMT1. Molecular and cellular biology. 2010;30(16):3916–3928. doi: 10.1128/MCB.01278-09. [DOI] [PMC free article] [PubMed] [Google Scholar]
- Lovekamp-Swan T, Davis BJ. Mechanisms of phthalate ester toxicity in the female reproductive system. Environmental health perspectives. 2003;111(2):139–145. doi: 10.1289/ehp.5658. [DOI] [PMC free article] [PubMed] [Google Scholar]
- Yang B, Wagner J, Damaschke N, Yao T, Wuerzberger-Davis SM, Lee MH, et al. A novel pathway links oxidative stress to loss of insulin growth factor-2 (IGF2) imprinting through NF-kappaB activation. PloS one. 2014;9(2):e88052. doi: 10.1371/journal.pone.0088052. [DOI] [PMC free article] [PubMed] [Google Scholar]
- Peck JD, Sweeney AM, Symanski E, Gardiner J, Silva MJ, Calafat AM, et al. Intra- and inter-individual variability of urinary phthalate metabolite concentrations in Hmong women of reproductive age. Journal of exposure science & environmental epidemiology. 2010;20(1):90–100. doi: 10.1038/jes.2009.4. [DOI] [PMC free article] [PubMed] [Google Scholar]
- Braun JM, Smith KW, Williams PL, Calafat AM, Berry K, Ehrlich S, et al. Variability of urinary phthalate metabolite and bisphenol A concentrations before and during pregnancy. Environmental health perspectives. 2012;120(5):739–745. doi: 10.1289/ehp.1104139. [DOI] [PMC free article] [PubMed] [Google Scholar]
- Philippat C, Wolff MS, Calafat AM, Ye X, Bausell R, Meadows M, et al. Prenatal Exposure to Environmental Phenols: Concentrations in Amniotic Fluid and Variability in Urinary Concentrations during Pregnancy. Environmental health perspectives. 2013 doi: 10.1289/ehp.1206335. [DOI] [PMC free article] [PubMed] [Google Scholar]
- Meeker JD, Cantonwine DE, Rivera-Gonzalez LO, Ferguson KK, Mukherjee B, Calafat AM, et al. Distribution, variability, and predictors of urinary concentrations of phenols and parabens among pregnant women in Puerto Rico. Environmental science & technology. 2013;47(7):3439–3447. doi: 10.1021/es400510g. [DOI] [PMC free article] [PubMed] [Google Scholar]
- Braun JM, Kalkbrenner AE, Calafat AM, Bernert JT, Ye X, Silva MJ, et al. Variability and predictors of urinary bisphenol A concentrations during pregnancy. Environmental health perspectives. 2011;119(1):131–137. doi: 10.1289/ehp.1002366. [DOI] [PMC free article] [PubMed] [Google Scholar]
- Smith KW, Braun JM, Williams PL, Ehrlich S, Correia KF, Calafat AM, et al. Predictors and variability of urinary paraben concentrations in men and women, including before and during pregnancy. Environmental health perspectives. 2012;120(11):1538–1543. doi: 10.1289/ehp.1104614. [DOI] [PMC free article] [PubMed] [Google Scholar]
- Irvin EA, Calafat AM, Silva MJ, Aguilar-Villalobos M, Needham LL, Hall DB, et al. An estimate of phthalate exposure among pregnant women living in Trujillo, Peru. Chemosphere. 2010;80(11):1301–1307. doi: 10.1016/j.chemosphere.2010.06.048. [DOI] [PubMed] [Google Scholar]
- Kim JH, Rozek LS, Soliman AS, Sartor MA, Hablas A, Seifeldin IA, et al. Bisphenol A-associated epigenomic changes in prepubescent girls: a cross-sectional study in Gharbiah, Egypt. Environmental health: a global access science source. 2013;12:33. doi: 10.1186/1476-069X-12-33. [DOI] [PMC free article] [PubMed] [Google Scholar]
Associated Data
This section collects any data citations, data availability statements, or supplementary materials included in this article.