Abstract
AIMS/HYPOTHESIS
Increased extracellular matrix (ECM) collagen is a characteristic of muscle insulin resistance. MMP9 is a primary enzyme that degrades collagen IV (ColIV). As a component of the basement membrane, ColIV plays a key role in ECM remodeling. The hypotheses that genetic deletion of MMP9 in mice 1) increases muscle ColIV, 2) induces insulin resistance in lean mice, and 3) worsens diet-induced muscle insulin resistance were tested.
METHODS
Wild type (mmp9+/+) and MMP9 null (mmp9−/−) mice were chow or high fat (HF) fed for 16wks. Insulin action was measured by the hyperinsulinemic, euglycemic clamp in conscious weight-matched surgically catheterized mice.
RESULTS
mmp9−/− and HF feeding independently increased muscle ColIV. ColIV in HF-fed mmp9−/− was further increased. mmp9−/− did not affect fasting insulin or glucose in chow- or HF-fed mice. Glucose infusion rate (GIR), endogenous glucose appearance (EndoRa) and glucose disappearance (Rd) rates, and a muscle glucose metabolic index (Rg) were the same in chow-fed mmp9+/+ and mmp9−/−. In contrast, HF-fed mmp9−/− decreased GIR, insulin-stimulated increase in Rd, and muscle Rg. Insulin-stimulated suppression of EndoRa was however, remained the same between HF-fed mmp9−/− and mmp9+/+. Decreased muscle Rg in HF-fed mmp9−/− was associated with decreased muscle capillaries.
CONCLUSION/INTERPRETATION
Despite increased muscle ColIV, genetic deletion of MMP9 does not induce insulin resistance in lean mice. In contrast, it results in a more profound insulin resistant state, specifically in skeletal muscle in HF-fed mice. These results highlight the importance of ECM remodeling in determining muscle insulin resistance in the presence of HF diet.
Keywords: Capillary density, Collagen IV, Extracellular matrix, High fat diet
Introduction
Insulin resistance is tightly associated with extracellular matrix (ECM) remodeling in muscle, such that the deposition of ECM components is increased [1–4]. Collagens, the most abundant structural components of the ECM, are increased in insulin resistant muscles of both humans [2] and rodents [3]. Rescue of muscle insulin resistance genetically by mitochondria-targeted catalase overexpression or pharmacologically by the phosphodiesterase 5 inhibitor, sildenafil reverses the expression of ECM collagens [3]. This tight association between muscle insulin action and ECM collagen remodeling is of great potential significance in the pathogenesis of insulin resistance.
Matrix metalloproteinases (MMPs), a family of zinc-dependent proteinases, are responsible for the degradation of all components of the ECM [5]. MMPs are synthesized and secreted in a latent form with a pro-domain, and can be activated by the proteolytic cleavage of the pro-domain by other MMPs, proteases, or even, on occasion, by the enzyme itself [6]. Because of their potent broad degradative capacity, MMPs play an essential role in regulating ECM turnover and remodeling in both normal physiology and diseases including degenerative eye disease [7], osteolysis [8], systemic sclerosis [9], and cancers [10]. Dysregulation of MMPs has also been implicated in the pathophysiology of obesity and diabetes. Plasma concentrations of MMP2 and MMP9, the type IV collagenases, are increased in obese [11] and diabetic [12] patients. More recently, Tinahones et al. reported that gene expression of adipose MMP9 correlates positively with the homeostasis model assessment index in morbidly obese subjects [13]. In contrast to increased MMP9 expression in circulation and adipose tissue of obese subjects, MMP9 activity in skeletal muscle is decreased in high fat (HF)-fed insulin resistant mice [3]. This decreased MMP9 activity relates inversely to muscle collagen deposition and directly to muscle insulin resistance [3]. These findings in muscle suggest that muscle expression of MMP9 is responsible for local ECM dynamics. The composition of the ECM has metabolic, hemodynamic, angiogenic, and a variety of other effects through its interaction with integrin receptors [3]. It also determines the spatial barrier from endothelium to muscle cell surface.
In the present study, we aimed to test the hypotheses that genetic deletion of MMP9 in mice 1) increases muscle collagens, 2) induces insulin resistance in lean mice, and 3) worsens diet-induced muscle insulin resistance. Mice that are homozygous null for the MMP9 gene are viable and fertile [14]. The MMP9 null mice have been previously characterized in a number of experimental models including tumorigenesis [15], skeleton formation [14], and cardiovascular [16], central nervous [17], and immune [18] responses. These are the first experiments to examine the in vivo glucose metabolic fluxes and muscle glucose utilization in these mice. Mice fed chow or a HF diet, a well-characterized mouse model of insulin resistance [19], were used to investigate the role of MMP9 in diet-induced muscle insulin resistance.
Methods
Mouse Models
Mice were housed under temperature and humidity controlled environment with a 12-h light/dark cycle. Mice lacking MMP9 (mmp9−/−) were obtained by breeding heterozygous MMP9 null mice on a C57BL/6J background (mmp9+/−, Stock Number: 007084, the Jackson Laboratory, Bar Harbor, Maine). The homozygous MMP9 null mice and their wild type littermate controls (mmp9+/+) were fed with a high fat (HF) diet (F3282, BioServ, Frenchtown, NJ) containing 60% of calories as fat, or were kept on chow diet starting at 3 weeks of age (at weaning), for 16wks. All mice were studied at 19 weeks of age. Body composition was determined by nuclear magnetic resonance. The Vanderbilt Animal Care and Use Committee approved all animal procedures.
Hyperinsulinemic-Euglycemic Clamp (ICv)
Catheters were implanted in a carotid artery and a jugular vein of mice for sampling and infusions 5 days prior to study [20]. Insulin clamps were performed on 5-h fasted mice [21]. [3-3H]glucose was primed (88.8kBq) and continuously infused for a 90-min equilibration period (1.48kBq/min) and a 2-h clamp period (4.44kBq/min). Baseline blood or plasma parameters were determined in samples collected at −15 and −5min. At t=0, an insulin infusion (4mU·kg−1·min−1) was started and continued for 165min. Blood glucose was clamped at 8.5mmol/l using a variable rate of glucose infusion (GIR). Mice received heparinized saline-washed erythrocytes from donors at 5µl/min to prevent a fall of hematocrit. Insulin clamps were validated by assessment of blood glucose over time. Blood glucose was monitored every 10min and the GIR was adjusted as needed. Blood was taken at 80–120min for the determination of [3-3H]glucose. Clamp insulin was determined at t=100 and 120min. At 120min, 481kBq of 2[14C]deoxyglucose ([14C]2DG) was administered as an intravenous bolus. Blood was taken at 2, 15, 25, and 35min for the determination of [14C]2DG. After the last sample, mice were anesthetized and tissues were collected.
Plasma and Tissue Sample Processing for Isotopic Analysis
Plasma insulin was determined by ELISA (Millipore, Billerica, MA). Radioactivity of [3-3H]glucose, [14C]2DG, and [14C]2DG-6-phosphate were determined by liquid scintillation counting [22]. Glucose appearance (Ra) and disappearance (Rd) rates were determined using non-steady-state equations [23]. Endogenous glucose appearance (endoRa) was determined by subtracting the GIR from total Ra. The glucose metabolic index (Rg) was calculated as previously described [24].
Indirect Calorimetry
Energy expenditure, food consumption, and physical activity were assessed by Promethion system (Sable Systems, Las Vegas, NV). Mice were individually housed for a week prior to the measurements. Indirect calorimetry was measured for 5 consecutive days. Pedestrian distance was determined by the XY array with a 1cm per second minimum movement cutoff. The mean pedestrian speed was determined with a cutoff point of 10% of the maximum speed found in the cycle.
Gelatin Zymography
Gelatin zymography was performed to measure MMP9 activity in plasma. 1µl of plasma was loaded to 10% Novex® zymogram gel (Life Technologies, Grand Island, NY). The gel was then developed according to the manufacturer’s instructions. Conditioned medium from HT-1080 cells was used as a positive control.
Immunohistochemistry
Collagen IV (ColIV), CD31, and von Willebrand Factor (vWF) were assessed by immunohistochemistry in paraffin-embedded tissue sections. 5µm sections were incubated with the primary anti-ColIV (Abcam, Cambridge, MA), anti-CD31 (BD Biosciences, San Jose, CA), and anti-vWF (Dako, Carpinteria, CA) antibodies for 60min. Slides were lightly counterstained with Mayer’s hematoxylin. The EnVision+HRP/DAB System (Dako, Carpinteria, CA) was used to produce localized, visible staining. Images were captured using a Q-Imaging Micropublisher camera mounted on an Olympus upright microscope. Immunostaining was quantified by ImageJ or BIOQUANT Life Science 2009. ColIV protein was measured by the integrated intensity of staining. Muscle vascularity was determined by counting CD31-positive structures and by measuring areas of vWF-positive structures.
Western Blotting
Gastrocnemius was homogenized in buffer containing 50mmol/l Tris-HCl, pH7.5, 1mmol/l EDTA, 1mmol/l EGTA, 10% glycerol, 1% Triton X-100, 1mmol/l DTT, 1mmol/l PMSF, 5µg/ml protease inhibitor, 50mmol/l NaF, 5mmol/l sodium pyrophosphate, and centrifuged at 13,000rpm for 20min at 4°C. 40µg of the supernatant was applied to 4–12% SDS-PAGE gel (Life Technologies, Grand Island, NY). MMP9 was probed using the MMP9 antibody (Abcam, Cambridge, MA).
Vascular Endothelial Growth Factor (VEGF) in Muscle
The VEGF concentration was determined in muscle homogenates using the VEGF ELISA kit (Calbiochem from Millipore, Billerica, MA) as previously described [25, 26]. The kit measures VEGF120 and VEGF164 isoforms.
Statistical Analysis
Data are expressed as mean ± SEM. Statistical analyses were performed using Student’s t test or two-way ANOVA followed by Tukey’s post hoc tests as appropriate. Analysis of covariance (ANCOVA) was used to test energy expenditure for significance between groups as previously described [27–29], using a public web portal developed by the National Mouse Metabolic Phenotyping Centers at http://www.mmpc.org/shared/regression.aspx. Multiple linear regression analysis was used to assess the impact of covariates (body mass, fat mass, and lean mass). The significance level was p<0.05.
Results
Protein expression of MMP9 in muscle
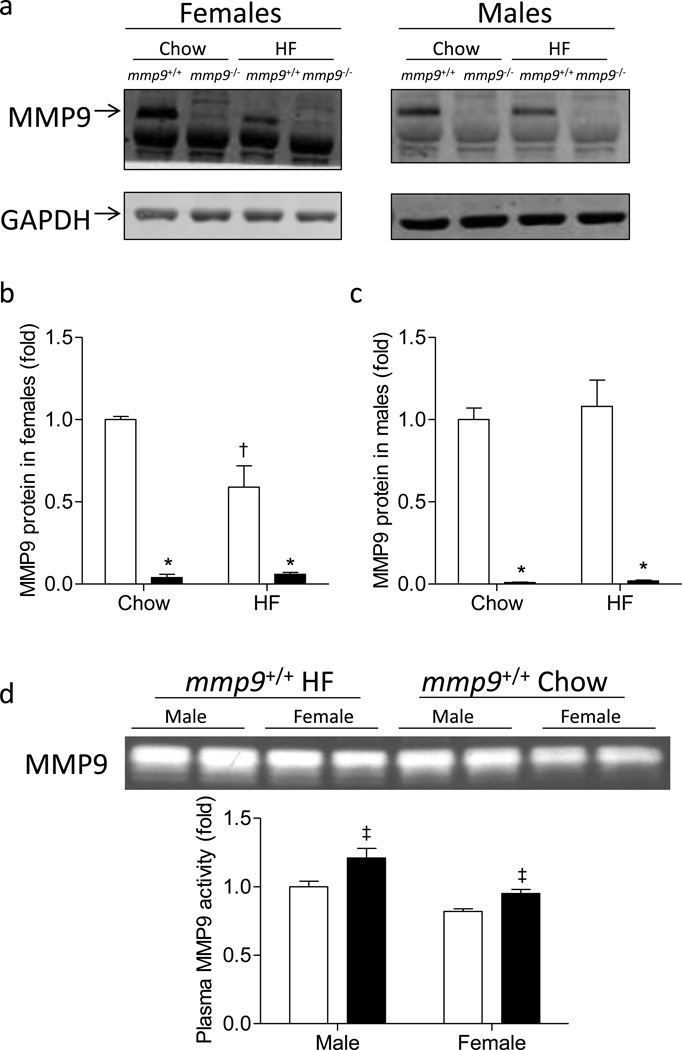
Genetic deletion of MMP9 abolished protein expression of MMP9 in muscle of chow- and HF-fed Mice (Figure 1). Muscle MMP9 protein was decreased by HF feeding in female mmp9+/+ mice, but not in male mmp9+/+ mice (Figures 1a-c). Plasma MMP9 activity was increased in HF-fed mmp9+/+ mice when compared to healthy lean mmp9+/+ mice regardless of gender (Figure 1d).
Figure 1. Protein expression of MMP9 in the skeletal muscle and plasma MMP9 activity.
Gastrocnemius muscle was freeze-clamped following the ICv and was measured for the protein expression of MMP9 by Western Blotting. GAPDH was used as an internal control. (a) Representative bands. (b-c) Quantitative data. Data were normalized to GAPDH expression and presented as fold of chow-fed mmp9+/+. White bars for mmp9+/+ and black bars for mmp9−/−. (d) Gelatin zymography of plasma in mmp9+/+ mice after chow feeding (white bars) or HF feeding (black bars) for 20 weeks. N is equal to 3–6 for the female mice and 5–6 for the male mice. *p<0.05 when compared to mmp9+/+ mice with the same diet; †p<0.05 when compared to chow-fed mice with the same genotype; ‡p<0.05 when compared to chow-fed mice with the same gender.
Body weight and body composition of the MMP9 null mice
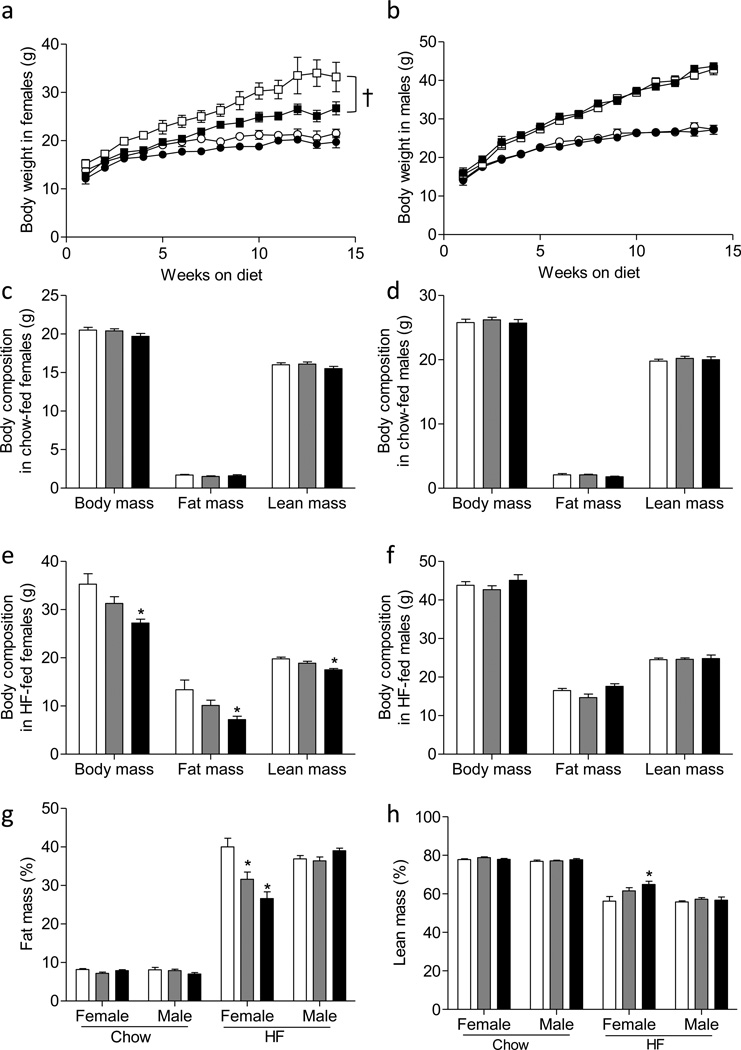
Chow-fed mmp9−/− mice grew similarly to their gender-matched mmp9+/+ controls (Figures 2a and 2b). HF diet feeding increased body weight gains of both mmp9+/+ and mmp9−/− mice regardless of gender (Figures 2a and 2b). In female mice however, mmp9−/− mice gained substantially less weights compared to their mmp9+/+ littermates on a HF diet (Figure 2a). In contrast, HF-fed male mmp9+/+ and mmp9−/− had comparable growth curves (Figure 2b). Consistent with the same body weight gain in the chow-fed mice, body composition of the mice were comparable between chow-fed mmp9+/+, mmp9−/−, and their heterozygous (mmp9+/−) littermates at 18 weeks of age (Figures 2c and 2d). Decreased body weight in the HF-fed female mmp9−/− mice were due to decreased both fat mass and lean mass at 18 weeks of age (Figure 2e). HF-fed female mmp9+/− mice showed a tendency for decreased body weight, fat mass, and lean mass but differences did not reach statistical significance (Figure 2e). Body composition was comparable in HF-fed male mmp9+/+, mmp9+/−, and mmp9−/− mice (Figure 2f). The percent fat mass was decreased by 20% and 40% in the HF-fed female mmp9+/− and mmp9−/−, respectively, compared to HF-fed female mmp9+/+ mice (Figure 2g). The percent lean mass was increased by 15% in the HF-fed female mmp9−/− mice (Figure 2h). The percent fat and lean mass remained the same between genotypes within diet and gender in the other groups (Figures 2g and 2h).
Figure 2. Growth curves and body composition.
(a, b) Mice were fed chow or HF diet after weaning. Body weights were monitored up to 14 weeks on diet (n=10–18 for female mice and 11–24 for the male mice). Circles for chow diet, squares for HF diet, white symbols for mmp9+/+, and black symbols for mmp9−/−. (c-f) Body composition was determined in mice at 18 weeks of age (n=7–25). (g, h) Percent fat and lean mass was calculated (n=7–25). White bars for mmp9+/+, grey bars for mmp9+/−, and black bars for mmp9−/−. †p<0.05 with genotype. *p<0.05 when compared to mmp9+/+.
Energy balance of the HF-fed female MMP9 null mice
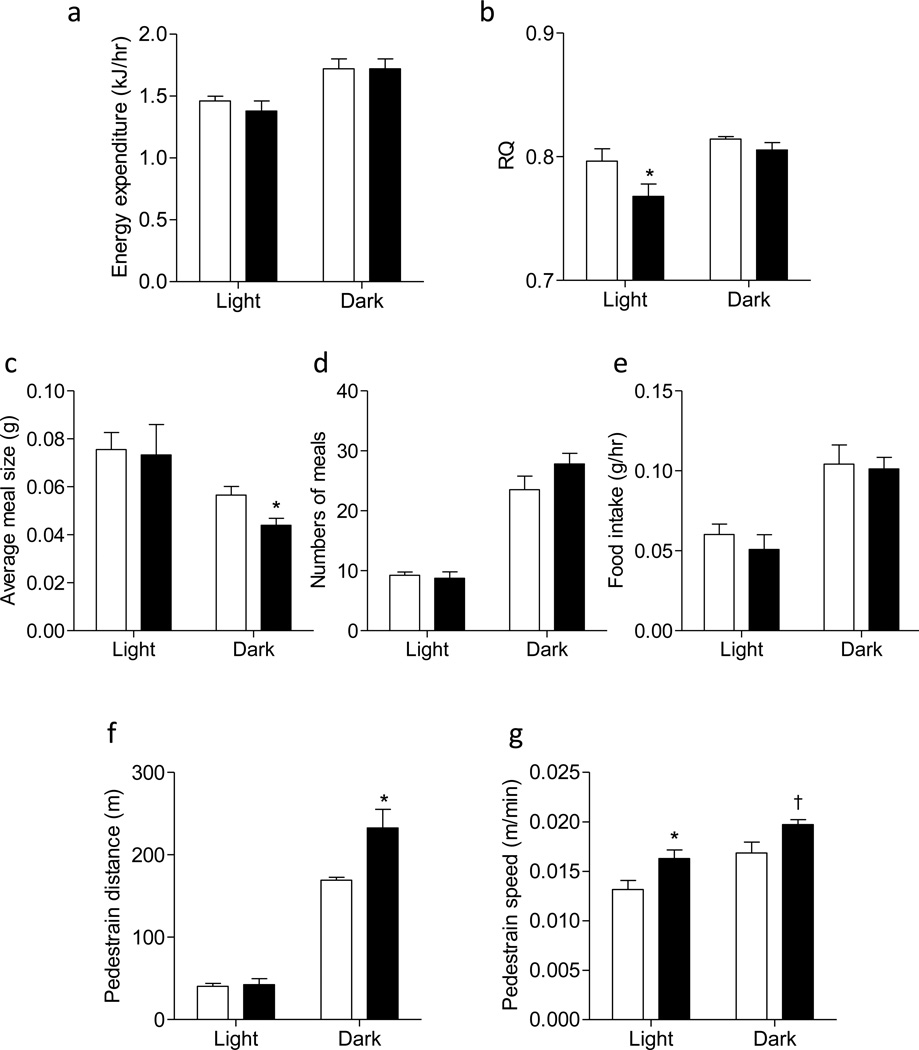
To determine the underlying mechanisms by which female mmp9−/− mice were protected from HF diet-induced obesity, energy balance was measured after 6 weeks of HF feeding, before the body weight of the female mmp9−/− diverged from the controls. Energy expenditure was not different between HF-fed female mmp9+/+ and mmp9−/− (Figure 3a). ANCOVA further showed that the interaction between covariates (body mass, fat mass, and lean mass) and energy expenditure was not significantly different between genotypes. Model-based statistics showed that energy expenditure (ANCOVA-adjusted group means) during both light and dark cycles were not different between genotypes (Table S1). Respiratory quotient (RQ) was lower in mmp9−/− mice during the light cycle, but was the same between groups during the dark cycle (Figure 3b). The average meal size was not different during the light cycle, but was decreased in the null mice during the dark cycle (Figure 3c). Numbers of meals and total food intake were the same between genotypes (Figures 3d and 3e). Voluntary physical activity as shown in pedestrian distance during the dark cycle and the mean pedestrian speed during both light and dark cycles was significantly higher in the female mmp9−/− mice compared to the female mmp9+/+ controls (Figures 3f and 3g).
Figure 3. Energy balance and physical activity of the HF-fed female mmp9−/− mice.
Energy balance and physical activity was assessed in female mice after 6 weeks of HF feeding, before the body weight of the null mice statistically diverged from the controls. (a) Energy expenditure, (b) respiratory quotient (RQ), (c) average meal size, (d) numbers of meals, (e) total food intake, (f) pedestrian distance, and (g) the mean pedestrian speed were presented. White bars for mmp9+/+ and black bars for mmp9−/−. N=5/genotype. *p<0.05 when compared to mmp9+/+ HF. †p=0.07 when compared to mmp9+/+ HF.
Insulin action in MMP9 null mice
To determine the role of MMP9 in muscle insulin action, ICv was performed in the mmp9−/− mice along with their littermate mmp9+/+ controls. As body weight, gender, and diet are independent factors determining insulin action, ICv was performed in gender-matched and body weight-matched mice on both chow and HF diets (Table 1). Although female mmp9−/− mice statistically gained less weight during HF feeding compared to their littermate mmp9+/+ mice, there was a broad range of overlap in body weights between two groups of mice (Figure S1). In order to isolate body weight-independent effects of MMP9 deletion, ICv clamps were performed in mice whose weights fell in the overlapping range (27–37g, Figure S1).
Table 1.
Characteristic of the MMP9 null mice during the hyperinsulinemic-euglycemic clamp.
| CHOW | HF | ||||||||
|---|---|---|---|---|---|---|---|---|---|
| Female | Male | Female | Male | ||||||
| mmp9+/+ | mmp9−/− | mmp9+/+ | mmp9−/− | mmp9+/+ | mmp9−/− | mmp9+/+ | mmp9−/− | ||
| N | 4 | 5 | 6 | 6 | 6 | 6 | 6 | 6 | |
| Weight (g) | 23±0.2 | 21±0.6 | 28±0.7 | 26±0.9 | 33±1.5 | 30±1.0 | 40±1.7 | 40±1.3 | |
| Blood Glucose (mmol/l) |
Basal | 6.8±0.4 | 6.3±0.1 | 7.3±0.1 | 6.7±0.4 | 7.0±0.6 | 7.2±0.3 | 6.8±0.4 | 8.2±0.6 |
| Clampa | 8.2±0.2 | 8.3±0.2 | 8.5±0.1 | 8.4±0.2 | 8.4±0.1 | 8.7±0.2 | 8.4±0.1 | 8.2±0.1 | |
| Plasma Insulin (pmol/l) |
Basal | 86±17 | 189±52 | 258±52 | 224±17 | 344±69 | 430±69 | 1136±310 | 809±103 |
| Clampa | 568±34 | 757±34* | 1084±69 | 1015±86 | 1325±172 | 1119±86 | 2805±396 | 2255±344 | |
| Plasma NEFA (mmol/l) |
Basal | 0.64±0.06 | 0.61±0.09 | 0.68±0.05 | 0.65±0.07 | 0.53±0.10 | 0.61±0.04 | 0.56±0.04 | 0.51±0.09 |
| Clampa | 0.14±0.02 | 0.11±0.04 | 0.20±0.05 | 0.18±0.02 | 0.20±0.04 | 0.25±0.06 | 0.22±0.03 | 0.24±0.03 | |
Data are presented as the average of values obtained from 80–120min of the ICv.
p<0.05 Compared to Chow-fed female mmp9+/+.
All data are expressed as mean ± SEM.
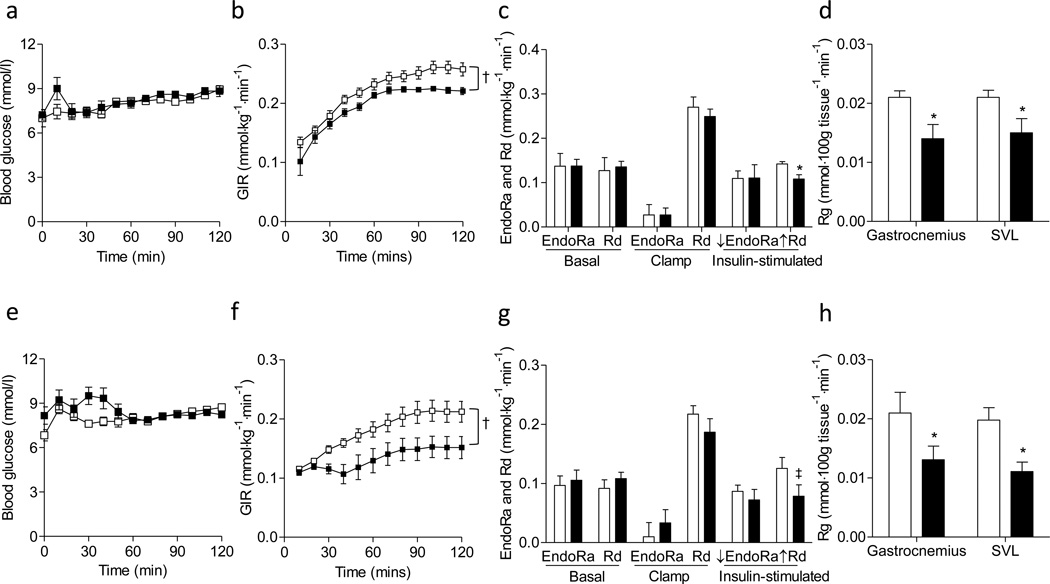
Basal 5h fasting arterial glucose, insulin, and non-esterified fatty acid (NEFA) levels were the same between mmp9−/− mice and their body weight-, gender-, and diet-matched mmp9+/+ littermates (Table 1). Arterial glucose was clamped at ~8.5mmol/l in all groups of mice during the ICv (Table 1 and Figures 4a, 4e, 5a, and 5e). ICv insulin was elevated equivalently in the mmp9−/− mice and their weight-, gender-, and diet-matched mmp9+/+ controls except that ICv insulin was 30% higher in the chow-fed female mmp9−/− mice relative to chow-fed female mmp9+/+ mice (Table 1). NEFA levels were similarly decreased during the ICv between mmp9−/− and their respective controls (Table 1).
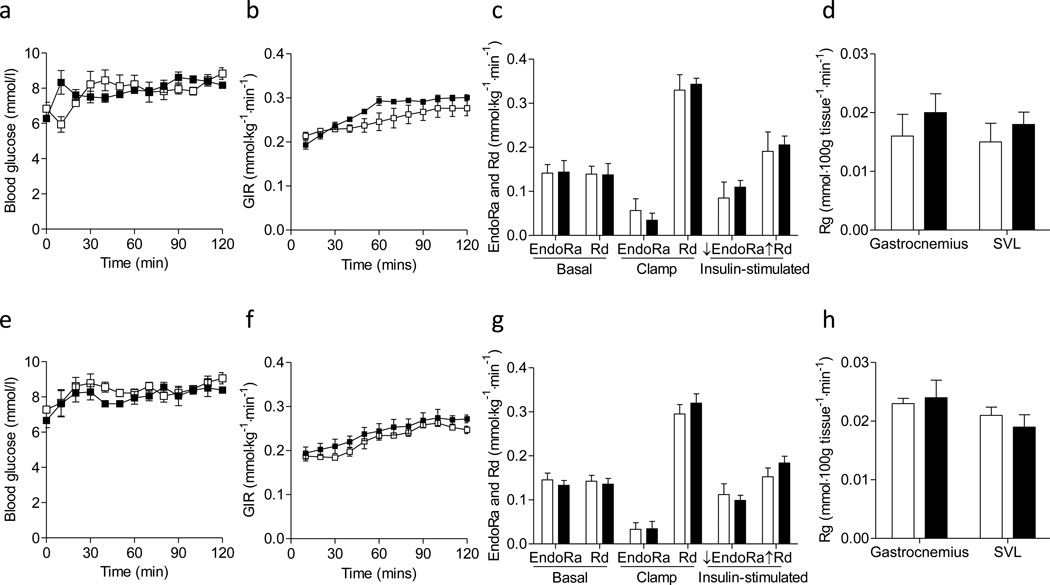
Figure 4. Insulin sensitivity in the chow-fed mice.
Hyperinsulinemic-euglycemic clamps were performed in chow-fed mice determining the insulin action. (a-d) Data from female mice. (e-h) Data from male mice. (a, e) Blood glucose, (b, f) glucose infusion rate (GIR), (c, g) endogenous glucose production (EndoRa), glucose disappearance (Rd), and insulin-stimulated suppression of EndoRa (↓EndoRa) and insulin-stimulated increase in Rd (↑Rd) (calculated by the differences between basal and clamp EndoRa and Rd), and (d, h) a glucose metabolic index (Rg) in muscles were shown. White squares/bars for mmp9+/+ and black squares/bars for mmp9−/−. N is equal to 4–5 for the female mice and 6 for the male mice.
Figure 5. Insulin sensitivity in the HF-fed mice.
Hyperinsulinemic-euglycemic clamps were performed in HF-fed mice determining the insulin action. (a-d) Data from female mice. (e-h) Data from male mice. (a, e) Blood glucose, (b, f) glucose infusion rate (GIR), (c, g) endogenous glucose production (EndoRa), glucose disappearance rate (Rd), and insulin-stimulated suppression of EndoRa (↓EndoRa) and insulin-stimulated increase in Rd (↑Rd), and (d, h) a glucose metabolic index (Rg) in muscles were shown. White squares/bars for mmp9+/+ and black squares/bars for mmp9−/−. N is equal to 6 for both female and male mice. †p<0.05 with genotype. *p<0.05 when compared to mmp9+/+. ‡p=0.06 when compared to mmp9+/+.
Glucose infusion rate (GIR), endogenous glucose appearance (EndoRa) and glucose disappearance (Rd) rates in both basal and insulin-clamped states were the same between chowfed mmp9−/− and gender-matched mmp9+/+ mice (Figures 4b, 4c, 4f, and 4g). Insulin-stimulated suppression of EndoRa and insulin-stimulated increase in Rd, calculated by the differences between basal and clamped EndoRa and Rd, were not different between genotypes in chow-fed mice (Figures 4c and 4g). A muscle glucose metabolic index, Rg was also comparable between chow-fed mmp9−/− and gender-matched mmp9+/+ mice in both gastrocnemius and superficial vastus lateralis (SVL) (Figures 4d and 4h). These results suggest that MMP9 deletion did not affect insulin action on a regular rodent chow diet.
In HF-fed mice, GIR was significantly lower in the mmp9−/− mice compared to mmp9+/+ mice for both males and females (Figures 5b and 5f). Consistent with lower GIR, insulin-stimulated increase in Rd during the clamp and muscle Rg in both gastrocnemius and SVL were also lower in the HF-fed mmp9−/− than those in HF-fed mmp9+/+ (Figures 5c, 5d, 5g, and 5h). In contrast, EndoRa at both basal and insulin-stimulated states, and insulin-stimulated suppression of EndoRa during the clamp did not differ between mmp9+/+ and mmp9−/− (Figures 5c and 5g). These data suggest that MMP9 deletion exacerbated muscle insulin action but did not affect hepatic insulin action in mice fed a HF diet.
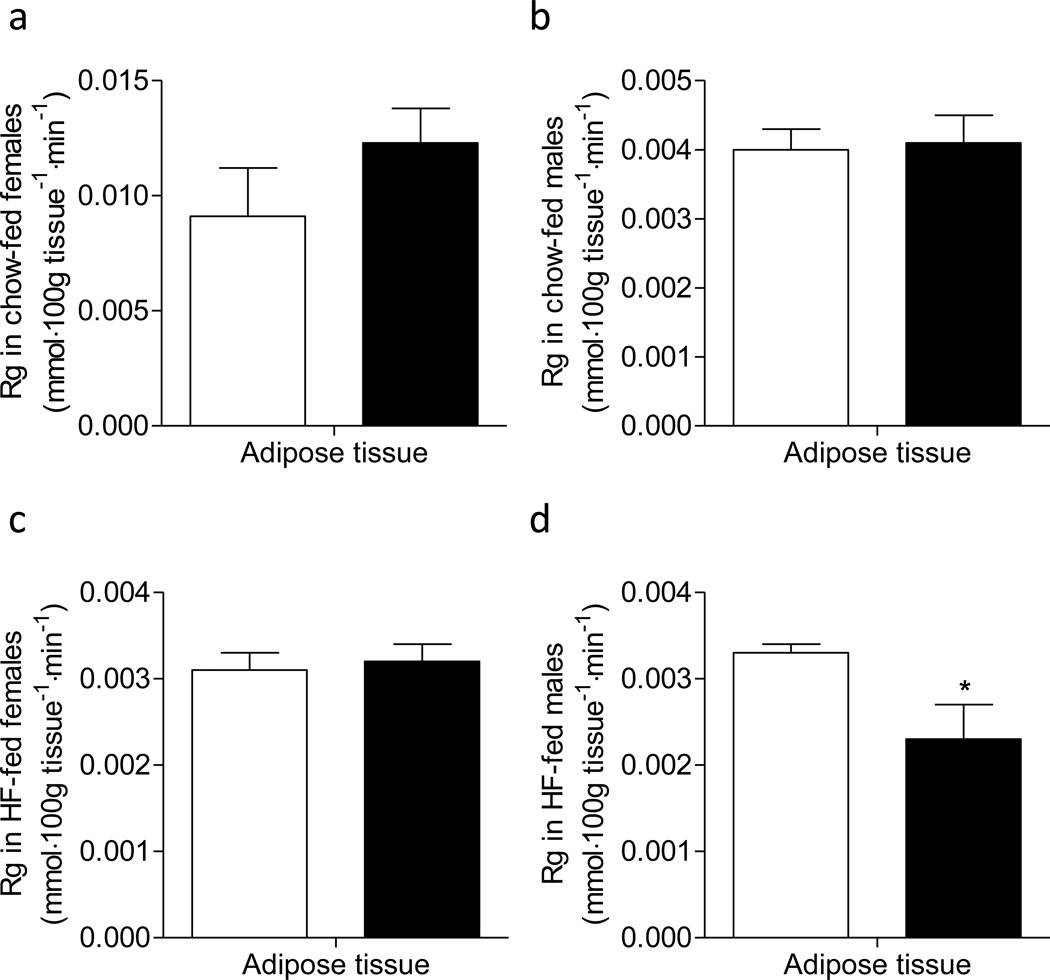
Rg in adipose tissue was the same between mmp9+/+ and mmp9−/− mice on chow diet, and between HF-fed weight-matched female mmp9+/+ and mmp9−/− mice (Figures 6a-c). In contrast, adipose Rg was lower in HF-fed male mmp9−/− compared to HF-fed male mmp9+/+ (Figure 6d).
Figure 6. Glucose metabolic index, Rg in adipose tissue.
Epididymal adipose tissue was freeze-clamped following the ICv and was measured for [14C]2DG uptake. White bars for mmp9+/+ and black bars for mmp9−/−. N is equal to 4–6. *p<0.05 when compared to mmp9+/+.
Mechanisms of worsened muscle insulin resistance in the HF-fed MMP9 null mice
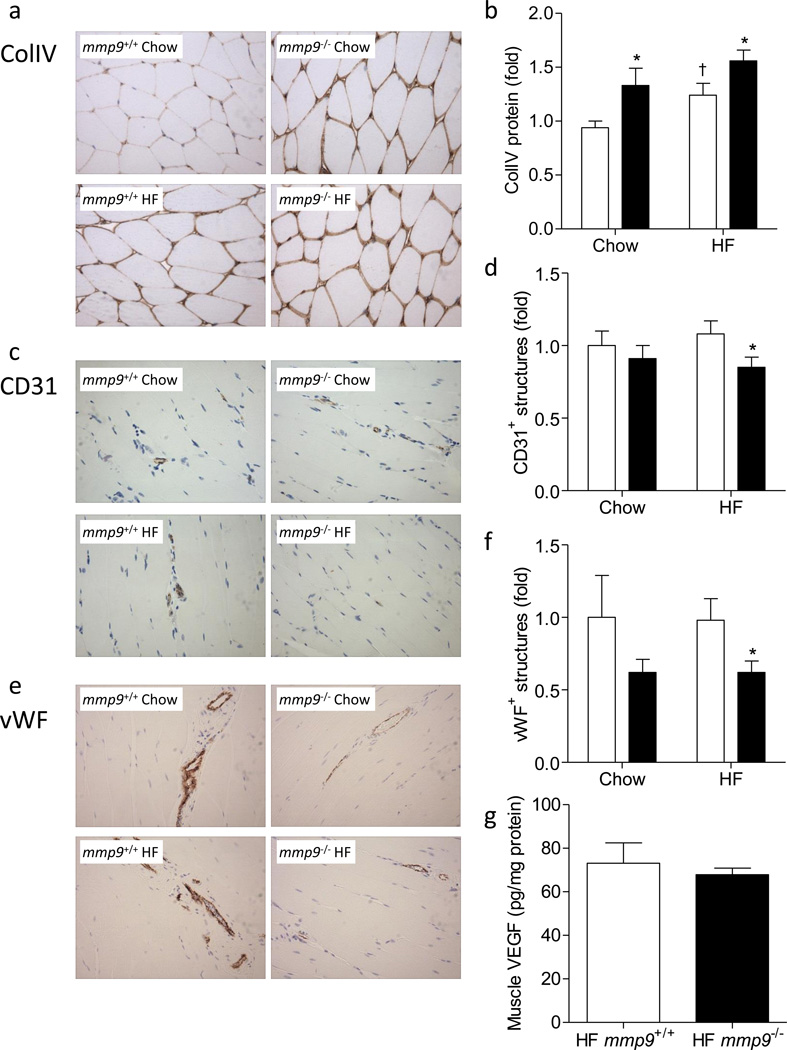
Protein expression of ColIV was measured in the muscle by immunohistochemistry. mmp9−/− increased muscle ColIV by 1.4 fold in the chow-fed mice (Figures 7a and 7b). HF feeding increased muscle ColIV by 1.3 fold in mmp9+/+. ColIV in HF-fed mmp9−/− was further increased compared to HF-fed mmp9+/+.
Figure 7. Muscle collagen deposition, vascularization, and VEGF concentration.
(a-f) Gastrocnemius muscle was fixed in 10% formalin following the ICv and was stained for ColIV, CD31, and vWF by immunohistochemistry. ColIV protein was measured by the integrated intensity of staining. Muscle vascularity was determined by counting CD31 positive structures and by measuring areas of vWF positive structures. No gender effect was observed in the staining of ColIV, CD31, or vWF. Data represent values from pooled female and male mice. (a, c, and e) Representative images. (b, d, and f) Quantitative data which were normalized to chow-fed mmp9+/+ mice. White bars for mmp9+/+ and black bars for mmp9−/−. (g) VEGF concentration was measured in muscle homogenates using mouse VEGF ELISA kit. N is equal to 6 for HF-fed mmp9+/+ mice and 5 for HF-fed mmp9−/− mice. *p<0.05 when compared to mmp9+/+ mice with the same diet; †p<0.05 when compared to chow-fed mice with the same genotype.
Muscle vascularization, examined by the numbers of CD31 positive capillaries and the vessel areas occupied by vWF positive structures, did not significantly differ between chow-fed mmp9+/+ and chow-fed mmp9−/− mice (Figures 7c-f). Muscle vascularization was however, significantly lower in the HF-fed mmp9−/− mice compared to HF-fed mmp9+/+ controls. HF diet feeding did not affect muscle vascularization regardless of genotype. Gender did not affect protein staining of ColIV, CD31, or vWF. Data presented in Figure 7 were collected from pooled female and male mice.
MMP9 has been suggested to stimulate the production and secretion of vascular endothelial growth factor (VEGF) [30, 31], a critical angiogenic factor regulating muscle vascularization and insulin action [25]. However, muscle VEGF concentration in HF-fed mmp9−/− mice was not different from that in HF-fed mmp9+/+ controls (Figure 7g).
Discussion
The study shows that MMP9, one of the key enzymes responsible for ECM proteolysis and remodeling, is necessary to protect against a more serious insulin resistance in HF-fed mice. Muscle of lean MMP9 null mice utilizes glucose normally despite increased ColIV deposition. ColIV is the primary basement membrane component and a predominant component of the ECM. These data suggest that ColIV and other MMP9 substrates (e.g. collagen V) do not pose a significant barrier to muscle glucose uptake in the absence of the pathophysiology resulting from HF feeding. We have previously reported that MMP9 activity is decreased in insulin resistant skeletal muscle of HF-fed mice, and that normalization of muscle insulin resistance is associated with rescued MMP9 activity and normalization of muscle collagen deposition [3]. The current study shows that reduced MMP9 in and of itself does not create insulin resistance in muscle or liver. When coupled with a HF diet, however, it results in a more profound insulin resistant state, specifically in skeletal muscle. This is consistent with our previous findings and further provides evidence that ECM turnover is a major component of the metabolic regulation of skeletal muscle in the pathology of diet-induced insulin resistance.
It has been shown previously that MMP9 deficiency causes abnormal growth plate development, however after 3 weeks of age, aberrant apoptosis, vascularization, and ossification compensate to remodel the enlarged growth plate and ultimately produce an axial skeletal of normal appearance [14]. Despite this transient skeleton phenotype, we found that genetic deletion of MMP9 did not affect the weight gain of lean mice up to 18 weeks of age. In the presence of HF diet, however, MMP9 deletion prevented HF diet-induced obesity and adiposity in female mice, but not in the male mice. These results suggest that MMP9 may interact with sex hormones (e.g. estrogen in the regulation of adiposity) to create sexual dimorphisms. This interaction is evidenced by the fact that estrogen causes a dose-dependent increase in the gene expression of MMP9 [32]. Furthermore, MMP9 protein was decreased in female mice after HF feeding, but not in the male mice, further suggesting that MMP9 exhibits sexually dimorphic responses in the presence of HF diet feeding. Further energy balance measurement shows that the prevention of HF diet-induced obesity and adiposity in the female null mice is associated with decreased average meal size and increased physical activity. However, differences in total food intake and energy expenditure were not manifested at the time of measurement before the body weight of the null mice statistically diverged from the controls. We postulate that decreased average meal size and increased physical activity in the null mice would lead to decreased food intake and increased energy expenditure after prolonged HF feeding (>6 weeks), which would contribute to decreased body weight gain in the female mmp9−/− mice. Decreased respiratory quotient in the null mice during the light cycle suggests that the female null mice prefers to fat as fuels during the light cycle when food consumption was low, which may also lead to decreased adiposity in these mice.
The differential responses to diet suggest that impaired muscle ECM remodeling due to MMP9 deletion has to be accompanied by HF diet-induced metabolic and/or inflammatory responses to regulate muscle insulin action. HF-diet feeding in mice is a well-established model of muscle insulin resistance [33], which is largely mediated by the macrophage-induced pro-inflammatory actions including elevated cytokine expression in the muscle [34]. It is possible that elevated cytokines in the muscle with HF diet interact with ECM components such as integrins and MMPs [35] activating signal transduction cascades that regulate substrate transport. Moreover, cytokines are also involved in regulating the processing of MMPs from inactive zymogens to active enzymes and regulate interstitial collagen gene expression [36, 37].
Body weight and body composition are important factors affecting insulin action in mice. The percent lean mass was higher in HF-fed female mmp9−/− mice compared to HF-fed female mmp9+/+ mice (Figure 2h). In the weight-matched mmp9+/+ and mmp9−/− mice, lean mass if different would be greater in the null mice. These data confirm that exacerbated insulin resistance in weight-matched HF-fed female mmp9−/− mice was not due to decreased lean mass. This, in fact, would indicate that the mmp9−/− mice were more insulin resistant per unit of lean mass. Results from clamp experiments in HF-fed female mice, in which genotypes were weight matched, were consistent with HF-fed male mice, which as a group exhibited no difference in body weight.
Exacerbated muscle insulin resistance in the HF-fed mmp9−/− mice was associated with a significant reduction in the numbers of CD31 positive structures and areas of vWF positive structures, both of which are endothelial markers. We postulate that one of the potential mechanisms by which MMP9 deletion worsens HF diet-induced muscle insulin resistance is impairment of capillary numbers. It has been suggested that impaired capillary density may be a cause of insulin resistance and type 2 diabetes [38–40]. In addition to the number of capillaries Kubota et al. have shown that impaired insulin signaling in endothelial cells, due to reduced Irs2 expression and insulin-induced eNOS phosphorylation, reduces insulin-stimulated glucose uptake by skeletal muscle in both ob/ob and HF diet-fed mice [41]. This was evidenced by reduced in vivo skeletal muscle glucose uptake during the hyperinsulinemic-euglycemic clamp in endothelial Irs2 null mice, whereas ex vivo glucose uptake in isolated skeletal muscle, where muscle cells are freely accessible to insulin and glucose, was not impaired [41]. Our results are also strongly supported by previous study showing that MMP9-null hypertrophic cartilage exhibits no angiogenic response in a collagen gel co-culture with endothelial cells in an in vitro angiogenesis assay [14]. The mechanism, by which MMP9 stimulates angiogenesis, has been suggested to be via the stimulation of production and secretion of VEGF [30, 31]. VEGF is a critical angiogenic factor regulating muscle vascularization and insulin action as muscle specific deletion of VEGF induces muscle capillary rarefaction and muscle insulin resistance in healthy lean mice [25]. However, muscle VEGF concentration was the same between HF-fed wild type and MMP9-null mice. Taken together, these results suggest that MMP9 regulates the myocellular response to insulin in HF-fed mice possibly by regulating muscle vascularization and potential regulation of perfusion by a mechanism independent of VEGF expression.
In addition to being diet specific, the effects of MMP9 deletion on insulin sensitivity also appear to be tissue specific. There were no effects observed on hepatic insulin action in the HF-fed mmp9−/− mice. The ability of insulin to suppress hepatic glucose production was the same in HF-fed mmp9+/+ and HF-fed mmp9−/− mice during the ICv clamp. This is not surprising since our data suggest that the major site of action of MMP9 is potentially in the endothelium. The liver was not affected possibly due to the fact that the liver has fenestrated sinusoidal endothelia cells [42, 43], and therefore is possibly less susceptible to dysfunctional endothelia. While the ability of insulin to suppress plasma NEFA levels was not affected, adipose tissue glucose uptake was decreased in the HF-fed male mmp9−/− mice. These results further emphasize the importance of MMP9 to metabolic processes.
We were the first to report a paradox such that plasma MMP9 activity increases while muscle MMP9 decreases in HF diet-induced insulin resistance in mice [3]. We hypothesized that the reduction in muscle MMP9 contributes to the accumulation of basement membrane collagen (ColIV) and the ECM mal-adaptations to HF diet. The question as to whether the observed effects are due to the whole body absence of MMP9 or a further reduction of muscle MMP9 is impossible to ascertain with certainty. It is notable, however, that the muscle was the specific site where insulin resistance was worsened (i.e. hepatic glucose production and arterial FFA concentrations were unaffected). Thus it seems reasonable to conclude that elimination of MMP9 specifically at the site of dysfunction is the primary to the exacerbation of insulin resistance.
In conclusion, our study demonstrates for the first time a critical role of MMP9 on the regulation of ECM remodeling, muscle capillaries, and muscle glucose uptake in response to insulin in the presence of HF diet feeding. These results are consistent with previous studies in humans highlighting the significance of muscle ECM adaptations in the insulin resistant state [1, 2]. More importantly, our findings that genetic deletion of MMP9 exacerbates HF diet-induced muscle insulin resistance have important clinical implications. Synthetic MMP inhibitors have failed in clinical trials treating cancers [44] but are currently considered as a therapy for inflammatory and vascular diseases [45]. The results of the present study provide evidence that the therapeutic application of MMP inhibitors may have adverse effects on insulin action.
Supplementary Material
Acknowledgments
We would like to thank the Vanderbilt Translational Pathology Shared Resource for performing the immunohistochemical staining of collagen IV, CD31, and von Willebrand factor. Part of the data from this study has been orally presented at the American Diabetes Association 72nd Scientific Sessions in 2012 and an abstract was published in “Orals”, Diabetes2012.
Funding
This work was supported by National Institutes of Health Grants DK054902 (DHW) and DK059637 (Mouse Metabolic Phenotyping Center; DHW). We would also like to thank the Vanderbilt Diabetes Research and Training Center (DK020593).
Abbreviations
- ECM
Extracellular matrix
- ColIV
Collagen IV
- MMP
Matrix metalloproteinase
- ICv
Hyperinsulinemic-euglycemic clamp
- HF
High fat
- GIR
Glucose infusion rate
- Ra
Glucose appearance rate
- EndoRa
Endogenous glucose appearance rate
- Rd
Glucose disappearance rate
- Rg
Glucose metabolic index
- [14C]2DG
2[14C]Deoxyglucose
- NEFA
Non-esterified fatty acid
- SVL
Superficial vastus lateralis
- GAPDH
Glyceraldehyde 3-phosphate dehydrogenase
- vWF
von Willebrand factor
- VEGF
Vascular endothelial growth factor
Footnotes
Contribution Statement
LK, experimental design, researched data, contributed discussion, and wrote manuscript. WM, FJ, and DB, researched data and reviewed the manuscript. DW, experimental design, reviewed data, contributed discussion, and reviewed/edited manuscript. All authors approved the final version of this manuscript.
Duality of Interest
The authors declare that there is no duality of interest associated with this manuscript.
References
- 1.Richardson DK, Kashyap S, Bajaj M, et al. Lipid infusion decreases the expression of nuclear encoded mitochondrial genes and increases the expression of extracellular matrix genes in human skeletal muscle. J Biol Chem. 2005;280:10290–10297. doi: 10.1074/jbc.M408985200. [DOI] [PubMed] [Google Scholar]
- 2.Berria R, Wang L, Richardson DK, et al. Increased collagen content in insulin-resistant skeletal muscle. Am J Physiol Endocrinol Metab. 2006;290:E560–E565. doi: 10.1152/ajpendo.00202.2005. [DOI] [PubMed] [Google Scholar]
- 3.Kang L, Ayala JE, Lee-Young RS, et al. Diet-induced muscle insulin resistance is associated with extracellular matrix remodeling and interaction with integrin alpha2beta1 in mice. Diabetes. 2011;60:416–426. doi: 10.2337/db10-1116. [DOI] [PMC free article] [PubMed] [Google Scholar]
- 4.Kang L, Lantier L, Kennedy A, et al. Hyaluronan Accumulates with High Fat Feeding and Contributes to Insulin Resistance. Diabetes. 2013;62:1888–1896. doi: 10.2337/db12-1502. [DOI] [PMC free article] [PubMed] [Google Scholar]
- 5.Thrailkill KM, Clay Bunn R, Fowlkes JL. Matrix metalloproteinases: their potential role in the pathogenesis of diabetic nephropathy. Endocrine. 2009;35:1–10. doi: 10.1007/s12020-008-9114-6. [DOI] [PMC free article] [PubMed] [Google Scholar]
- 6.Brinckerhoff CE, Matrisian LM. Matrix metalloproteinases: a tail of a frog that became a prince. Nature reviews Molecular cell biology. 2002;3:207–214. doi: 10.1038/nrm763. [DOI] [PubMed] [Google Scholar]
- 7.Weber BH, Vogt G, Pruett RC, Stohr H, Felbor U. Mutations in the tissue inhibitor of metalloproteinases-3 (TIMP3) in patients with Sorsby's fundus dystrophy. Nature genetics. 1994;8:352–356. doi: 10.1038/ng1294-352. [DOI] [PubMed] [Google Scholar]
- 8.Martignetti JA, Aqeel AA, Sewairi WA, et al. Mutation of the matrix metalloproteinase 2 gene (MMP2) causes a multicentric osteolysis and arthritis syndrome. Nature genetics. 2001;28:261–265. doi: 10.1038/90100. [DOI] [PubMed] [Google Scholar]
- 9.Peng WJ, Yan JW, Wan YN, et al. Matrix Metalloproteinases: A Review of Their Structure and Role in Systemic Sclerosis. Journal of clinical immunology. 2012;32:1409–1414. doi: 10.1007/s10875-012-9735-7. [DOI] [PubMed] [Google Scholar]
- 10.Nelson AR, Fingleton B, Rothenberg ML, Matrisian LM. Matrix metalloproteinases: biologic activity and clinical implications. J Clin Oncol. 2000;18:1135–1149. doi: 10.1200/JCO.2000.18.5.1135. [DOI] [PubMed] [Google Scholar]
- 11.Derosa G, Ferrari I, D'Angelo A, et al. Matrix metalloproteinase-2 and-9 levels in obese patients. Endothelium : journal of endothelial cell research. 2008;15:219–224. doi: 10.1080/10623320802228815. [DOI] [PubMed] [Google Scholar]
- 12.Signorelli SS, Malaponte G, Libra M, et al. Plasma levels and zymographic activities of matrix metalloproteinases 2 and 9 in type II diabetics with peripheral arterial disease. Vasc Med. 2005;10:1–6. doi: 10.1191/1358863x05vm582oa. [DOI] [PubMed] [Google Scholar]
- 13.Tinahones FJ, Coin-Araguez L, Mayas MD, et al. Obesity-associated insulin resistance is correlated to adipose tissue vascular endothelial growth factors and metalloproteinase levels. BMC physiology. 2012;12:4. doi: 10.1186/1472-6793-12-4. [DOI] [PMC free article] [PubMed] [Google Scholar]
- 14.Vu TH, Shipley JM, Bergers G, et al. MMP-9/gelatinase B is a key regulator of growth plate angiogenesis and apoptosis of hypertrophic chondrocytes. Cell. 1998;93:411–422. doi: 10.1016/s0092-8674(00)81169-1. [DOI] [PMC free article] [PubMed] [Google Scholar]
- 15.Acuff HB, Carter KJ, Fingleton B, Gorden DL, Matrisian LM. Matrix metalloproteinase-9 from bone marrow-derived cells contributes to survival but not growth of tumor cells in the lung microenvironment. Cancer research. 2006;66:259–266. doi: 10.1158/0008-5472.CAN-05-2502. [DOI] [PMC free article] [PubMed] [Google Scholar]
- 16.Ducharme A, Frantz S, Aikawa M, et al. Targeted deletion of matrix metalloproteinase-9 attenuates left ventricular enlargement and collagen accumulation after experimental myocardial infarction. J Clin Invest. 2000;106:55–62. doi: 10.1172/JCI8768. [DOI] [PMC free article] [PubMed] [Google Scholar]
- 17.Asahi M, Asahi K, Jung JC, del Zoppo GJ, Fini ME, Lo EH. Role for matrix metalloproteinase 9 after focal cerebral ischemia: effects of gene knockout and enzyme inhibition with BB-94. Journal of cerebral blood flow and metabolism : official journal of the International Society of Cerebral Blood Flow and Metabolism. 2000;20:1681–1689. doi: 10.1097/00004647-200012000-00007. [DOI] [PubMed] [Google Scholar]
- 18.Vermaelen KY, Cataldo D, Tournoy K, et al. Matrix metalloproteinase-9-mediated dendritic cell recruitment into the airways is a critical step in a mouse model of asthma. J Immunol. 2003;171:1016–1022. doi: 10.4049/jimmunol.171.2.1016. [DOI] [PubMed] [Google Scholar]
- 19.Collins S, Martin TL, Surwit RS, Robidoux J. Genetic vulnerability to diet-induced obesity in the C57BL/6J mouse: physiological and molecular characteristics. Physiol Behav. 2004;81:243–248. doi: 10.1016/j.physbeh.2004.02.006. [DOI] [PubMed] [Google Scholar]
- 20.Ayala JE, Bracy DP, McGuinness OP, Wasserman DH. Considerations in the design of hyperinsulinemic-euglycemic clamps in the conscious mouse. Diabetes. 2006;55:390–397. doi: 10.2337/diabetes.55.02.06.db05-0686. [DOI] [PubMed] [Google Scholar]
- 21.James DE, Burleigh KM, Kraegen EW. In vivo glucose metabolism in individual tissues of the rat. Interaction between epinephrine and insulin. J Biol Chem. 1986;261:6366–6374. [PubMed] [Google Scholar]
- 22.Ayala JE, Bracy DP, Julien BM, Rottman JN, Fueger PT, Wasserman DH. Chronic treatment with sildenafil improves energy balance and insulin action in high fat-fed conscious mice. Diabetes. 2007;56:1025–1033. doi: 10.2337/db06-0883. [DOI] [PubMed] [Google Scholar]
- 23.Steele R, Wall JS, De Bodo RC, Altszuler N. Measurement of size and turnover rate of body glucose pool by the isotope dilution method. Am J Physiol. 1956;187:15–24. doi: 10.1152/ajplegacy.1956.187.1.15. [DOI] [PubMed] [Google Scholar]
- 24.Kraegen EW, James DE, Jenkins AB, Chisholm DJ. Dose-response curves for in vivo insulin sensitivity in individual tissues in rats. Am J Physiol. 1985;248:E353–E362. doi: 10.1152/ajpendo.1985.248.3.E353. [DOI] [PubMed] [Google Scholar]
- 25.Bonner JS, Lantier L, Hasenour CM, James FD, Bracy DP, Wasserman DH. Muscle-specific vascular endothelial growth factor deletion induces muscle capillary rarefaction creating muscle insulin resistance. Diabetes. 2013;62:572–580. doi: 10.2337/db12-0354. [DOI] [PMC free article] [PubMed] [Google Scholar]
- 26.Olfert IM, Howlett RA, Tang K, et al. Muscle-specific VEGF deficiency greatly reduces exercise endurance in mice. The Journal of physiology. 2009;587:1755–1767. doi: 10.1113/jphysiol.2008.164384. [DOI] [PMC free article] [PubMed] [Google Scholar]
- 27.Tschop MH, Speakman JR, Arch JR, et al. A guide to analysis of mouse energy metabolism. Nature methods. 2012;9:57–63. doi: 10.1038/nmeth.1806. [DOI] [PMC free article] [PubMed] [Google Scholar]
- 28.Kaiyala KJ, Morton GJ, Leroux BG, Ogimoto K, Wisse B, Schwartz MW. Identification of body fat mass as a major determinant of metabolic rate in mice. Diabetes. 2010;59:1657–1666. doi: 10.2337/db09-1582. [DOI] [PMC free article] [PubMed] [Google Scholar]
- 29.Kaiyala KJ, Schwartz MW. Toward a more complete (and less controversial) understanding of energy expenditure and its role in obesity pathogenesis. Diabetes. 2011;60:17–23. doi: 10.2337/db10-0909. [DOI] [PMC free article] [PubMed] [Google Scholar]
- 30.Hollborn M, Stathopoulos C, Steffen A, Wiedemann P, Kohen L, Bringmann A. Positive feedback regulation between MMP-9 and VEGF in human RPE cells. Investigative ophthalmology & visual science. 2007;48:4360–4367. doi: 10.1167/iovs.06-1234. [DOI] [PubMed] [Google Scholar]
- 31.Bergers G, Brekken R, McMahon G, et al. Matrix metalloproteinase-9 triggers the angiogenic switch during carcinogenesis. Nature cell biology. 2000;2:737–744. doi: 10.1038/35036374. [DOI] [PMC free article] [PubMed] [Google Scholar]
- 32.Pompei LM, Steiner ML, Theodoro TR, et al. Effect of estrogen therapy on vascular perlecan and metalloproteinases 2 and 9 in castrated rats. Climacteric : the journal of the International Menopause Society. 2013;16:147–153. doi: 10.3109/13697137.2012.667173. [DOI] [PubMed] [Google Scholar]
- 33.Surwit RS, Kuhn CM, Cochrane C, McCubbin JA, Feinglos MN. Diet-induced type II diabetes in C57BL/6J mice. Diabetes. 1988;37:1163–1167. doi: 10.2337/diab.37.9.1163. [DOI] [PubMed] [Google Scholar]
- 34.Lee YS, Li P, Huh JY, et al. Inflammation is necessary for long-term but not short-term high-fat diet-induced insulin resistance. Diabetes. 2011;60:2474–2483. doi: 10.2337/db11-0194. [DOI] [PMC free article] [PubMed] [Google Scholar]
- 35.Sprague AH, Khalil RA. Inflammatory cytokines in vascular dysfunction and vascular disease. Biochemical pharmacology. 2009;78:539–552. doi: 10.1016/j.bcp.2009.04.029. [DOI] [PMC free article] [PubMed] [Google Scholar]
- 36.Amento EP, Ehsani N, Palmer H, Libby P. Cytokines and growth factors positively and negatively regulate interstitial collagen gene expression in human vascular smooth muscle cells. Arteriosclerosis and thrombosis : a journal of vascular biology / American Heart Association. 1991;11:1223–1230. doi: 10.1161/01.atv.11.5.1223. [DOI] [PubMed] [Google Scholar]
- 37.Galis ZS, Muszynski M, Sukhova GK, et al. Cytokine-stimulated human vascular smooth muscle cells synthesize a complement of enzymes required for extracellular matrix digestion. Circ Res. 1994;75:181–189. doi: 10.1161/01.res.75.1.181. [DOI] [PubMed] [Google Scholar]
- 38.Tooke JE, Goh KL. Endotheliopathy precedes type 2 diabetes. Diabetes Care. 1998;21:2047–2049. doi: 10.2337/diacare.21.12.2047. [DOI] [PubMed] [Google Scholar]
- 39.Tooke J. The association between insulin resistance and endotheliopathy. Diabetes, obesity & metabolism. 1999;1(Suppl 1):S17–S22. doi: 10.1046/j.1463-1326.1999.0010s1017.x. [DOI] [PubMed] [Google Scholar]
- 40.Pinkney JH, Stehouwer CD, Coppack SW, Yudkin JS. Endothelial dysfunction: cause of the insulin resistance syndrome. Diabetes. 1997;46(Suppl 2):S9–S13. doi: 10.2337/diab.46.2.s9. [DOI] [PubMed] [Google Scholar]
- 41.Kubota T, Kubota N, Kumagai H, et al. Impaired insulin signaling in endothelial cells reduces insulin-induced glucose uptake by skeletal muscle. Cell metabolism. 2011;13:294–307. doi: 10.1016/j.cmet.2011.01.018. [DOI] [PubMed] [Google Scholar]
- 42.Braet F, Wisse E. AFM imaging of fenestrated liver sinusoidal endothelial cells. Micron. 2012;43:1252–1258. doi: 10.1016/j.micron.2012.02.010. [DOI] [PubMed] [Google Scholar]
- 43.Cogger VC, McNerney GP, Nyunt T, et al. Three-dimensional structured illumination microscopy of liver sinusoidal endothelial cell fenestrations. Journal of structural biology. 2010;171:382–388. doi: 10.1016/j.jsb.2010.06.001. [DOI] [PMC free article] [PubMed] [Google Scholar]
- 44.Konstantinopoulos PA, Karamouzis MV, Papatsoris AG, Papavassiliou AG. Matrix metalloproteinase inhibitors as anticancer agents. The international journal of biochemistry & cell biology. 2008;40:1156–1168. doi: 10.1016/j.biocel.2007.11.007. [DOI] [PubMed] [Google Scholar]
- 45.Hu J, Van den Steen PE, Sang QX, Opdenakker G. Matrix metalloproteinase inhibitors as therapy for inflammatory and vascular diseases. Nature reviews Drug discovery. 2007;6:480–498. doi: 10.1038/nrd2308. [DOI] [PubMed] [Google Scholar]
Associated Data
This section collects any data citations, data availability statements, or supplementary materials included in this article.


