Background: The role of NLRP3 inflammasome in albuminuria-induced renal injury and the underlying mechanism remain elusive.
Results: Albumin-induced NLRP3 inflammasome activation resulted in the mitochondrial dysfunction, which in turn led to cellular phenotypic change and apoptosis.
Conclusion: NLRP3-inflammasome/mitochondria axis mediates albumin-induced renal tubular injury.
Significance: NLRP3-inflammasome/mitochondria axis not only contributes to the pathogenesis of albuminuria-induced kidney injury, it also serves as potential target for the treatment of kidney disease.
Keywords: Apoptosis, Epithelial Cell, Inflammasome, Kidney, Mitochondria, NLRP3 Inflammasome, Mitochondrial Dysfunction, Proteinuria, Renal Tubular Cells
Abstract
Proteinuria serves as a direct causative factor of renal tubular cell injury and is highly associated with the progression of chronic kidney disease via uncertain mechanisms. Recently, evidence demonstrated that both NLRP3 inflammasome and mitochondria are involved in the chronic kidney disease progression. The present study was undertaken to examine the role of NLRP3 inflammasome/mitochondria axis in albumin-induced renal tubular injury. In patients with proteinuria, NLRP3 was significantly up-regulated in tubular epithelial cells and was positively correlated with the severity of proteinuria. In agreement with these results, albumin remarkably activated NLRP3 inflammasome in both in vitro renal tubular cells and in vivo kidneys in parallel with significant epithelial cell phenotypic alteration and cell apoptosis. Genetic disruption of NLRP3 inflammasome remarkably attenuated albumin-induced cell apoptosis and phenotypic changes under both in vitro and in vivo conditions. In addition, albumin treatment resulted in a significant mitochondrial abnormality as evidenced by the impaired function and morphology, which was markedly reversed by invalidation of NLRP3/caspase-1 signaling pathway. Interestingly, protection of mitochondria function by Mn(III)tetrakis (4-benzoic acid) porphyrin (MnTBAP) or cyclosporin A (CsA) robustly attenuated albumin-induced injury in mouse proximal tubular cells. Collectively, these findings demonstrated a pathogenic role of NLRP3 inflammasome/caspase-1/mitochondria axis in mediating albumin-induced renal tubular injury. The discovery of this novel axis provides some potential targets for the treatment of proteinuria-associated renal injury.
Introduction
Proteinuria is a known marker of kidney disease and is also well recognized as an independent factor leading to renal tubular and tubulointerstitial lesions, which further promotes the progression of kidney injury and the loss of renal function (1, 2). In recent decades, a number of reports have suggested some potential pathogenic mechanisms of proteinuria-associated renal injury, including phenotypic changes in proximal tubular cells (3) and PKC-δ-mediated cell apoptosis (4). However, the detailed molecular mechanism remains unclear, and there is no effective therapeutic strategy in the clinic that acts by controlling a downstream target of proteinuria.
Renal proximal tubules are vulnerable to mitochondrial dysfunction in response to various insults, such as genetic mitochondrial cytopathy (5), toxic xenobiotics (6), and ischemia/reperfusion injury (7). Mitochondria are complex intracellular organelles that are involved in many metabolic circuitries, such as energy production, reactive oxygen species (ROS)2 generation, and calcium homeostasis, and in signaling transduction pathways, such as cell death pathways (8). Erkan et al. (9) have reported that mitochondrial abnormality is accompanied with albumin-induced apoptosis in human proximal tubular cells. However, the mechanism involved in albumin-induced mitochondrial dysfunction and the role of this mitochondrial abnormality in albumin-induced tubular cell injury remains unclear.
Inflammasomes are intracellular multiprotein complexes that can be activated by many danger signals, e.g. oxidative stress, potassium efflux, and monosodium urate crystals (10). Inflammasome activation triggers the maturation of proinflammatory cytokines, such as IL-1β and IL-18, to initiate innate immune defenses and subsequently induce cellular injury (10, 11). Among the inflammasomes, NLRP3 inflammasome is one of the best characterized. The NLRP3 inflammasome is formed after the oligomerization of NLRP3 and subsequent recruitment of adaptor ASC (apoptosis-associated Speck-like protein with a caspase-recruitment domain) and pro-caspase-1. The activation of NLRP3 inflammasome finally triggers the maturation of IL-1β and IL-18 via activated caspase-1. Growing evidence indicates that the NLRP3 inflammasome is associated with the progression of kidney diseases (12–14). Recently, several reports have further demonstrated that activation of inflammasome can be regulated by a mitochondrial mechanism (8, 15, 16). However, whether the inflammasome activation has an impact on mitochondrial function in proteinuria-induced renal injury remains unknown. In the present study, using genetic approaches, we fully investigated the following: 1) whether NLRP3 inflammasome induction is associated with proteinuria severity in patients; 2) whether NLRP3 inflammasome activation contributes to albumin-induced renal tubular injury; 3) whether activation of NLRP3 inflammasome mediates albumin-induced mitochondrial abnormality; 4) whether mitochondrial dysfunction is a causative factor of albuminuria-induced renal tubular cell injury.
MATERIALS AND METHODS
Reagents and Antibodies
DMEM-F12 medium and newborn bovine serum were purchased from Wisent Corporation (Wisent, Canada). BSA was obtained from Sigma. Rabbit polyclonal antibodies against E-cadherin, α-SMA, vimentin, caspase-1, and IL-18 and HRP-conjugated secondary antibodies were purchased from Santa Cruz Biotechnology (Santa Cruz, CA). Anti-NLRP3 antibody was obtained from Abcam (Cambridge, MA). Anti-IL-1β goat polyclonal antibody was purchased from R&D (Minneapolis, MN).
Human Renal Biopsy Specimens
Renal biopsy samples were obtained from patients undergoing diagnostic evaluation at the Department of Nephrology of Nanjing Children's Hospital affiliated to Nanjing Medical University (Nanjing, China). A total of 18 subjects (age range, 2–15 years old) were selected, based on the criterion of having at least 10 glomeruli in a paraffin-embedded tissue sample available for histological sectioning. All biopsy specimens were evaluated by a pathologist who was unaware of the results of the molecular studies (the information and histological diagnoses are listed in Table 1). The samples were divided into the following categories according to the severity of proteinuria: mild proteinuria (<1.0 g/24 h), moderate proteinuria (1.0–3.0 g/24 h), and severe proteinuria (>3.0 g/24 h). The normal renal tissues were attained from patients without proteinuria who needed partial nephrectomy for benign renal tumor. The study was approved by the ethics committee at Nanjing Children's Hospital (Nanjing, China).
TABLE 1.
The information and histological diagnoses of selected patients
| Number | Gender | Age | Proteinuria level | Histologic diagnosis |
|---|---|---|---|---|
| 1 | Male | 10 years 4 months | 0.16 g/24 h | IgA nephropathy |
| 2 | Male | 8 years 7 months | 0.63 g/24 h | IgA nephropathy |
| 3 | Male | 6 years 5 months | 0.24 g/24 h | Henoch-Schonlein purpura nephritis IIa |
| 4 | Male | 10 years 8 months | 0.64g/24 h | Henoch-Schonlein purpura nephritis IIIa |
| 5 | Male | 13 years 7 months | 0.88 g/24 h | Henoch-Schonlein purpura nephritis IIIa |
| 6 | Female | 3 years 10 months | 0.50 g/24 h | IgM nephropathy |
| 7 | Female | 10 years 11 months | 1.10g/24 h | Lupus nephritis IV-G |
| 8 | Male | 10 years 7 months | 2.36 g/24 h | Focal segmental glomerulosclerosis |
| 9 | Female | 7 years 2 months | 1.52 g/24 h | Henoch-Schonlein purpura nephritis IIIa |
| 10 | Male | 2 years 4 months | 1.71 g/24 h | IgM nephropathy |
| 11 | Female | 14 years 9 months | 2.09g/24 h | Membranous nephropathy |
| 12 | Female | 8 years 5 months | 2.88 g/24 h | IgA nephropathy |
| 13 | Male | 14 years 9 months | 8.45g/24 h | Mild mesangial proliferative glomerulonephritis |
| 14 | Female | 12 years 10 months | 3.78 g/24 h | Lupus nephritis II |
| 15 | Male | 4 years 5 months | 3.91 g/24 h | Henoch-Schonlein purpura nephritis IIIa |
| 16 | Male | 9 years 1 month | 4.73 g/24 h | Henoch-Schonlein purpura nephritis IIIa |
| 17 | Female | 13 years 3 months | 4.12 g/24 h | Henoch-Schonlein purpura nephritis IIIa |
| 18 | Male | 11 years 2 months | 3.59 g/24 h | Henoch-Schonlein purpura nephritis IIIb |
Animal Studies
Nlrp3−/− and caspase1−/− mice on a C57BL/6J-129 background (Jackson Laboratory, Sacramento, CA) were used to examine the roles of NLRP3 and caspase-1 in albumin overload-induced renal tubular injury. In particular, heterozygous littermates were bred to generate homozygous KO mice and littermate WT controls. Eight-week-old male mice were then subjected to daily intraperitoneal injection of delipidated, endotoxin-free BSA (Sigma) dissolved in saline or the same volume of saline (n = 8 per group) for 12 days. BSA was administered 5 days on a stepwise incremental dose regimen, rising from 2 mg/g of body weight on the first day to the maximum dose of 10 mg/g on day 5, which was thereafter maintained for 7 days (17). All mice were maintained on a 12-h light-dark cycle in a temperature-controlled (19–21 °C) room and were fed a standard rodent diet and allowed free access to drinking water. At the termination of the experiments, the mice were anesthetized with an intraperitoneal injection of a ketamine/xylazine/atropine mixture. Plasma and kidney samples were then immediately frozen in liquid nitrogen and stored at −80 °C until use. The study protocols were reviewed and approved by the Institutional Animal Care and Use Committee at Nanjing Medical University.
Cell Culture Studies
Mouse proximal tubular cells (mPTCs), an immortalized cell line, were grown in serum-free keratinocyte medium supplemented with bovine pituitary extract and epidermal growth factor (Wisent). The cells were specifically grown at 37 °C with 5% CO2 and subcultured at 50–80% confluence using 0.25% trypsin, 0.02% EDTA (Invitrogen). Delipidated albumin was used to stimulate mPTCs because albumin-bound lipids and fatty acids may contribute to the pro-apoptotic effects upon tubular cells (18).
siNLRP3 Transfection
mPTCs were cultivated to 50–60% confluence in culture medium containing no penicillin or streptomycin. NLRP3 siRNA and vehicle siRNA (scramble siRNA) were synthesized by GenePharma. Cells were then transfected with siRNA using Lipofectamine 2000 (Invitrogen) according to the manufacturer's instructions. In particular, the cells were transfected with 500 nm NLRP3siRNA or control siRNA 24 h before albumin treatment. The siRNA sequences are as follows: siNLRP3, 5′-CGGCCUUACUUCAAUCUGUTT-3′ and 5′-ACAGAUUGAAGUAAGGCCGTT-3′; scramble siRNA, 5′-UUCUCCGAACGUGUCACGUTT-3′ and 5′-ACGUGACACGUUCGGAGAATT-3′.
Quantitative Real Time PCR (qRT-PCR)
Total DNA and RNA were extracted using the DNeasy Tissue Kit (Qiagen) and TRIzol reagent (Invitrogen), respectively. Oligonucleotides were designed using Primer3 software and synthesized by Invitrogen. The sequences of the primer pairs are shown in Table 2. qRT-PCR was then used to detect the mitochondrial DNA (mtDNA) copy number and mRNA expression of target genes. Reverse transcription was performed using a reaction kit (Promega Reverse Transcription System) according to the manufacturer's protocol. Real time PCR amplification was performed using the ABI 7500 real time PCR detection system (Foster City, CA) with SYBR Green PCR Master Mix (Applied Biosystems). The cycling conditions were 95 °C for 10 min, followed by 40 cycles of 95 °C for 15 s and 60 °C for 1 min. The relative mtDNA copy number was normalized to the 18 S rRNA level encoded by the nuclear DNA, and mRNA levels were normalized to GAPDH as a control and calculated using the comparative cycle threshold (ΔΔCt) method.
TABLE 2.
Primer sequences for qRT-PCR
| Gene symbol | Primer sequences |
|---|---|
| GAPDH | 5′-GTCTTCACTACCATGGAGAAGG-3′ |
| 5′-TCATGGATGACCTTGGCCAG-3′ | |
| Nlrp3 | 5′-GTGGTGACCCTCTGTGAGGT-3′ |
| 5′-TCTTCCTGGAGCGCTTCTAA-3′ | |
| E-cadherin | 5′-GCCAAGCAGCAATACATCCT-3′ |
| 5′-GCCAAGCAGCAATACATCCT-3′ | |
| α-SMA | 5′-GACTCTCTTCCAGCCATCTTTC-3′ |
| 5′-TTCGTCGTATTCCTGTTTGCT-3′ | |
| Vimentin | 5′-ACTACTGCCGAGCGTGAGA-3′ |
| 5′-CCAATGAAAGATGGCTGGAA-3′ | |
| ND1 | 5′-ATCCTCCCAGGATTTGGAAT-3′ |
| 5′-ACCGGTAGGAATTGCGATAA-3′ | |
| ATP synthase | 5′-TCCATCAAAAACATCCAGAAAA-3′ |
| 5′-GAGGAGTGAATAGCACCACAAA-3′ | |
| 18 S | 5′-TTCGGAACTGAGGCCATGATT-3′ |
| 5′-TTTCGCTCTGGTCCGTCTTG-3′ |
Western Blotting
mPTCs were lysed using a protein lysis buffer containing 50 mm Tris, 150 mm NaCl, 10 mm EDTA, 1% Triton X-100, 200 mm sodium fluoride, and 4 mm sodium orthovanadate as a protease inhibitor (pH 7.5). Immunoblotting was then performed with primary antibodies against E-cadherin (1:800), α-SMA (1:1000), vimentin (1:1000), NLRP3 (1:500), IL-18 (1:500), IL-1β (1:500), caspase-1 (1:400), and β-actin (1:1000), followed by the addition of HRP-labeled secondary antibodies. The blots were visualized using the Amersham Biosciences ECL detection system. Densitometric analysis was performed using Quantity One software (Bio-Rad).
Hoechst 33258 Staining
mPTCs were grown on glass coverslips to measure apoptosis. After treatment, the mPTCs were stained with Hoechst 33258 and viewed by fluorescence microscopy.
Annexin V-Fluorescein Isothiocyanate Conjugated with Propidium Iodide Staining
After treatment, the cells were double stained with annexin V-fluorescein isothiocyanate and propidium iodide (annexin V:FITC apoptosis detection kit; BD Biosciences) according to the manufacturer's instructions. Quantification was then performed by flow cytometry.
Terminal Deoxynucleotidyl Transferase dUTP Nick End Labeling (TUNEL) Assay
Apoptosis in cultured cells or renal tissue was assessed using a TUNEL assay and identified using the in situ cell death detection kit (Roche) according to the manufacturer's protocol. In brief, sections were deparaffinized using xylene reagent. The deparaffinized sections were then incubated with proteinase K (30 μg/ml), followed by treatment with 0.3% hydrogen peroxide for 30 min at room temperature. Incubation with the TUNEL reaction mixture was performed in a humidified chamber at 37 °C. Converter-POD was added for signal conversion and incubated in a 3,3′-diaminobenzidine reaction mixture, which served as the chromogen. After dehydration, the sections were mounted in DPX.
Analysis of ROS Production, Mitochondrial Membrane Potential (MMP), and ATP Content
ROS production in mPTCs was measured by 2′,7′-dichlorofluorescein diacetate, as described previously (19). For the quantitation of ROS production, 2′,7′-dichlorofluorescein fluorescence levels were analyzed by flow cytometry. The MMP in mPTCs and isolated mitochondria was determined using the lipophilic cationic probe 5,5′,6,6′-tetrachloro-1,1′,3,3′-tetraethyl-benzimidazol-carbocyanine iodide (JC-1; Molecular Probes), as described previously (20). For the quantitation of MMP, JC-1 fluorescence levels were analyzed by flow cytometry. Additionally, ATP levels were determined using a luciferase-based bioluminescence assay kit (Sigma) according to the manufacturer's instructions.
Kidney Histopathological Analysis
Harvested kidney tissues from mice were fixed with 4% paraformaldehyde, embedded in paraffin, and sectioned transversely. Kidney sections (3 μm) were stained with periodic acid-Schiff.
Transmission Electron Microscopy
Fresh kidney tissues were fixed in 1.25% glutaraldehyde, 0.1 m phosphate buffer and postfixed in 1% OsO4,0.1 m phosphate buffer. Ultrathin sections (60 nm) were then cut on a microtome, placed on copper grids, stained with uranyl acetate and lead citrate, and examined under an electron microscope (JEOL JEM-1010, Tokyo, Japan).
Immunostaining
Kidneys were fixed in 4% paraformaldehyde and embedded in paraffin. Paraffin sections of each specimen were cut at a thickness of 3 μm (Cryostat 2800 Frigocut-E; Leica Instruments), and a standard protocol, using xylene and graded ethanol, was employed to deparaffinize and rehydrate the tissue. These sections were washed with PBS and treated with blocking buffer containing 50 mm NH4Cl, 2% BSA, and 0.05% saponin in PBS for 20 min at room temperature. The sections were then incubated overnight at 4 °C with anti-NLRP3 rabbit polyclonal antibody at 2–5 g/ml. After washing with PBS, the secondary antibody was applied, and the signals were visualized using an ABC kit (Santa Cruz Biotechnology).
Statistical Analysis
All data are presented as means ± S.D. The statistical analysis was performed using analysis of variance followed by Bonferroni's test with SPSS 13 statistical software. p < 0.05 was considered significant.
RESULTS
NLRP3 Expression in Kidneys of Patients with Proteinuria
Considering the importance of proteinuria in the progression of CKD and the close relationship between the NLRP3 inflammasome and CKD, we examined NLRP3 protein expression in renal biopsy specimens by immunohistochemistry. Patients with mild, moderate, or severe proteinuria were included in this study (mild proteinuria, 0.15–1.0 g/24 h; moderate proteinuria, 1.0–3.0 g/24 h; and severe proteinuria, >3.0 g/24 h). As shown in Fig. 1 (A and B), NLRP3 expression gradually increased as the severity of proteinuria increased. A correlation analysis also indicated that tubular NLRP3 expression was positively correlated with the proteinuria levels of patients (Fig. 1C). This result suggested that NLRP3 may be a pathogenic factor mediating proteinuria-induced tubular injury.
FIGURE 1.
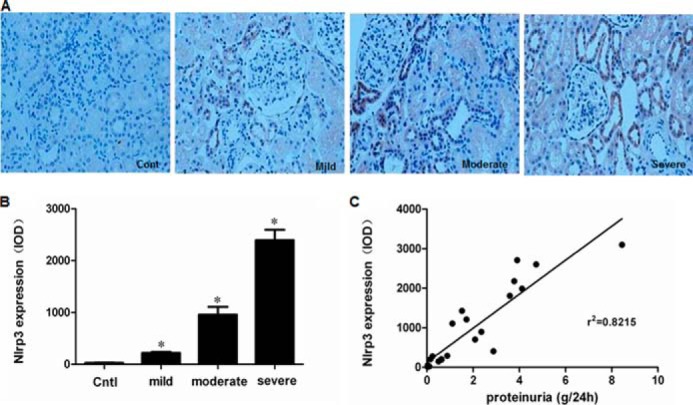
Expression of NLRP3 in renal biopsy specimens. A, NLRP3 expression, as detected by immunohistochemistry, in children with mild, moderate, or severe proteinuria. B, densitometric analysis of NLRP3 expression. C, correlation analysis of NLRP3 expression and proteinuria severity. The values represent the means ± S.D. (n = 6). *, p < 0.01 versus control (Cont or Cntl).
NLRP3 Inflammasome Activation Mediated Albumin Overload-induced Renal Tubular Injury and Mitochondrial Dysfunction in Mouse
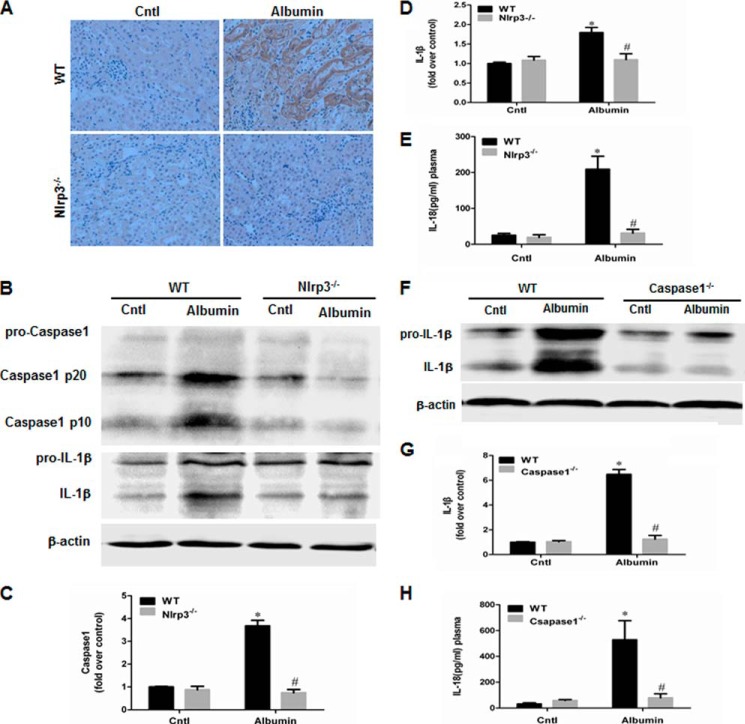
We investigated the in vivo role of NLRP3 and its downstream molecule caspase-1 in albumin overload-induced renal tubular injury using Nlrp3−/− and caspase1−/− mice. Consistent with the deletion of Nlrp3, albumin-induced NLRP3 immunoreactivity in renal tubules was absent in the kidneys of Nlrp3−/− mice (Fig. 2A), and the induction of capase-1 and IL-1β in the kidney was markedly blunted in Nlrp3−/− mice (Fig. 2, B–D). IL-18 secretion in the plasma was also reduced in albumin-overloaded Nlrp3−/− mice (Fig. 2E). Similarly, both IL-1β induction in the kidney and IL-18 secretion in the plasma were blocked in caspase1−/− mice (Fig. 2, F–H). Periodic acid-Schiff staining demonstrated the loss of the brush border and severe tubular atrophy in albumin-treated WT mice. Strikingly, such impairments were markedly attenuated in both KO mouse strains compared with the WT controls (Fig. 3, A and B). By TUNEL staining, the cell apoptotic response in the kidneys of WT mice induced by albumin overload was markedly blocked in both NLRP3 and caspase-1 KO mice (Fig. 3, C and D).
FIGURE 2.
Deletion of NLRP3 in mouse blocked albumin overload-induced NLRP3 inflammasome activation in kidney. A, NLRP3 expression, as detected by immunohistochemistry, in NLRP3 WT and KO mice after albumin overload. B, Western blots of the active caspase-1 and IL-1β in NLRP3 WT and KO mice following albumin overload. C, densitometric analysis of total active caspase-1 in NLRP3 WT and KO mice. D, densitometric analysis of IL-1β Western blot in NLRP3 WT and KO mice. E, ELISA analysis of plasma IL-18 concentration in NLRP3 WT and KO mice following albumin overload. F, Western blots of IL-1β in caspase-1 WT and KO mice after albumin overload. G, densitometric analysis of IL-1β Western blot in caspase-1 WT and KO mice. H, ELISA analysis of plasma IL-18 concentration in caspase-1 WT and KO mice following albumin overload. The values represent the means ± S.D. (n = 8). *, p < 0.01 versus control (Cntl); #, p < 0.01 versus albumin-overloaded WT mice.
FIGURE 3.
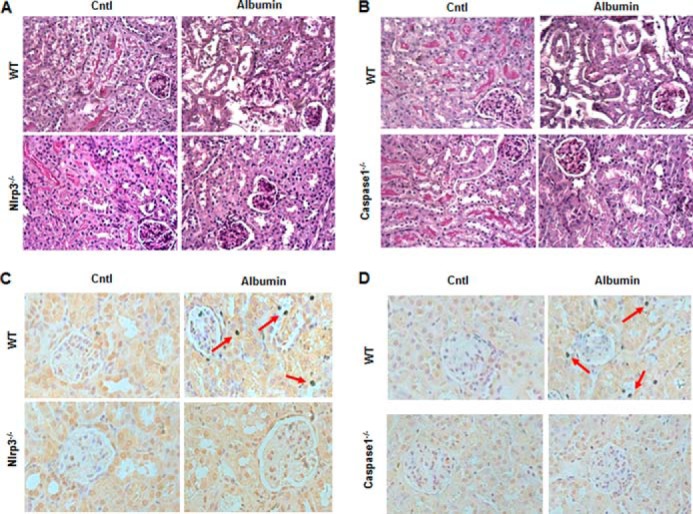
Deletion of NLRP3 in mouse attenuated albumin overload-induced tubular injury and cellular apoptosis. A, kidney periodic acid-Schiff staining in NLRP3 WT and KO mice following albumin overload. B, kidney periodic acid-Schiff staining in caspase-1 WT and KO mice following albumin overload. C, TUNEL staining in the kidney of NLRP3 WT and KO mice following albumin overload. D, TUNEL staining in the kidney of caspase-1 WT and KO mice following albumin overload. The arrows indicate TUNEL-positive tubular epithelial cells. Cntl, control.
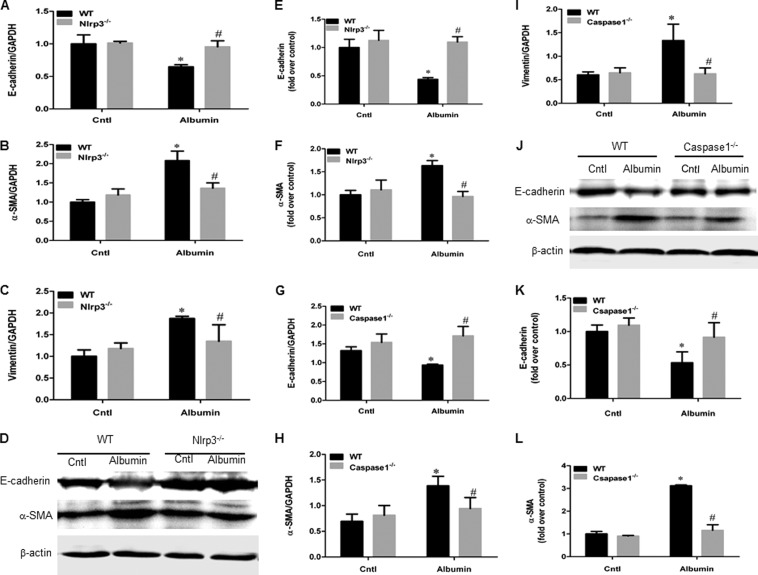
Next, we performed experiments to determine the role of NLRP3 and caspase-1 in albumin-induced phenotypic changes in tubular epithelial cell in albumin-overloaded mice. As shown in Fig. 4, albumin overload led to the loss of the epithelial cell marker E-cadherin and the up-regulation of the myofibroblast markers α-SMA and vimentin, which was significantly reversed by deletion of NLRP3 or caspase-1 compared with the albumin-overloaded WT mice (Fig. 4, A–L).
FIGURE 4.
Deletion of NLRP3 inflammasome in mouse blunted phenotypic changes of tubular epithelial cells induced by albumin overload. A, qRT-PCR analysis of E-cadherin in NLRP3 WT and KO mice. B, qRT-PCR analysis of α-SMA in NLRP3 WT and KO mice. C, qRT-PCR analysis of vimentin in NLRP3 WT and KO mice. D, Western blots of E-cadherin and α-SMA in NLRP3 WT and KO mice. E, densitometric analysis of E-cadherin in NLRP3 WT and KO mice. F, densitometric analysis of α-SMA in NLRP3 WT and KO mice. G, qRT-PCR analysis of E-cadherin in caspase-1 WT and KO mice. H, qRT-PCR analysis of α-SMA in caspase-1 WT and KO mice. I, qRT-PCR analysis of vimentin in caspase-1 WT and KO mice. J, Western blots of E-cadherin and α-SMA in caspase-1 WT and KO mice. K, densitometric analysis of E-cadherin in caspase-1 WT and KO mice. L, densitometric analysis of α-SMA in caspase-1 WT and KO mice. The values represent the means ± S.D. (n = 8). *, p < 0.01 versus control (Cntl); #, p < 0.01 versus albumin-overloaded WT mice.
In addition, albumin overload induced significant abnormality of mitochondrial morphology presented by mitochondrial swelling and disorganized and fragmented cristae and the mitochondrial dysfunction evidenced by the release of cytochrome c and reduction of ATP synthases and mtDNA copy number (Fig. 5, A–G). Such abnormalities were remarkably attenuated by deletion of NLRP3 or caspase-1 in mouse (Fig. 5, A–G). These results are highly suggestive of a detrimental role of Nlrp3/caspase-1 signaling in mediating albuminuria-induced renal tubular injury and mitochondrial dysfunction in vivo.
FIGURE 5.
Deletion of NLRP3 or caspase-1 inhibited albumin overload-induced mitochondrial dysfunction in mice. A, representative images of mitochondrial morphology by TEM in renal proximal tubular epithelial cells of NLRP3 WT and KO mice. B, Western blots of cytochrome c (CytC) in the cytosolic and mitochondrial fractions of kidney cortex in NLRP3 WT and KO mice. C, Western blots of cytochrome c in the cytosolic and mitochondrial fractions of kidney cortex in caspase-1 WT and KO mice. D, qRT-PCR analysis of ATP synthase in NLRP3 WT and KO mice. E, qRT-PCR analysis of ATP synthase in caspase-1 WT and KO mice. F, qRT-PCR analysis of mtDNA in NLRP3 WT and KO mice. G, qRT-PCR analysis of mtDNA in caspase-1 WT and KO mice. The values represent the means ± S.D. (n = 8). *, p < 0.01 versus control (Cntl); #, p < 0.01 versus albumin-overloaded WT mice.
Albumin Induced Mouse Proximal Tubular Cell (mPTC) Injury
Albumin is known to contribute to renal tubular epithelial cell injury. In the present study, we first examined whether albumin can induce injury in an mPTC cell line. As shown in Fig. 6 (A–C), albumin treatment induced cell apoptosis in a dose-dependent manner compared with vehicle treatment, as determined by Hoechst staining (Fig. 6A), TUNEL assay (Fig. 6B), and annexin V/flow cytometry (Fig. 6C). We also investigated albumin effects on the cellular phenotypic changes as determined by cell morphology and the expressions of E-cadherin, α-SMA, and vimentin. The morphological changes were assessed by phase contrast microscopy. Following exposure to 10 mg/ml albumin for 48 h, the cells displayed elongated and fibroblast-like morphology (Fig. 7A). In contrast, the control mPTC cells exhibited cobblestone-like morphology (Fig. 7A). With Western blotting, we found that albumin significantly down-regulated E-cadherin expression in both dose-dependent and time-dependent manners in contrast to the induction of α-SMA and vimentin expressions (Fig. 7, B–I). These results demonstrate that albumin substantially altered mPTC cell phenotype.
FIGURE 6.

Albumin treatment induced cell apoptosis in mPTC. A, Hoechst 33258 staining. B, TUNEL staining. Confluent mPTCs were exposed to vehicle or albumin (10 mg/ml) for 24 h. The arrows indicate chromatin condensation and fragmentation (A) or TUNEL-positive signals (B). C, quantification of apoptotic cells by flow cytometry. mPTCs were incubated with albumin at the indicated concentrations (0–20 mg/ml) for 24 h. The values represent the means ± S.D. (n = 6 in each group). *, p < 0.01 versus control (Cntl).
FIGURE 7.
Albumin treatment altered tubular epithelial cell phenotype. A, representative images of morphological changes. The cells were treated with vehicle or albumin (10 mg/ml) for 48 h. Photographs were taken using a Nikon microscope (phase contrast). B, Western blots of E-cadherin, α-SMA, and vimentin in mPCT cells treated by different concentration of albumin (0–20 mg/ml) for 48h. C–E, densitometric analysis of E-cadherin (C), α-SMA (D), and vimentin (E). F, Western blotting analysis of E-cadherin, α-SMA, and vimentin in mPTC cells treated by 10 mg/ml albumin in a time course study (0–48 h). G–I, densitometric analysis of E-cadherin (G), α-SMA (H), and vimentin (I) for the time course study. The values represent the means ± S.D. (n = 6). *, p < 0.01 versus control (Cntl).
siNLRP3 Attenuated Albumin-induced NLRP3 Inflammasome Activation and Cell Injury in mPTCs
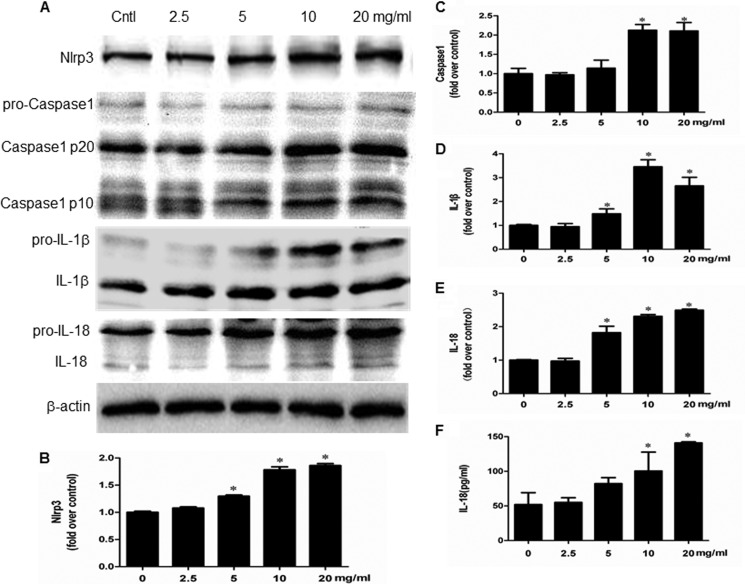
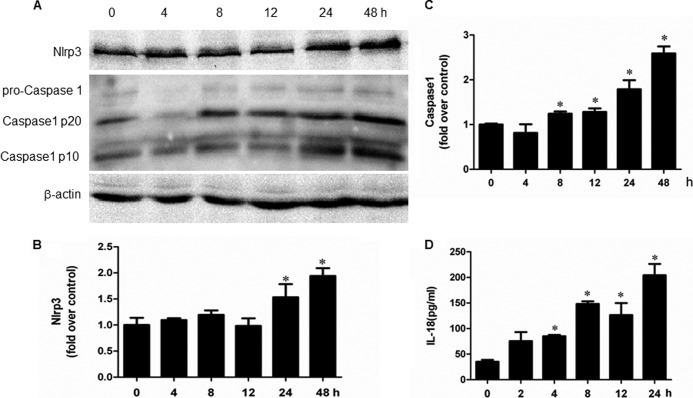
Indicators of inflammasome activation include the post-translational processing of caspase-1 and the proinflammatory cytokines IL-1β and IL-18. As shown in Fig. 8 (A–F), albumin directly activated NLRP3 inflammasome as shown by the induction of NLRP3 protein and its downstream components of caspase-1, IL-1β, and IL-18 in a dose-dependent manner. Moreover, a time-dependent activation of NLRP3 inflammasome by albumin was also observed (Fig. 9, A–D). By inhibition of NLRP3 via a siRNA strategy, albumin-induced activation of NLRP3/caspase-1/cytokines pathway was remarkably blunted (Fig. 10, A–G). Meanwhile, the cell apoptosis and phenotypic alteration was largely reversed by siNLRP3 (Fig. 11, A–F).
FIGURE 8.
Albumin dose-dependently activated NLRP3 inflammasome in mPTC cells. A, Western blots of NLRP3, active caspase-1, IL-1β, and IL-18. Cells were treated with albumin (0–20 mg/ml) for 24 h. B–E, densitometric analysis of NLRP3 (B), active caspase-1 (C), IL-1β (D), and IL-18 (E). F, ELISA analysis of IL-18 concentration in medium. Confluent mPTCs were incubated with albumin at the indicated concentrations for 24 h, and the medium was collected to detect IL-18 by ELISA. The values represent the means ± S.D. (n = 6). *, p < 0.01 versus control (Cntl).
FIGURE 9.
Albumin time-dependently activated NLRP3 inflammasome in mPTC cells. A, Western blots of NLRP3, active caspase-1. Cells were treated with albumin (10 mg/ml) for 0–48 h. B and C, densitometric analysis of NLRP3 (B) and active caspase-1 (C). D, ELISA analysis of IL-18 concentration in medium. Confluent mPTCs were incubated with albumin (10 mg/ml) for 0–48 h. The cell culture medium was collected to detect IL-18 by ELISA. The values represent the means ± S.D. (n = 6). *, p < 0.01 versus control.
FIGURE 10.
siNLRP3 prevented NLRP3 inflammasome activation in mPTC induced by albumin. A, Western blot of NLRP3 protein expression. Cells were transfected with siNLRP3 or scramble siRNA (Vehi), and untreated cells were used as the control (Cntl). B, densitometric analysis of NLRP3 following siNLRP3 transfection. C, Western blots of active caspase-1, IL-1β, and IL-18. Cells were transfected with siNlrp3 for 48 h and then incubated with albumin (10 mg/ml) for an additional 24 h. D–F, densitometric analysis of active caspase-1 (D), IL-1β (E), and IL-18 (F). G, ELISA analysis of IL-18 levels. Cells were transfected with siNlrp3 for 48 h and then incubated with albumin (10 mg/ml) for an additional 24 h. The cell culture medium was collected to detect IL-18 by ELISA. The values represent the means ± S.D. (n = 6). *, p < 0.01 versus vehicle; #, p < 0.01 versus albumin group.
FIGURE 11.
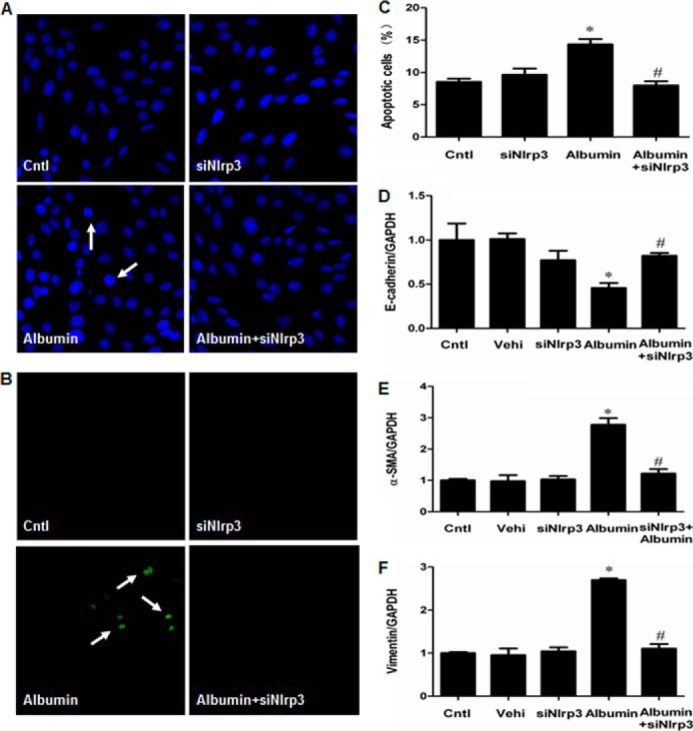
siNLRP3 prevented albumin-induced cell apoptosis and cell phenotypic alteration in mPTC. A, Hoechst 33258 staining. The arrows indicate chromatin condensation and fragmentation. B, TUNEL staining. The arrows indicate TUNEL-positive signals. C, quantification of apoptotic cells by flow cytometry. D–F, qRT-PCR analysis of E-cadherin (D), α-SMA (E), and vimentin (F) expressions. Confluent mPTCs were transfected with siNlrp3 for 48 h and then incubated with albumin (10 mg/ml) for an additional 24 h. The values represent the means ± S.D. (n = 6). *, p < 0.01 versus vehicle (Vehi); #, p < 0.01 versus albumin group. Cntl, control.
NLRP3-mediated Mitochondrial Dysfunction in Albumin-treated mPTCs Contributed to the Cellular Injury
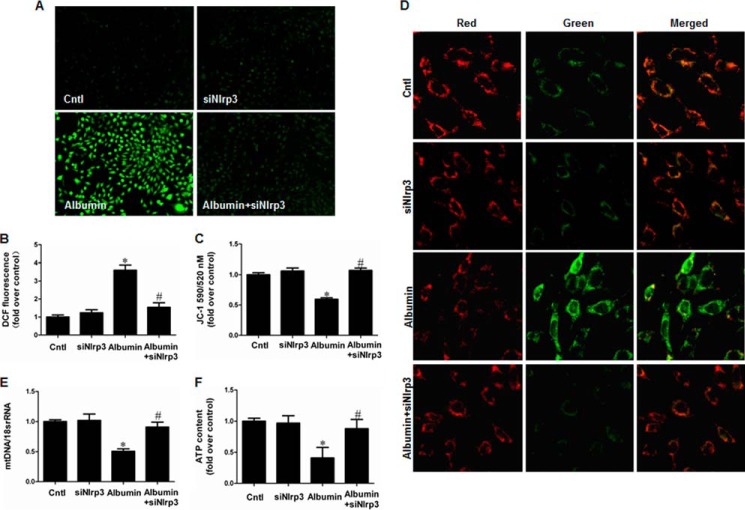
We next investigated the effects of NLRP3 on mitochondrial dysfunction and renal tubular injury in mPTCs subjected to the albumin. Strikingly, siNLRP3 rescued mitochondrial function in mPTCs, as shown by the decrease of ROS production and increases of MMP, ATP content, and mtDNA copy number (Fig. 12, A–F). Modulation of mitochondrial function by administration of MnTBAP (Fig. 13, A, B, and D) or CsA (Fig. 13, A, C, and E) strikingly reversed albumin-induced cell apoptosis (Fig. 14, A–D) and cell phenotypic alteration (Fig. 13, E–G).
FIGURE 12.
siNLRP3 effect on albumin-induced mitochondrial dysfunction in mPTCs. siNLRP3 inhibited albumin-induced mitochondrial dysfunction in mPTCs. Cells were transfected with siNlrp3 for 48 h and then incubated with albumin (10 mg/ml) for 24 h. A and B, ROS production. A, representative images of mPTCs stained with dichlorodihydrofluorescein diacetate. B, quantitation of 2′,7′-dichlorofluorescein fluorescence by flow cytometry. C and D, MMP. C, quantitation of JC-1 fluorescence by flow cytometry. D, representative images JC-1 staining. E, the mtDNA copy number. F, ATP content. The values represent the means ± S.D. (n = 6). *, p < 0.01 versus siNlrp3 group; #, p < 0.01 versus albumin group. Cntl, control.
FIGURE 13.
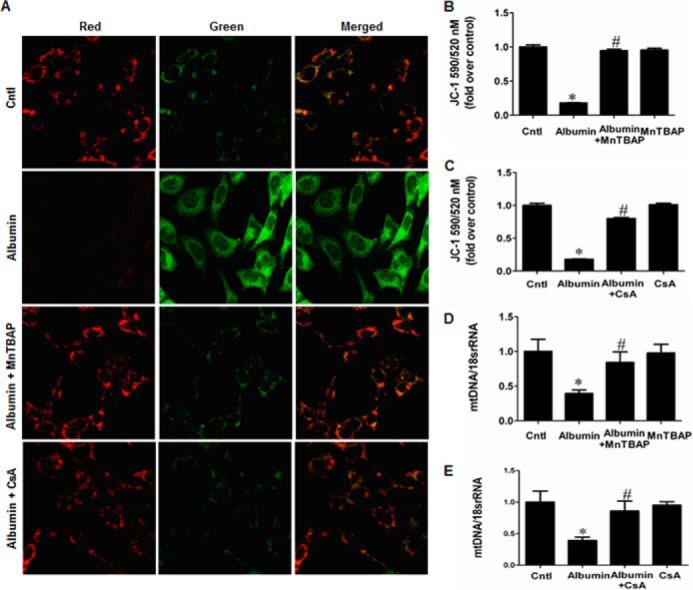
MnTBAP and CsA inhibited albumin-induced mitochondrial dysfunction in mPTCs. Cells were pretreated with MnTBAP (100 mm) or CsA (0.5 mg/ml) for 30 min, followed by incubation with albumin (10 mg/ml) for 24 h. A, representative photographs of JC-1 staining. B, MMP determined by JC-1 following MnTBAP treatment. C, MMP determined by JC-1 following CsA treatment. D, mtDNA copy number following MnTBAP treatment. E, mtDNA copy number following CsA treatment. The values represent the means ± S.D. (n = 6). *, p < 0.01 versus control (Cntl); #, p < 0.01 versus albumin-treated mPTCs.
FIGURE 14.
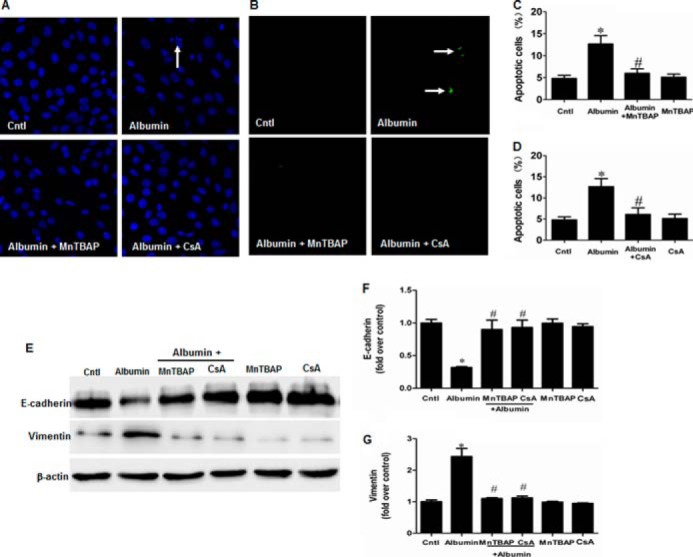
MnTBAP and CsA prevented albumin-induced cell apoptosis and cell phenotypic alteration in mPTC. A, Hoechst 33258 staining. The arrow indicates chromatin condensation and fragmentation. B, TUNEL staining. The arrows indicate TUNEL-positive signals. C, cell apoptosis following MnTBAP treatment determined by flow cytometry. D, cell apoptosis following CsA treatment determined by flow cytometry. Cells were pretreated with MnTBAP (100 mm) or CsA (0.5 mg/ml) for 30 min, followed by incubation with albumin (10 mg/ml) for 24 h. E, Western blots of E-cadherin and vimentin in mPTCs following albumin treatment with MnTBAP or CsA. Cells were pretreated with MnTBAP (100 mm) or CsA (0.5 mg/ml) for 30 min, followed by incubation with albumin (10 mg/ml) for 48 h. F, densitometric analysis of E-cadherin. G, densitometric analysis of vimentin. The values represent the means ± S.D. (n = 6). *, p < 0.01 versus control (Cntl); #, p < 0.01 versus albumin-treated mPTCs.
DISCUSSION
Proteinuria is a common feature of CKD, including primary and secondary kidney diseases, such as glomerulonephritis and diabetic nephropathy. Although proteinuria is a result of renal glomerular injury, it can also be a causative or aggravating factor of progressive renal damage. However, the mechanism underlying proteinuria-induced tubular injury is not fully understood. In present study, we use albumin-overload mouse model to explore the mechanism of proteinuria-induced tubular injury. Albumin overload is a widely used model to study the albumin effect on renal injury. The known mechanism is that intraperitoneal injection of albumin enhances serum albumin level, which subsequently increases the delivery of albumin into the tubular lumen.
Recently, the NLRP3 inflammasome has received increasing attention because of its involvement in the development and progression of various diseases (21, 22). The NLRP3 inflammasome is an innate complex that is activated by a variety of danger signals. Studies have suggested that the NLRP3 inflammasome, as a mediator of inflammation, contributes to CKD. Lichtnekert et al. (23) found a significant up-regulation of NLRP3 in the tubulointerstitial compartment of patients with systemic lupus erythematosus, IgA nephropathy, and anti-neutrophil cytoplasmic antibody-positive, rapidly progressive glomerulonephritis. Fang et al. (24) demonstrated that the downstream signaling components of the NLRP3 inflammasome, including caspase-1, IL-1β, and IL-18, were significantly up-regulated in the kidneys of proteinuric adults and were correlated with proteinuria severity. However, caspase-1, IL-1β, and IL-18 expression can also be stimulated via NLPR3-independent pathways (23, 25, 26). In the present study, we observed that NLRP3 itself was up-regulated in the kidneys of proteinuric children and positively correlated with proteinuria severity. Importantly, these results suggested that NLRP3 might be a contributor to proteinuria-related kidney injury in both adults and children.
In the literature, several reports have shown a detrimental role of NLRP3 in some nonproteinuric kidney injury models, such as unilateral ureteral obstruction (12) and ischemia/reperfusion injury (27, 28). In those studies, NLRP3 KO mice were significantly resistant to injury, possibly through inhibition of the inflammatory response (12, 27, 28). In proteinuric kidney injury models, the NLRP3 inflammasome has been shown to be involved in the pathogenesis of diabetic kidney disease (29, 30). However, hyperglycemia and metabolic disorders form a complicated pathogenic network underlying the mechanisms of diabetic kidney injury. To date, there is no direct evidence demonstrating the role of NLRP3 in proteinuria-associated renal injury. In the present study, we demonstrated that NLRP3 is a critical contributor to albumin-induced renal tubular injury as evidenced by both in vitro and in vivo studies. In particular, this is the first study to demonstrate that Nlrp3−/− mice and caspase1−/− mice are substantially resistant to albumin overload-induced tubular injury, possibly through a robust blockade of inflammatory response and cell apoptosis.
Our findings also supported the prevailing notion that the NLRP3 inflammasome functions as a general sensor of cell injury, which results in a host inflammatory response (31, 32). To date, a variety of exogenous and endogenous stimuli have been demonstrated to activate the NLRP3 inflammasome, including microbial stimuli, crystalline or aggregated substances, extracellular ATP, and necrotic cell components (10). Certain models have demonstrated how these stimuli are recognized by NLRP3 and trigger inflammasome activation (10). First, potassium (K+) efflux is a necessary signal upstream of NLRP3 activation (33, 34). Second, the generation of ROS is considered to be critical for inflammasome activation (35, 36). Third, the acidic lysosomal compartment can be sensed by NLRP3, triggering inflammasome activation (37–39). In the kidney, danger signals derived from various insults can ultimately activate the NLRP3 inflammasome and induce renal injury. In our study, renal tubular cell injury was induced by albumin under both in vitro and in vivo conditions via stimulation of NLRP3 inflammasome, which further stimulated our interest to investigate the downstream effectors of NLRP3 inflammasome in this model. Based on our previous reports showing the pathological role of mitochondria dysfunction in aldosterone-induced kidney injury (20) and the evidence from another group showing the mitochondrial dysfunction in albumin-treated renal tubular cells (9), we next examined the possible role of NLRP3 activation in the occurrence of mitochondrial dysfunction induced by albumin. Using siRNA to block NLRP3 activation in renal epithelial cells, we observed that the mitochondrial dysfunction induced by albumin was significantly attenuated. Using NLRP3 KO mice and caspase-1 KO mice, we reproduced the protective phenotype against albumin overload-induced renal mitochondrial dysfunction and renal tubular injury. These in vitro and in vivo data strongly suggested that NLRP3 inflammasome/mitochondria axis is crucial in mediating albumin-induced renal tubular injury.
In summary, the present study suggested that proteinuria could induce both NLRP3 inflammasome activation and mitochondrial dysfunction in renal tubular epithelial cells. Renal NLRP3 inflammasome induction was also observed in proteinuric patients, with a close correlation with the severity of proteinuria. Based on the data obtained from patients, animals, and in vitro cells, we concluded that NLRP3 is highly involved in the pathogenesis of proteinuria-induced renal tubular injury. Moreover, inhibition of NLRP3 inflammasome activation led to a remarkable amelioration of mitochondrial dysfunction and tubular cell injury under both in vitro and in vivo conditions. Currently, specific therapies targeting CKD progression are few, and inflammation and oxidative stress are undoubtedly important detrimental factors in CKD. Our characterization of the NLRP3 inflammasome/mitochondria axis in human and experimental kidney disease sheds new light on the pathogenesis and therapeutic targets of CKD, particularly of the proteinuric kidney diseases.
This work was supported by National Basic Research Program of China 973 Program Grants 2012CB517602 and 2013CB530604; National Natural Science Foundation of China Grants 81325004, 81270797, and 81170635; Natural Science Foundation of Jiangsu Province Grant BK2012001, and Program for New Century Excellent Talents in University Grant NCET-12-0738.
- ROS
- reactive oxygen species
- CKD
- chronic kidney disease
- mPTC
- mouse proximal tubular cell
- mtDNA
- mitochondrial DNA
- MMP
- mitochondrial membrane potential
- qRT-PCR
- quantitative real time PCR
- TUNEL
- transferase dUTP nick end labeling
- MnTBAP
- Mn(III)tetrakis (4-benzoic acid) porphyrin
- CsA
- cyclosporin A
- Cyt C
- cytochrome C
- α-SMA
- α-smooth muscle actin.
REFERENCES
- 1. Burton C., Harris K. P. (1996) The role of proteinuria in the progression of chronic renal failure. Am. J. Kidney Dis. 27, 765–775 [DOI] [PubMed] [Google Scholar]
- 2. Eddy A. A. (2004) Proteinuria and interstitial injury. Nephrol. Dial Transplant. 19, 277–281 [DOI] [PubMed] [Google Scholar]
- 3. Zoja C., Morigi M., Remuzzi G. (2003) Proteinuria and phenotypic change of proximal tubular cells. J. Am. Soc. Nephrol. 14, S36–S41 [DOI] [PubMed] [Google Scholar]
- 4. Li X., Pabla N., Wei Q., Dong G., Messing R. O., Wang C. Y., Dong Z. (2010) PKC-δ promotes renal tubular cell apoptosis associated with proteinuria. J. Am. Soc. Nephrol. 21, 1115–1124 [DOI] [PMC free article] [PubMed] [Google Scholar]
- 5. Niaudet P., Rötig A. (1996) Renal involvement in mitochondrial cytopathies. Pediatr. Nephrol. 10, 368–373 [DOI] [PubMed] [Google Scholar]
- 6. Izzedine H., Launay-Vacher V., Deray G. (2005) Antiviral drug-induced nephrotoxicity. Am. J. Kidney Dis. 45, 804–817 [DOI] [PubMed] [Google Scholar]
- 7. Shanley P. F., Rosen M. D., Brezis M., Silva P., Epstein F. H., Rosen S. (1986) Topography of focal proximal tubular necrosis after ischemia with reflow in the rat kidney. Am. J. Pathol. 122, 462–468 [PMC free article] [PubMed] [Google Scholar]
- 8. Kepp O., Galluzzi L., Kroemer G. (2011) Mitochondrial control of the NLRP3 inflammasome. Nat. Immunol. 12, 199–200 [DOI] [PubMed] [Google Scholar]
- 9. Erkan E., Devarajan P., Schwartz G. J. (2007) Mitochondria are the major targets in albumin-induced apoptosis in proximal tubule cells. J. Am. Soc. Nephrol. 18, 1199–1208 [DOI] [PubMed] [Google Scholar]
- 10. Tschopp J., Schroder K. (2010) NLRP3 inflammasome activation: the convergence of multiple signalling pathways on ROS production? Nat. Rev. Immunol. 10, 210–215 [DOI] [PubMed] [Google Scholar]
- 11. Martinon F., Burns K., Tschopp J. (2002) The inflammasome: a molecular platform triggering activation of inflammatory caspases and processing of proIL-β. Mol. Cell 10, 417–426 [DOI] [PubMed] [Google Scholar]
- 12. Vilaysane A., Chun J., Seamone M. E., Wang W., Chin R., Hirota S., Li Y., Clark S. A., Tschopp J., Trpkov K., Hemmelgarn B. R., Beck P. L., Muruve D. A. (2010) The NLRP3 inflammasome promotes renal inflammation and contributes to CKD. J. Am. Soc. Nephrol. 21, 1732–1744 [DOI] [PMC free article] [PubMed] [Google Scholar]
- 13. Bakker P. J., Butter L. M., Kors L., Teske G. J., Aten J., Sutterwala F. S., Florquin S., Leemans J. C. (2014) Nlrp3 is a key modulator of diet-induced nephropathy and renal cholesterol accumulation. Kidney Int. 85, 1112–1122 [DOI] [PubMed] [Google Scholar]
- 14. Zhao J., Wang H., Dai C., Zhang H., Huang Y., Wang S., Gaskin F., Yang N., Fu S. M. (2013) P2X7 blockade attenuates murine lupus nephritis by inhibiting activation of the NLRP3/ASC/caspase 1 pathway. Arthritis Rheum. 65, 3176–3185 [DOI] [PMC free article] [PubMed] [Google Scholar]
- 15. Green D. R., Galluzzi L., Kroemer G. (2011) Mitochondria and the autophagy-inflammation-cell death axis in organismal aging. Science 333, 1109–1112 [DOI] [PMC free article] [PubMed] [Google Scholar]
- 16. Dashdorj A., Jyothi K. R., Lim S., Jo A., Nguyen M. N., Ha J., Yoon K. S., Kim H. J., Park J. H., Murphy M. P., Kim S. S. (2013) Mitochondria-targeted antioxidant MitoQ ameliorates experimental mouse colitis by suppressing NLRP3 inflammasome-mediated inflammatory cytokines. BMC Med. 11, 178. [DOI] [PMC free article] [PubMed] [Google Scholar]
- 17. Eddy A. A., Kim H., López-Guisa J., Oda T., Soloway P. D. (2000) Interstitial fibrosis in mice with overload proteinuria: deficiency of TIMP-1 is not protective. Kidney Int. 58, 618–628 [DOI] [PubMed] [Google Scholar]
- 18. Thomas M. E., Harris K. P., Walls J., Furness P. N., Brunskill N. J. (2002) Fatty acids exacerbate tubulointerstitial injury in protein-overload proteinuria. Am. J. Physiol. Renal Physiol. 283, F640–F647 [DOI] [PubMed] [Google Scholar]
- 19. Huang S., Zhang A., Ding G., Chen R. (2009) Aldosterone-induced mesangial cell proliferation is mediated by EGF receptor transactivation. Am. J. Physiol. Renal Physiol. 296, F1323–F1333 [DOI] [PubMed] [Google Scholar]
- 20. Acton B. M., Jurisicova A., Jurisica I., Casper R. F. (2004) Alterations in mitochondrial membrane potential during preimplantation stages of mouse and human embryo development. Mol. Hum. Reprod. 10, 23–32 [DOI] [PubMed] [Google Scholar]
- 21. Wen H., Ting J. P., O'Neill L. A. (2012) A role for the NLRP3 inflammasome in metabolic diseases: did Warburg miss inflammation? Nat. Immunol. 13, 352–357 [DOI] [PMC free article] [PubMed] [Google Scholar]
- 22. Strowig T., Henao-Mejia J., Elinav E., Flavell R. (2012) Inflammasomes in health and disease. Nature 481, 278–286 [DOI] [PubMed] [Google Scholar]
- 23. Lichtnekert J., Kulkarni O. P., Mulay S. R., Rupanagudi K. V., Ryu M., Allam R., Vielhauer V., Muruve D., Lindenmeyer M. T., Cohen C. D., Anders H. J. (2011) Anti-GBM glomerulonephritis involves IL-1 but is independent of NLRP3/ASC inflammasome-mediated activation of caspase-1. PLoS One 6, e26778. [DOI] [PMC free article] [PubMed] [Google Scholar]
- 24. Fang L., Xie D., Wu X., Cao H., Su W., Yang J. (2013) Involvement of endoplasmic reticulum stress in albuminuria induced inflammasome activation in renal proximal tubular cells. PLoS One 8, e72344. [DOI] [PMC free article] [PubMed] [Google Scholar]
- 25. Oosting M., Buffen K., Malireddi S. R., Sturm P., Verschueren I., Koenders M. I., van de Veerdonk F. L., van der Meer J. W., Netea M. G., Kanneganti T. D., Joosten L. A. (2012) Murine Borrelia arthritis is highly dependent on ASC and caspase-1, but independent of NLRP3. Arthritis Res. Ther. 14, R247. [DOI] [PMC free article] [PubMed] [Google Scholar]
- 26. Cassel S. L., Janczy J. R., Bing X., Wilson S. P., Olivier A. K., Otero J. E., Iwakura Y., Shayakhmetov D. M., Bassuk A. G., Abu-Amer Y., Brogden K. A., Burns T. L., Sutterwala F. S., Ferguson P. J. (2014) Inflammasome-independent IL-1β mediates autoinflammatory disease in Pstpip2-deficient mice. Proc. Natl. Acad. Sci. U.S.A. 111, 1072–1077 [DOI] [PMC free article] [PubMed] [Google Scholar]
- 27. Kim H. J., Lee D. W., Ravichandran K., O Keys D., Akcay A., Nguyen Q., He Z., Jani A., Ljubanovic D., Edelstein C. L. (2013) NLRP3 inflammasome knockout mice are protected against ischemic but not cisplatin-induced acute kidney injury. J. Pharmacol. Exp. Ther. 346, 465–472 [DOI] [PMC free article] [PubMed] [Google Scholar]
- 28. Shigeoka A. A., Mueller J. L., Kambo A., Mathison J. C., King A. J., Hall W. F., Correia Jda S., Ulevitch R. J., Hoffman H. M., McKay D. B. (2010) An inflammasome-independent role for epithelial-expressed Nlrp3 in renal ischemia-reperfusion injury. J. Immunol. 185, 6277–6285 [DOI] [PMC free article] [PubMed] [Google Scholar]
- 29. Wang C., Pan Y., Zhang Q. Y., Wang F. M., Kong L. D. (2012) Quercetin and allopurinol ameliorate kidney injury in STZ-treated rats with regulation of renal NLRP3 inflammasome activation and lipid accumulation. PLoS One 7, e38285. [DOI] [PMC free article] [PubMed] [Google Scholar]
- 30. Chen K., Zhang J., Zhang W., Yang J., Li K., He Y. (2013) ATP-P2X4 signaling mediates NLRP3 inflammasome activation: a novel pathway of diabetic nephropathy. Int. J. Biochem. Cell Biol. 45, 932–943 [DOI] [PubMed] [Google Scholar]
- 31. Cassel S. L., Joly S., Sutterwala F. S. (2009) The NLRP3 inflammasome: a sensor of immune danger signals. Semin. Immunol. 21, 194–198 [DOI] [PMC free article] [PubMed] [Google Scholar]
- 32. Kim J. J., Jo E. K. (2013) NLRP3 inflammasome and host protection against bacterial infection. J. Korean Med. Sci. 28, 1415–1423 [DOI] [PMC free article] [PubMed] [Google Scholar]
- 33. Pétrilli V., Papin S., Dostert C., Mayor A., Martinon F., Tschopp J. (2007) Activation of the NALP3 inflammasome is triggered by low intracellular potassium concentration. Cell Death Differ. 14, 1583–1589 [DOI] [PubMed] [Google Scholar]
- 34. Marina-García N., Franchi L., Kim Y. G., Miller D., McDonald C., Boons G. J., Núñez G. (2008) Pannexin-1-mediated intracellular delivery of muramyl dipeptide induces caspase-1 activation via cryopyrin/NLRP3 independently of Nod2. J. Immunol. 180, 4050–4057 [DOI] [PubMed] [Google Scholar]
- 35. Zhou R., Tardivel A., Thorens B., Choi I., Tschopp J. (2010) Thioredoxin-interacting protein links oxidative stress to inflammasome activation. Nat. Immunol. 11, 136–140 [DOI] [PubMed] [Google Scholar]
- 36. Zhou R., Yazdi A. S., Menu P., Tschopp J. (2011) A role for mitochondria in NLRP3 inflammasome activation. Nature 469, 221–225 [DOI] [PubMed] [Google Scholar]
- 37. Hornung V., Bauernfeind F., Halle A., Samstad E. O., Kono H., Rock K. L., Fitzgerald K. A., Latz E. (2008) Silica crystals and aluminum salts activate the NALP3 inflammasome through phagosomal destabilization. Nat. Immunol. 9, 847–856 [DOI] [PMC free article] [PubMed] [Google Scholar]
- 38. Dostert C., Guarda G., Romero J. F., Menu P., Gross O., Tardivel A., Suva M. L., Stehle J. C., Kopf M., Stamenkovic I., Corradin G., Tschopp J. (2009) Malarial hemozoin is a Nalp3 inflammasome activating danger signal. PLoS One 4, e6510. [DOI] [PMC free article] [PubMed] [Google Scholar]
- 39. Halle A., Hornung V., Petzold G. C., Stewart C. R., Monks B. G., Reinheckel T., Fitzgerald K. A., Latz E., Moore K. J., Golenbock D. T. (2008) The NALP3 inflammasome is involved in the innate immune response to amyloid-β. Nat. Immunol. 9, 857–865 [DOI] [PMC free article] [PubMed] [Google Scholar]


