Background: Autophagosome membranes are believed to have a high content of unsaturated fatty acids, but the roles of unsaturated fatty acids in autophagy are not clear.
Results: Stearoyl-CoA desaturase 1 inhibitor 28c suppressed autophagy at the earliest stage of autophagosome formation.
Conclusion: Unsaturated fatty acids are required for autophagosome formation.
Significance: This study clarifies the importance of fatty acid desaturation in the autophagosome formation.
Keywords: Autophagy, Endoplasmic Reticulum (ER), Fatty Acid, Lipid Metabolism, Membrane, SCD1
Abstract
Autophagy is one of the major degradation pathways for cytoplasmic components. The autophagic isolation membrane is a unique membrane whose content of unsaturated fatty acids is very high. However, the molecular mechanisms underlying formation of this membrane, including the roles of unsaturated fatty acids, remain to be elucidated. From a chemical library consisting of structurally diverse compounds, we screened for novel inhibitors of starvation-induced autophagy by measuring LC3 puncta formation in mouse embryonic fibroblasts stably expressing GFP-LC3. One of the inhibitors we identified, 2,5-pyridinedicarboxamide, N2,N5-bis[5-[(dimethylamino)carbonyl]-4-methyl-2-thiazolyl], has a molecular structure similar to that of a known stearoyl-CoA desaturase (SCD) 1 inhibitor. To determine whether SCD1 inhibition influences autophagy, we examined the effects of the SCD1 inhibitor 28c. This compound strongly inhibited starvation-induced autophagy, as determined by LC3 puncta formation, immunoblot analyses of LC3, electron microscopic observations, and p62/SQSTM1 accumulation. Overexpression of SCD1 or supplementation with oleic acid, which is a catalytic product of SCD1 abolished the inhibition of autophagy by 28c. Furthermore, 28c suppressed starvation-induced autophagy without affecting mammalian target of rapamycin activity, and also inhibited rapamycin-induced autophagy. In addition to inhibiting formation of LC3 puncta, 28c also inhibited formation of ULK1, WIPI1, Atg16L, and p62/SQSTM1 puncta. These results suggest that SCD1 activity is required for the earliest step of autophagosome formation.
Introduction
Macroautophagy (hereafter referred to as autophagy) is a major pathway for degradation for cytoplasmic components. Autophagy plays roles in diverse physiological processes, including adaptation to starvation, clearance of intracellular proteins and damaged organelles, immunity, tumor suppression, and cell death (1). Autophagy is initiated by the emergence of an isolation membrane that encloses portions of the cytoplasm to form a double-membrane autophagosome. Autophagosomes fuse with endosomes and lysosomes sequentially to become autolysosomes, whose contents are degraded by lysosomal hydrolases. The isolation membrane is a unique membrane that contains several intramembrane particles (2–4) and a high content of unsaturated fatty acids (5). The origin of the isolation membrane has been the subject of a long running debate (6).
Axe et al. (7) reported that isolation membranes arise from omegasomes, phosphatidylinositol 3-phosphate (PtdIns(3)P)3-enriched domains of the ER. We showed that a subdomain of the ER forms a cradle encircling the isolation membrane, and that the ER membrane is interconnected to the isolation membrane (8). More recently, Hamasaki et al. (9) showed that autophagosomes form at ER-mitochondria contact sites. These observations strongly suggest the ER as a primary origin of the isolation membrane. However, the molecular mechanisms of autophagosome formation, including the dynamics of proteins and lipids and the role of the mitochondria, remain to be elucidated.
The discovery of autophagy-related genes (Atg) by Ohsumi (10) tremendously accelerated studies of autophagy. The kinase Atg1 (ULK1 in mammals), which forms a complex with Atg13·Atg101·FIP200 (11, 12), is an upstream regulator of the Atg protein cascades. Under nutrient-rich conditions, the serine-threonine kinase mTOR phosphorylates and suppresses ULK1. After starvation, mTOR activity is depressed, and ULK1 is dephosphorylated, resulting in its activation (13). AMP-dependent kinase (AMPK) also activates ULK1 by phosphorylating different sites from those targeted by mTOR (14). The activated ULK1·Atg13·Atg101·FIP200 complex is recruited to sites of autophagosome formation, which correspond to omegasomes. The localization pattern of the complex changes from diffuse to punctate during the formation of autophagosomes. Simultaneously, the PtdIns 3-kinase complex Vps34·Vps15·Beclin-1 is recruited to autophagosome formation sites on the ER via Atg14L. This complex is activated by phosphorylation of Beclin-1 by ULK1 (15); when activated, the complex produces PtdIns(3)P (16). Subsequently, PtdIns(3)P-binding proteins such as WIPI1 (17) and double FYVE-containing protein 1 (7), the Atg12·Atg5·Atg16L complex (18), and LC3 (19) are also recruited to sites of autophagosome formation, and these proteins form puncta in a hierarchical manner (20). However, the details of the underlying biochemical cascades remain obscure.
In addition to discovery of autophagy-related genes, the discovery of drugs that target autophagy, such as 3-methyladenine and rapamycin, has also contributed greatly to elucidation of the mechanisms of autophagy (21, 22). Whereas many autophagy-inducing agents (e.g. rapamycin) have been discovered, only a small number of inhibitors of autophagy have been reported. Two well known inhibitors of autophagy are 3-methyladenine and wortmannin, both of which suppress autophagosome formation at the same step, production of PtdIns(3)P, by inhibiting PtdIns 3-kinase (23). Identification of new inhibitors of autophagy will be essential to advance the study of autophagy.
In this study, we identified several inhibitors of autophagy by screening a chemical library consisting of structurally diverse small molecules. In this screen, we counted LC3 puncta after starvation in mouse embryonic fibroblasts stably expressing GFP-LC3 (GFP-LC3 MEFs). One of the inhibitors we identified, 2,5-pyridinedicarboxamide, N2,N5-bis[5-[(dimethylamino)carbonyl]-4-methyl-2thiazolyl], is structurally similar to a previously known stearoyl-CoA desaturase (SCD) 1 inhibitor (24). Furthermore, another SCD1 inhibitor, 28c (25), also inhibited autophagy. Together, these observations suggest that SCD1 activity is required for autophagy. During our study of the role of SCD1 in mammalian autophagy, we became aware of a report from Köhler et al. (26) demonstrating that autophagy is suppressed by knock-out of a Drosophila SCD homolog, Desat1. Although that study did not reveal the processes of autophagy that require SCD in Drosophila, those results, in conjunction with the results of our study, suggest that SCD activity may be generally important for autophagy. Ours is the first report that demonstrates a requirement for SCD1 activity in mammalian autophagy.
EXPERIMENTAL PROCEDURES
Small-molecule Screening Library
An in-house small-molecule library consisting of 528 synthetic compounds was designed with an emphasis on structural diversity,4 and used to screen for novel inhibitors of autophagy. These chemicals were dissolved in dimethyl sulfoxide at a concentration of 2 mg/ml, stored as stock solutions at −30 °C, and used at final concentrations of 10–20 μg/ml for screening.
Other Chemicals
Rapamycin and bafilomycin A1 were purchased from Wako Pure Chemical Industries. Ltd. (Osaka, Japan), dissolved in dimethyl sulfoxide at concentrations of 5 mm and 100 μm, respectively, stored as stock solutions at −30 °C, and used at final concentrations of 1 μm and 100 nm, respectively. The SCD1 inhibitor 28c was purchased from Santa Cruz Biotechnology, Inc. (sc205109), diluted in dimethyl sulfoxide as a stock solution (10 mg/ml), stored at −30 °C, and used within a few months at a final concentration of 20 μg/ml. SCD1 siRNAs were used at a final concentration of 10 nm. Oleic acid-BSA conjugates (OA-BSA) were purchased from Sigma, and used at a final concentration of 500 μm. Palmitic acid-BSA conjugates (PA-BSA) were prepared by a modification of the method of Hannah et al. (27). Palmitic acid (PA) was purchased from Cayman Chemical (Ann Arbor, MI). PA was dissolved in ethanol at 100 mm, and this stock solution was stored at 4 °C. PA solution (50 μl) was precipitated with 62.5 μl of 2 n NaOH, and 387.5 μl of ethanol was added. The resultant solution was evaporated under nitrogen gas, and then reconstituted with 1 ml of pre-warmed saline. Then, 1.25 ml of 10% BSA (fatty acid free, Sigma) dissolved in saline was added to this solution; the pH was adjusted to 7.0 with 2 n HCl, and saline was added to a volume of 2.5 ml. The resultant solution was filtered and stored at −30 °C.
Antibodies
Rabbit anti-GFP antibody was kindly provided by Professor Nobuhiro Nakamura (Kyoto Sangyo University, Japan). Rabbit anti-LC3 antibody was obtained from Novus Biologicals (Littleton, CO). Mouse anti-LC3 antibody and rabbit anti-Atg16L antibody were from Cosmo Bio Co., Ltd. (Tokyo, Japan). Guinea pig polyclonal anti-p62/SQSTM1 antibody was from Progen Biotechnik GmbH (Heidelberg, Germany). Hamster monoclonal anti-Atg9A antibody was from Abcam (Cambridge, UK). Rabbit anti-phospho-AMPKα (Thr172) antibody, rabbit anti-S6 ribosomal protein antibody, and rabbit anti-phospho-S6 ribosomal protein (Ser235/236) antibody were from Cell Signaling Technology, Inc. (Danvers, MA). Rabbit anti-SCD1 antibody was from Santa Cruz Biotechnology. Mouse anti-α-tubulin antibody was from Sigma. Goat anti-rabbit IgG, anti-hamster IgG, and anti-guinea pig antibody conjugated to Alexa Fluor 546 were from Invitrogen. Horseradish peroxidase (HRP)-conjugated goat anti-rabbit IgG, anti-mouse IgG, and anti-guinea pig IgG antibodies were from Jackson ImmunoResearch Laboratories (West Grove, PA).
Cell Culture and Treatment with Chemicals
In this study, we used MEFs stably expressing GFP-LC3, GFP-ULK1 (20), or GFP-WIPI1 (20) mainly for analysis of puncta formation; MEFs stably expressing GFP-p62/SQSTM1 (p62/SQSTM1 MEFs) (28) for immunoblot analysis of p62/SQSTM1; NIH3T3 cells for immunoblot and SCD1-overexpression experiments; and HeLa cells for knockdown experiments and immunofluorescence microscopy. GFP-LC3 MEFs were kindly provided by Professor Tamotsu Yoshimori (Osaka University, Japan). GFP-LC3 MEFs, p62/SQSTM1 MEFs, HeLa cells, and NIH3T3 cells were cultured in regular medium: Dulbecco's modified Eagle's medium with 10% fetal bovine serum and 2 mm l-glutamine (l-Gln) under 5% CO2. MEFs stably expressing WIPI1 and ULK1 were maintained in DMEM containing 10% FBS, 2 mm l-Gln, and 1 μg/ml of puromycin (20). To induce autophagy, cells were incubated for 2 h in starvation medium (Earle's balanced salt solution). For chemical treatment, cells were incubated for 2 h in starvation medium containing the indicated chemicals. For addition of oleic acid (OA) or PA, cells were incubated in regular or starvation medium containing 500 μm OA-BSA conjugate or 100 μm PA-BSA conjugate. As vehicle control, 1.25% BSA was used.
Knockdown of SCD1
RNA interference against SCD1 was carried out as described in Ariyama et al. (29). In brief, HeLa cells were transfected with SCD1 siRNAs at a final concentration of 10 nm using Lipofectamine RNAiMAX (Invitrogen). Cells were then cultured in regular medium for 72 h.
Immunoblot Analysis
Cells were lysed in SDS sample buffer: 0.05 m Tris-HCl (pH 6.8), 2% SDS, 6% β-mercaptoethanol, 10% glycerol, and 1% bromophenol blue. Protein contents of cell lysates were determined by reducing-agent compatible and detergent-compatible assay (Bio-Rad), and equal amounts of protein (30 μg) were electrophoresed through 12% polyacrylamide gels and transferred to polyvinylidene difluoride (PVDF) membranes (GE Healthcare, Little Chalfont, UK). Membranes were blocked with 5% nonfat milk and subsequently incubated for 1 h with rabbit anti-LC3 antibody, guinea pig anti-p62/SQSTM1 antibody, rabbit anti-SCD1 antibody, or mouse anti-α-tubulin antibody, and then incubated with HRP-conjugated anti-rabbit, anti-guinea pig, or anti-mouse IgG antibody followed by exposure to ECL detection reagents (GE Healthcare). Densitometric analysis was performed using electrophoresis analysis software (Fujifilm Co., Tokyo, Japan).
Measurement of Autophagy by Fluorescent Microscopy
Cells expressing GFP-LC3 in culture medium were washed with phosphate-buffered saline (PBS) and fixed in 4% paraformaldehyde in 0.1 m phosphate buffer (pH 7.4 (PB)), for 10 min. Cells were washed in PBS three times for 5 min, and then observed under an Axiovert 200 fluorescence microscope (Zeiss, Gottingen, Germany). For quantitative analyses, micrographs were taken randomly, and the numbers of LC3 puncta per cell were counted.
Immunofluorescence Microscopy
MEFs in culture medium were washed with PBS and fixed in 4% paraformaldehyde in PB for 10 min. After fixation, the cells were permeabilized with 100 μg/ml of digitonin or 0.01% Triton X-100 in PBS for 10 min, and then blocked for 30 min with blocking solution (PBS containing 2% BSA and 2% goat serum). The cells were then incubated for 30 min with rabbit anti-Atg16L serum (diluted 200×), mouse anti-LC3 antibody (1 μg/ml), or hamster monoclonal anti-Atg9A antibody (10 μg/ml) diluted in blocking solution. After washing, cells were incubated for 30 min with the appropriate secondary antibodies (goat anti-rabbit IgG, goat anti-mouse IgG, or goat anti-hamster IgG conjugated with Alexa Fluor 546) diluted in blocking solution, and then washed with PBS.
Finally, the cells were observed under an Axiovert 200 fluorescence microscope. For confocal microscopy, a Fluoview FV1000 (Olympus, Tokyo, Japan) was used.
Electron Microscopy
Cells were cultured on Cell Desk substrates (Sumitomo Bakelite Co., Ltd., Tokyo, Japan) in 24-well plates. Cells were fixed in 2% glutaraldehyde in PB for 1 h. The cells were washed in PBS three times, and post-fixed for 1 h in PB containing 1% OsO4 (TAAB, Berks, UK) and 1.5% potassium ferrocyanide. After being washed in distilled water, cells were dehydrated with a graded series of ethanol and embedded in epoxy resin (TAAB). Ultrathin sections were doubly stained with uranyl acetate and lead citrate, and observed under an H7600 electron microscope (Hitachi, Tokyo, Japan). For quantitative analyses, electron micrographs were taken randomly using a H7600 electron microscope equipped with ORIUSTM SC200W 2k × 2 k TEM CCD camera (Gatan Inc.) at a magnification of ×8,000. The surface areas of autophagosomes and autolysosomes were measured using MacSCOPE 2.5 software (Mitani Corporation, Fukui, Japan). Surface areas of autophagosomes and autolysosomes were normalized to the cytoplasmic area.
Chemical Information
Information regarding structurally similar compounds was obtained from SciFinder.
Quantitative RT-PCR
Total RNA from NIH3T3 cells was prepared using ISOGEN (Nippon Gene, Tokyo, Japan). Quantitative real-time RT-PCR was performed using the QuantiTect SYBR® Green RT-PCR Kit (Qiagen). All data were normalized to the level of β-actin (Actb) expression in the same sample. The following primers were used: p62/SQSTM1, p62/Sqstm1–5′ (5′-GCCAGAGGAACAGATGGAGT-3′), and p62/Sqstm1-3′ (5′-TCCGATTCTGGCATCTGTAG-3′); β-actin, Actb-5′ (5′-TCCCTGGAGAAGAGCTACGA-3′) and Actb-3′ (5′-AGCACTGTGTTGGCGTACAG-3′).
Cloning of SCD1 and Plasmid Transfection
Total RNA from NIH3T3 cells was prepared using ISOGEN. Synthesis of first-strand cDNA was performed using the StrataScript First-Strand Synthesis System (Stratagene, La Jolla, CA). The cDNA encoding mouse SCD1 was then amplified by PCR using primers mSCD1–5 (5′-ATAACCGAATTCATGCC GGCCCACATGCT) and mSCD1–3 (5′-GCTCAACTGCAGTCAGCTACTCTTGTGACTCC). This SCD1 cDNA was subcloned into the EcoRI-PstI sites of pEGFP-C2 (Clontech Laboratories, Inc.), and the resultant plasmid was used for expression of the GFP fusion protein. The construct was verified by DNA sequencing. For transfection, we used the HilyMax system (Dojindo Molecular Technologies, Inc., Gaithersburg, MD). Cells were analyzed 24 h after transfection.
Fatty Acid Analysis
Cells were cultured on 90-mm plastic dishes. After the chemical treatments, the cells were washed three times with DMEM containing 0.1% BSA without supplemental fatty acid, and then PBS was added. The cells were harvested by scraping, and then centrifuged at 500 × g for 5 min. Precipitates were rapidly frozen in liquid nitrogen. Lipids were extracted by the method of Bligh and Dyer (30). Phospholipids were separated by thin-layer chromatography in 25:25:25:10:9 (v/v) chloroform, methyl acetate, 1-propanol, methanol, 0.25% KCl. The plates were sprayed with primulin, and the phospholipids were visualized under ultraviolet light. Spots corresponding to phosphatidylcholine (PC) were scraped off the plates, and the isolated PC was methylated with 1% H2SO4 in methanol. The resulting fatty acid methyl esters were extracted with hexane and subjected to gas chromatography-mass spectrometry (GC-MS) analysis as described in Ariyama et al. (29).
RESULTS
Screening of Inhibitors of Autophagy Using a Structurally Diverse Chemical Library
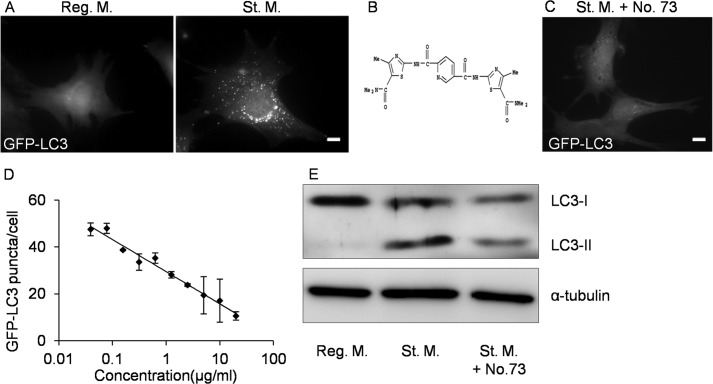
To identify new inhibitors of autophagy, we screened a chemical library consisting of 528 structurally diverse compounds by monitoring the effect of each compound on formation of LC3 puncta in GFP-LC3 MEFs. In regular medium, GFP-LC3 MEFs exhibited diffuse fluorescence throughout the cytoplasm, whereas many fluorescent puncta corresponding to the formation of autophagosomes appeared after cells were transferred to starvation medium for 2 h (Fig. 1A). Inhibition of GFP-LC3 puncta formation was the principal criterion for identification of inhibitors of autophagy.
FIGURE 1.
Screening of a novel inhibitor of autophagy. A, MEFs stably expressing GFP-LC3 (GFP-LC3 MEFs) were cultured for 2 h in regular medium (Reg. M.) or starvation medium (St. M.). B, structure of No. 73. C, GFP-LC3 MEFs were cultured for 2 h in starvation medium with 20 μg/ml of No. 73 (St. M. + No. 73). Cells were observed under a fluorescence microscope. Scale bars, 10 μm. D, dose-dependent inhibition of formation of GFP-LC3 puncta by No. 73. Numbers of GFP-LC3 puncta per cell were counted. Data represent mean ± S.E. of three independent experiments, in each of which more than 30 cells were counted. E, NIH3T3 cells were cultured for 2 h in regular medium, starvation medium, or starvation medium with 20 μg/ml of No. 73. Cell lysates were processed for immunoblot analysis to detect LC3 and α-tubulin (as an endogenous control).
In this screen, we identified several novel inhibitors, No. 73, 2,5-pyridinedicarboxamide; N2, N5-bis[5-[(dimethylamino)carbonyl]-4-methyl-2thiazolyl] (Fig. 1B), which strongly suppressed starvation-induced autophagy in GFP-LC3 MEFs after 2 h at a concentration of 20 μg/ml (Fig. 1C). The concentration of No. 73 that decreased the number of GFP-LC3 puncta by 50% (IC50) was ∼2.5 μg/ml (∼7 μm) in GFP-LC3 MEFs (Fig. 1D). Immunoblot analysis were also used to demonstrate induction of autophagy, in particular by monitoring processing of the cytoplasmic form of LC3 (LC3-I) into the autophagosome-bound form (LC3-II). These two types of LC3 can be distinguished on immunoblots, because the apparent molecular mass of LC3-II is lower than that of LC3-I. When NIH3T3 cells were transferred to starvation medium from regular medium, the content of LC3-II increased, whereas this increase in the LC3-II level was strongly suppressed when cells were transferred into starvation medium containing No. 73 (Fig. 1E).
SCD1 Inhibitor 28c Suppresses Starvation-induced Autophagy
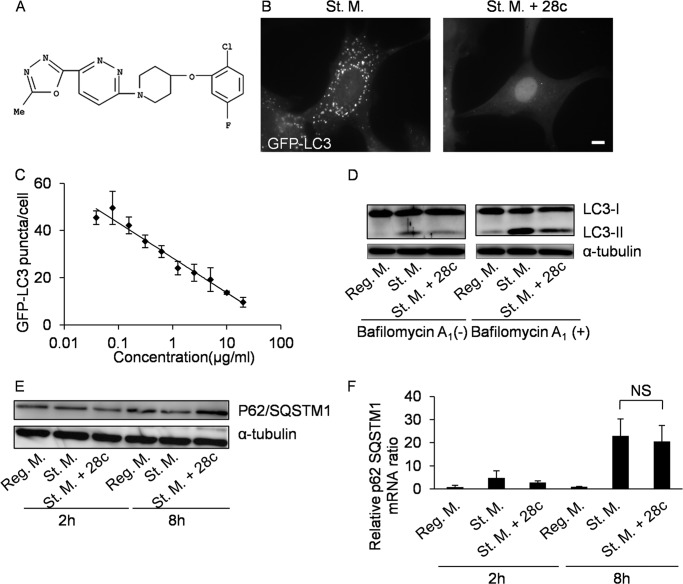
To determine the mechanism by which compound No. 73 inhibits autophagy, we searched for structurally similar compounds using an online chemical database, SciFinder. The results of this search revealed that No. 73 has high structural similarity to a chemical that has been reported to be a SCD1 inhibitor: 4-methyl-2-[4-[(o-tolylamino)methyl]benzoylamino]thiazole-5-carboxylic acid dimethylamide (24). Because this compound is not commercially available, we investigated whether another SCD1 inhibitor, 28c (25) (Fig. 2A), could suppress starvation-induced autophagy. At a concentration of 20 μg/ml, 28c inhibited formation of GFP-LC3 puncta in GFP-LC3 MEFs (Fig. 2B) and LC3 puncta in NIH3T3 and HeLa cells (supplemental Fig. S1, A and B). The IC50 of 28c for inhibition of LC3 puncta formation in GFP-LC3 MEFs was ∼2.0 μg/ml (∼5.1 μm) (Fig. 2C). Similarly, this compound inhibited processing of LC3-I into LC3-II in GFP-LC3 MEFs (Fig. 2D, first to third lanes), NIH3T3, and HeLa cells (supplemental Fig. S1C). The inhibition of autophagy by No. 73 and 28c was reversible, as LC3 puncta appeared in the starvation medium after removal of either compound (supplemental Fig. S2).
FIGURE 2.
The SCD1 inhibitor 28c suppresses starvation-induced autophagy. A, structure of 28c. B, GFP-LC3 MEFs were cultured for 2 h in starvation medium or starvation medium with 20 μg/ml of 28c. Cells were observed under a fluorescence microscope. Scale bars, 10 μm. C, dose-dependent inhibition of autophagy by 28c. Numbers of GFP-LC3 puncta per cell were counted. Data represent mean ± S.E. of three independent experiments, in each of which more than 30 cells were counted. D, GFP-LC3 MEFs were cultured for 2 h in regular medium, starvation medium, or starvation medium with 20 μg/ml of 28c, in the presence or absence of 100 nm bafilomycin A1. Cell lysates were processed for immunoblot analysis to detect LC3 and α-tubulin (as an endogenous control). E and F, GFP-LC3 MEFs were cultured for 2 or 8 h in regular medium, starvation medium, or starvation medium with 20 μg/ml of 28c. Cell lysates were processed for immunoblot analysis to detect p62/SQSTM1 and α-tubulin (as an endogenous control) and for real-time RT-PCR (F). Quantitative PCR of p62/SQSTM1 mRNA and β-actin (Actb: as an internal control). Ratios of the levels of p62/SQSTM1 mRNA to Actb mRNA are shown. Data represent mean ± S.E. of three independent experiments. NS, statistically not significant.
We next examined the effects of bafilomycin A1, to exclude the possibility that 28c accelerates degradation in autolysosomes and recycling of autolysosomes without inhibiting autophagosome formation. Bafilomycin A1 inhibits degradation of content and recycling of autolysosomes (31). If 28c functions by accelerating degradation in autolysosomes and recycling of autolysosomes, bafilomycin A1 would abolish the effects of 28c. As shown in Fig. 2D, increase in the level of LC3-II after starvation was similarly suppressed by 28c treatment either in the presence or absence of bafilomycin A1, suggesting that 28c inhibits formation of autophagosomes.
28c Suppresses Autophagic Degradation of p62/SQSTM1
p62/SQSTM1 binds to LC3, is specifically sequestered in autophagosomes, and is degraded in autolysosomes (32). Therefore, it has been used as a marker in studies of autophagic degradation (33). As shown in Fig. 2E, the level of p62/SQSTM1 decreased during prolonged (8 h) starvation (fifth lane), and this decrease was suppressed by 28c (sixth lane). This result suggests that autophagy and degradation of p62/SQSTM1 was inhibited by 28c treatment. Next, we measured the relative level of p62/SQSTM1 mRNA by quantitative PCR, to rule out the possibility that this observation was the result of up-regulated synthesis of p62/SQSTM1 following 28c treatment. As reported by Sahani et al. (28), the relative level of p62/SQSTM1 mRNA increased after prolonged starvation (Fig. 2F). However, 28c treatment itself did not affect the level of p62/SQSTM1 mRNA (Fig. 2F). We also examined changes in the level of exogenously expressed GFP-p62/SQSTM1, because the rate of synthesis of the GFP-p62/SQSTM1 protein may not change in response to starvation or 28c treatment. Using exogenously expressed GFP-p62/SQSTM1, we obtained results similar to those obtained with endogenous p62/SQSTM1 (supplemental Fig. S3). These results strongly suggest that suppression of reduction in the p62/SQSTM1 level during starvation in the presence of 28c is not caused by up-regulation of p62/SQSTM1 synthesis, and that 28c inhibits starvation-induced autophagy.
Electron Microscopic Analysis of 28c-treated Cells
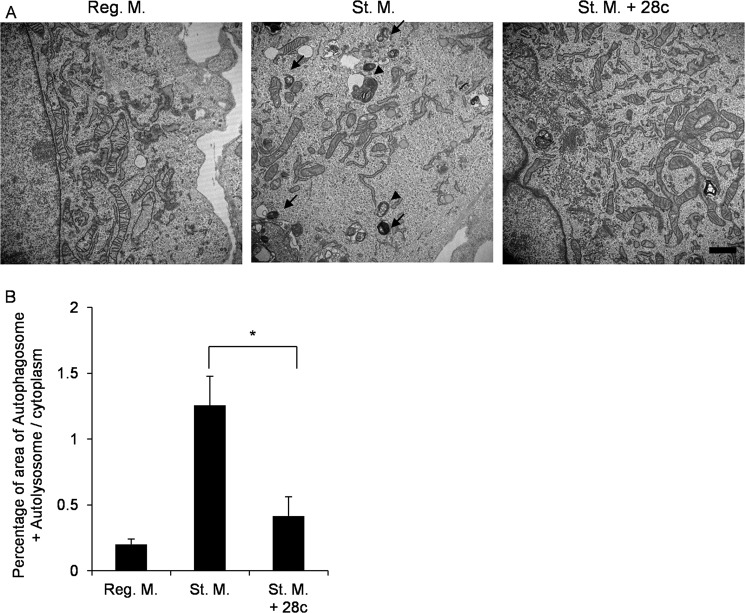
Next, we investigated the ultrastructure of 28c-treated cells. In regular medium, MEFs contained few autophagic structures in MEFs (Fig. 3A, Reg. M.). After nutrient deprivation, however, many autophagic structures appeared, including isolation membranes, autophagosomes, and autolysosomes (Fig. 3A, St. M.). By contrast, in the presence of 20 μg/ml of 28c, few autophagic structures were observed even after starvation (Fig. 3A, St. M. + 28c). Fig. 3B shows quantitative analysis of the area of autophagic structures (autophagosomes and autolysosomes). 28c significantly suppressed formation of autophagic structures (Fig. 3B). Taken together with the results described above, these observations show that 28c inhibits starvation-induced autophagy, and suggest that SCD1 is required for autophagy.
FIGURE 3.
Electron microscopic analysis of 28c-treated MEFs. A, electron micrographs of GFP-LC3 MEFs incubated for 2 h in regular medium, starvation medium, or starvation medium with 20 μg/ml of 28c. Arrowheads indicate autophagosomes, and arrows show autolysosomes. Scale bars, 1 μm. B, quantitation of the area of autophagosomes and autolysosomes. Data represent mean ± S.E. of three independent experiments, in each of which more than 10 cells were counted. *, p < 0.05.
Overexpression of SCD1 or Addition of Oleic Acid Abolishes Inhibition of Autophagy by 28c
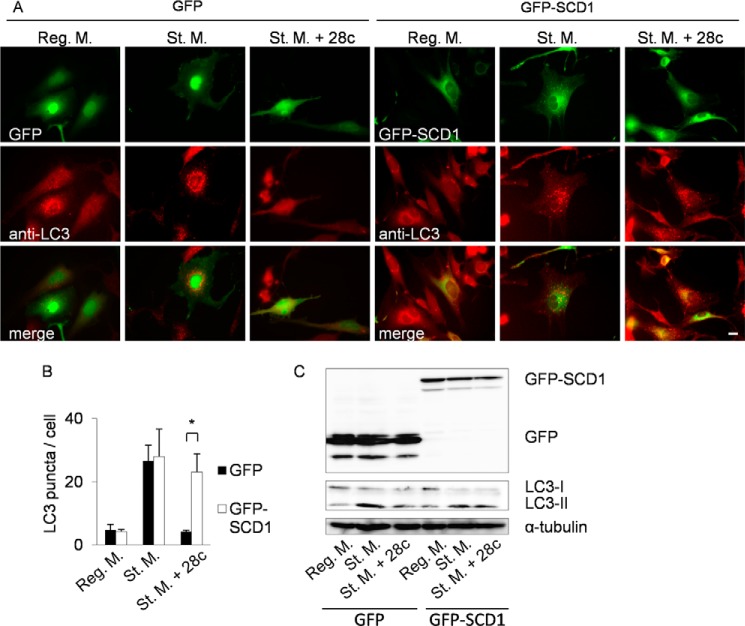
To further investigate the involvement of SCD1 activity in autophagy, we knocked down SCD1 in HeLa cells. However, knockdown of SCD1 did not significantly suppress starvation-induced autophagy in HeLa cells (supplemental Fig. S4), possibly due to incomplete knockdown of SCD1 or redundant functions exerted by other SCD isozymes present in mammalian cells. Therefore, we next investigated whether overexpression of SCD1 abolishes inhibition of starvation-induced autophagy by 28c. To this end, we constructed mammalian expression vectors (pEGFPC2) encoding mouse SCD1 (GFP-SCD1) (supplemental Fig. S5). The GFP-SCD1 fusion protein exhibits stearoyl-CoA desaturase activity similar to that of wild-type SCD1 (34). GFP-SCD1 expressed in NIH3T3 was co-localized with an endogenous ER protein, calnexin. NIH3T3 cells expressing GFP-SCD1 sometimes exhibited a punctate ER pattern in addition to the normal reticular pattern. This ER pattern did not change during starvation, and did not co-localize with LC3 puncta. NIH3T3 cells transiently expressing GFP-SCD1 formed LC3 puncta after starvation, as in the case of the same cells expressing GFP alone (Fig. 4A, St. M.). In starvation medium containing 28c, overexpression of GFP-SCD1, but not GFP alone, restored LC3 puncta formation (Fig. 4A, St. M. + 28c). GFP-SCD1 did not co-localize with LC3 puncta (Fig. 4A, St. M.). Fig. 4B shows the results of a quantitative analysis of LC3 puncta formation. Recovery of autophagy by overexpression of SCD1 was also demonstrated by immunoblot analyses in which processing from LC3-I into LC3-II was detected (Fig. 4C, fifth and sixth lanes).
FIGURE 4.
Overexpression of GFP-SCD1 abolishes the effect of 28c. A, NIH3T3 cells transiently expressing GFP (left panel) or GFP-SCD1 (right panel) were cultured for 2 h in regular medium, starvation medium, or starvation medium with 20 μg/ml of 28c. Cells were processed for immunofluorescence microscopy with mouse monoclonal anti-LC3 antibody and Alexa Fluor 546-conjugated secondary antibody. Upper panels, GFP; middle panels, LC3; lower panels, merge. Scale bars, 10 μm. B, numbers of LC3 puncta per cell were counted. Data represent mean ± S.E. of three independent experiments, in each of which more than 20 cells were counted. *, p < 0.05. C, NIH3T3 cells transiently expressing GFP or GFP-SCD1 were cultured for 2 h in regular medium, starvation medium, or starvation medium with 20 μg/ml of 28c. Cell lysates were processed for immunoblot analysis to detect GFP, LC3, and α-tubulin (as an endogenous control).
LC3 Puncta Formation in the Presence of 28c Is Restored by Oleic Acid Supplementation
SCD1 catalyzes synthesis of monounsaturated fatty acids (MUFA) from saturated fatty acids. The main product of SCD1 is OA, which is synthesized from stearic acid by desaturation. Therefore, we investigated whether exogenous supplementation of oleic acid restores autophagy in the presence of 28c.
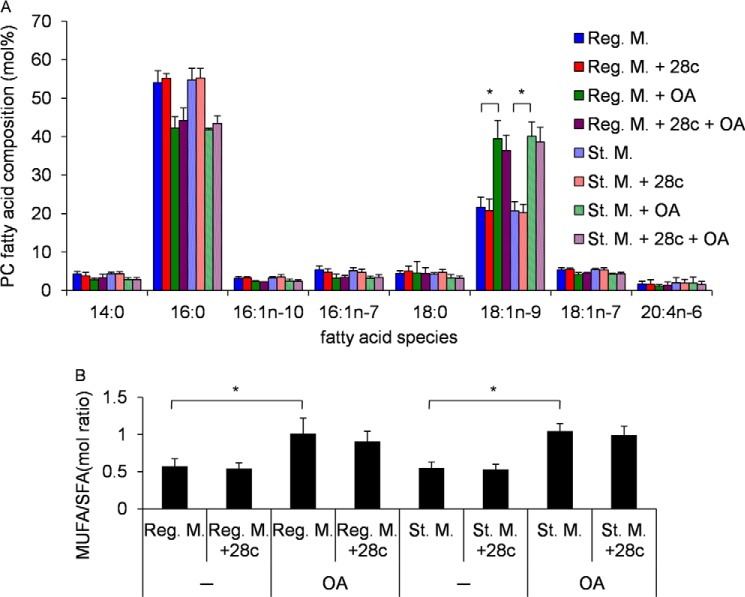
First, we examined the changes in fatty acid composition of phosphatidylcholine resulting from 28c treatment or oleic acid supplementation. 28c treatment decreased oleic acid composition slightly (Fig. 5A, 18:1n-9) both in regular and starvation medium, although these reductions were not significant. These results show that the overall lipid composition of whole cells did not change dramatically following a short (2 h) treatment with 28c. On the other hand, supplementation with oleic acid (Fig. 5A) resulted in a significant increase in oleic acid (18:1n-9) incorporation in phosphatidylcholine. Similar results were obtained for the ratio of MUFA to saturated fatty acid (Fig. 5B).
FIGURE 5.
Changes of fatty acid composition in PC following 28c treatment or addition of oleic acid. GFP-LC3 MEFs were cultured for 2 h in regular or starvation medium, with or without 20 μg/ml of 28c, in the presence or absence of 500 μm OA-BSA conjugate (OA). Fatty acid composition of the harvested cells was analyzed by GC/MS. Data represent mean ± S.E. of three or more independent experiments. A, molar percentages of fatty acid species in PC. B, ratio of molar percentage of MUFA to saturated fatty acid (SFA) in A. *, p < 0.01.
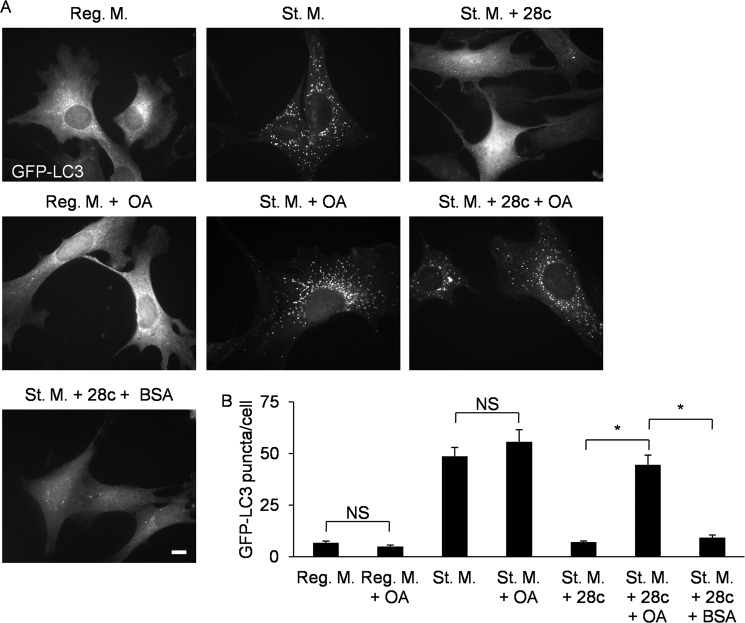
Next, we investigated whether oleic acid supplementation would abolish the effect of 28c. Supplementation of regular or starvation medium with 500 μm OA-BSA conjugate did not change the distribution of LC3 (Fig. 6A, Reg. M. + OA and St. M. + OA). Addition of 500 μm OA-BSA conjugate to starvation medium containing 28c restored LC3 puncta formation (Fig. 6A, St. M. + 28c + OA). On the other hand, vehicle control (1.25% BSA) did not abolish the effect of 28c (Fig. 6A, St. M. + 28c + BSA). Fig. 6C shows quantitative analyses of LC3 puncta formation. Furthermore, addition of 100 μm PA-BSA conjugate to starvation medium containing 28c did not restore LC3 puncta formation (supplemental Fig. S6). Taken together, these results strongly suggest that 28c suppresses starvation-induced autophagy by inhibiting SCD1 activity, but that SCD1 activity is required for autophagy at specific locations, such as autophagosome formation sites.
FIGURE 6.
Supplementation of oleic acid abolishes the effect of 28c. A, GFP-LC3 MEFs were cultured for 2 h in regular or starvation medium, with or without 500 μm OA-BSA conjugate (OA), or in St. M. with 20 μg/ml of 28c in the presence or absence of 500 μm OA-BSA conjugate or 1.25% BSA. Cells were observed under a fluorescence microscope. Scale bars, 10 μm. B, numbers of GFP-LC3 puncta per cell were counted. Data represent mean ± S.E. of three independent experiments, in each of which more than 30 cells were counted. NS, statistically not significant; *, p < 0.01.
28c Suppresses Starvation-induced Autophagy Downstream of mTOR
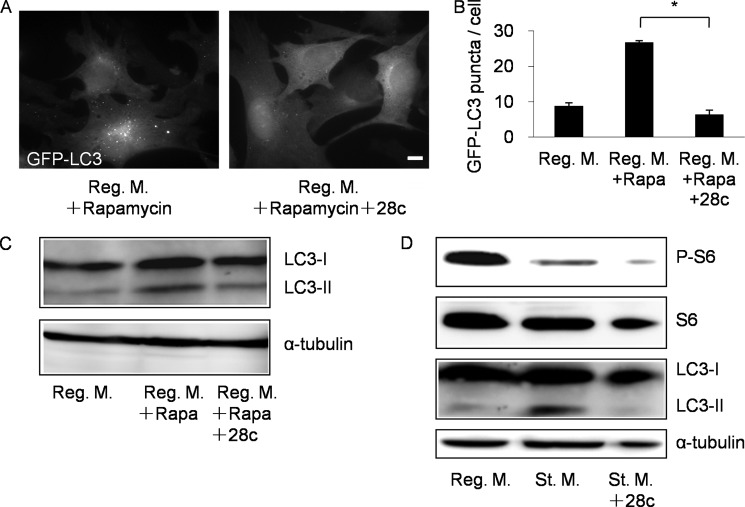
mTOR plays a central role in signal transduction in response to nutrient conditions. Under nutrient-rich conditions, mTOR suppresses autophagy via phosphorylation of ULK1. Following nutrient deprivation, however, mTOR is inactivated and ULK1 is dephosphorylated, resulting in induction of autophagy. Rapamycin, a potent mTOR inhibitor, induces autophagy directly without starvation. To determine whether 28c suppresses the signal transduction pathway leading to mTOR, we investigated whether 28c suppresses rapamycin-induced autophagy. 28c strongly suppressed GFP-LC3 puncta formation (Fig. 7, A and B) and conversion of LC3-I into LC3-II (Fig. 7C) upon rapamycin treatment. These results suggest that 28c suppresses autophagy downstream of mTOR. Next, we investigated whether mTOR activity is activated in 28c-treated cells. To monitor mTOR activity, we examined phosphorylation of ribosomal protein S6, which is a target of the mTOR kinase (35). In regular medium, S6 was phosphorylated by mTOR, whereas S6 phosphorylation decreased after starvation. Although starvation-induced autophagy was suppressed by 28c treatment, S6 remained dephosphorylated (Fig. 7D). This result suggests that 28c does not suppress inactivation of mTOR activity in starvation medium. We also investigated whether AMPK is suppressed by 28c treatment. Depletion of energy causes activation of AMPK by AMPK kinase. Activated AMPK then phosphorylates and activates ULK1, resulting in induction of autophagy (36). To determine whether 28c suppresses this second pathway for induction of autophagy, we examined the effects of 28c on the phosphorylation of AMPK after starvation (supplemental Fig. S7). The results showed that 28c did not suppress AMPK phosphorylation, demonstrating that 28c does not inhibit the activation of AMPK by phosphorylation after starvation. Taken together, these results show that 28c suppresses autophagy downstream of mTOR.
FIGURE 7.
28c suppresses rapamycin-induced autophagy. A, GFP-LC3 MEFs were cultured for 2 h in regular medium with 1 μm rapamycin or 1 μm rapamycin and 20 μg/ml of 28c. Cells were observed under a fluorescence microscope. Scale bars, 10 μm. B, number of GFP-LC3 puncta per cell were counted. Data represent mean ± S.E. of three independent experiments, in each of which more than 100 cells were counted. *, p < 0.01. C, NIH3T3 cells were cultured for 2 h in regular medium with no drug, with 1 μm rapamycin, or with 1 μm rapamycin and 20 μg/ml of 28c. Cell lysates were processed for immunoblot analysis to detect LC3 and α-tubulin (as an endogenous control). D, NIH3T3 cells were cultured for 2 h in regular medium, starvation medium, or starvation medium with 20 μg/ml of 28c. Cell lysates were processed for immunoblot analysis to detect phospho-S6 (P-S6), S6, LC3, and α-tubulin (as an endogenous control). Rapa, rapamycin.
28c Suppresses Autophagy at the Earliest Step of Autophagosome Formation
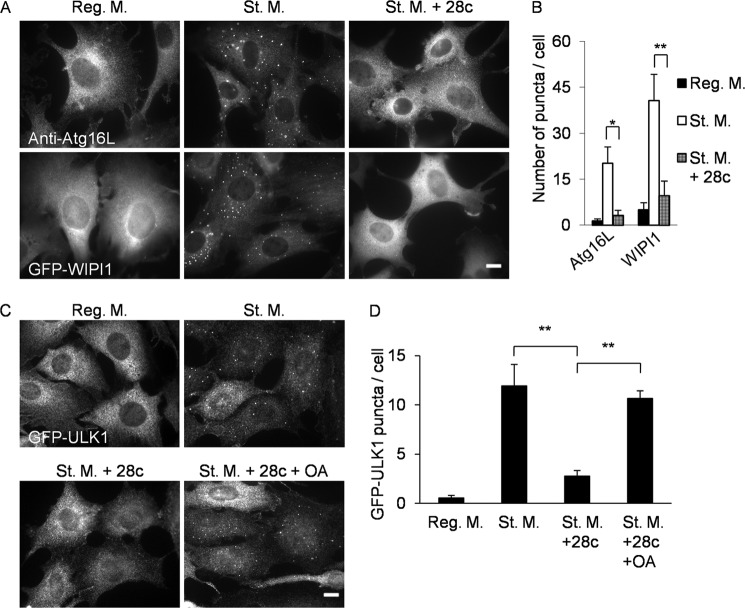
During autophagosome formation, ULK1, WIPI1, Atg16L, and LC3 target sites of autophagosome formation on the ER and form puncta in a hierarchical manner in the listed order (20). To determine which step is inhibited by 28c, we investigated the effects of 28c on the localization of ULK1, WIPI1, and Atg16L under starvation conditions. MEFs stably expressing GFP-ULK1 or GFP-WIPI1 formed fluorescent puncta after starvation (Fig. 8, A and C, St. M.). Formation of endogenous Atg16L puncta was detected by immunofluorescence microscopy (Fig. 8A, St. M.). Formation of puncta containing ULK1, WIPI1, and Atg16L were inhibited by addition of 28c to the starvation medium (Fig. 8, A and C, St. M + 28c). Fig. 8, B and D, show the results of quantitative analyses of formation of ULK1, WIPI1, and Atg16L puncta. Formation of all types of puncta was suppressed by 28c treatment, suggesting that 28c inhibits the earliest step of autophagosome formation, namely, translocation of ULK1 to sites of autophagosome formation on the ER.
FIGURE 8.
28c suppresses starvation-induced autophagy in the early stage of autophagosome formation. A, MEFs stably expressing GFP-LC3 (upper panels) and GFP-WIPI1 (lower panels) were cultured for 2 h in regular medium, starvation medium, or starvation medium with 20 μg/ml of 28c. Cells were fixed and observed under a fluorescence microscope either directly (lower panels) or after immunostaining with anti-Atg16L antibody (upper panels). Scale bars, 10 μm. B, numbers of Atg16L and WIPI1 puncta per cell were counted. Data represent mean ± S.E. of three independent experiments, in each of which more than 100 cells were counted. C, MEFs stably expressing GFP-ULK1 were cultured for 2 h in regular medium, starvation medium, or starvation medium with 20 μg/ml of 28c in the presence or absence of 500 μm OA-BSA conjugate. Cells were fixed and observed under a fluorescence microscope after immunostaining with anti-GFP antibody. Scale bars, 10 μm. D, numbers of GFP-ULK1 puncta per cell were counted. Data represent mean ± S.E. of three independent experiments, in each of which more than 100 cells were counted. *, p < 0.05; **, p < 0.01.
OA Supplementation Restores ULK1 Puncta Formation in the Presence of 28c
We next examined whether OA supplementation restores puncta formation of ULK1 in 28c-treated cells. As shown Fig. 8C, supplementation of media with OA-BSA conjugate restored starvation-induced formation of ULK1 puncta even in the presence of 28c. Fig. 8D shows the results of quantitative analyses of formation of GFP-ULK1 puncta. These observations suggest that unsaturated fatty acids produced by SCD1 are required for translocation of ULK1 to sites of autophagosome formation.
28c Inhibits Translocation of p62/SQSTM, but Not Atg9
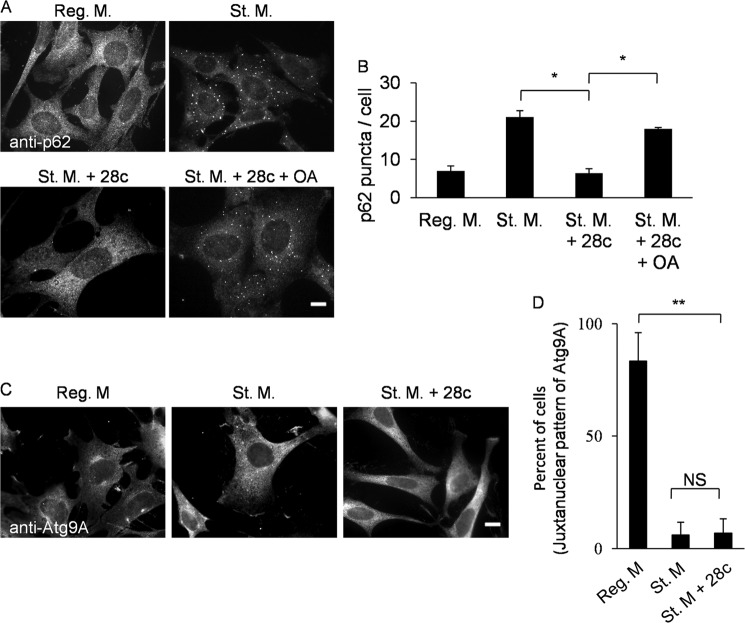
Next, we investigated the effects of 28c on the localization of p62/SQSTM1 and Atg9, both of which act early in autophagosome formation. p62/SQSTM1 is the best characterized specific substrate of mammalian autophagy (28). Recent work has shown that p62/SQSTM1 translocates to sites of autophagosome formation after starvation, regardless of the presence or absence of ULK1 complex (37). Under nutrient-rich conditions, p62/SQSTM1 scarcely formed puncta, whereas following starvation, it formed many puncta (Fig. 9A). In the presence of 28c, p62/SQSTM1 did not form puncta after starvation, but addition of 500 μm OA-BSA conjugate to starvation medium containing 28c restored p62/SQSTM1 puncta formation (Fig. 9A). Fig. 9B shows the results of quantitative analyses of formation of p62/SQSTM1 puncta.
FIGURE 9.
28c inhibits formation of p62/SQSTM1 puncta, but does not affect the change in Atg9 localization from a juxtanuclear to a peripheral pattern. A, GFP-LC3 MEFs were cultured for 2 h in regular medium, starvation medium, or starvation medium with 20 μg/ml of 28c in the presence or absence 500 μm OA-BSA conjugate. Cells were processed for immunofluorescence microscopy with anti-p62/SQSTM1 antibody. Scale bars, 10 μm. B, numbers of p62/SQSTM1 puncta per cell were counted. Data represent mean ± S.E. of three independent experiments, in each of which more than 50 cells were counted. C, GFP-LC3 MEFs were cultured for 2 h in regular medium, starvation medium, or starvation medium with 20 μg/ml of 28c. Cells were processed for immunofluorescence microscopy to detect Atg9A. Scale bars, 10 μm. D, percent of cells exhibiting a juxtanuclear pattern of Atg9A. Data represent mean ± S.E. of three independent experiments, in each of which more than 30 cells were counted. NS, statistically not significant; *, p < 0.05; **, p < 0.01.
Atg9 is the only known transmembrane protein among the autophagy-related proteins, and it localizes both in the trans-Golgi network (juxtanuclear region) and in the peripheral region, including late endosomes (38). A recent study showed that Atg9 translocates to the peripheral region from the juxtanuclear region, and transiently interacts with omegasomes under starvation conditions (39). 28c did not suppress the shift of Atg9 in localization from the juxtanuclear region to the periphery after starvation (Fig. 9, C and D).
DISCUSSION
In this study, we screened a chemical library for inhibitors of autophagy. One of the effective inhibitors that we identified has a structure similar to that of a chemical previously described as an SCD1 inhibitor. Another SCD1 inhibitor, 28c, also inhibited starvation-induced autophagy, suggesting that SCD1 activity is necessary for autophagy.
SCD1 is an integral membrane protein of the ER, and a key enzyme for the biosynthesis of MUFA from saturated fatty acid. The principal product of SCD1 is oleic acid, which is formed by desaturation of stearic acid. Products of SCD1 serve as substrates for the synthesis of various kinds of lipids, including phospholipids, triglycerides, cholesteryl esters, wax esters, and alkyldiacylglycerols.
The genes encoding SCD have been cloned from various species, including yeast, Drosophila, Caenorhabditis elegans, sheep, hamster, rat, mouse, and human. In mouse, four isoforms (SCD-1, SCD-2, SCD-3, and SCD-4) have been identified, whereas in human there are two (SCD1 and SCD5) (40). It remains unclear whether there are functional differences between these isozymes.
As noted above, autophagy is suppressed by knock-out of a Drosophila SCD homolog, Desat1 (26). Our findings reported here constitute the first demonstration that SCD is required for autophagy in mammals. Unfortunately, we were unable to clearly show that knockdown of SCD1 suppresses autophagy in HeLa cells, possibly because other SCD isozymes exert redundant functions in mammalian cells. In fact, Scd4 mRNA is up-regulated to compensate for SCD1 deficiency in the hearts of Scd1 KO mice (41).
Inhibition of starvation-induced autophagy by 28c was abolished by either addition of oleic acid or overexpression of SCD1. This result strongly suggests that inhibition of starvation-induced autophagy by 28c is caused by inhibition of SCD1 activity, and is not a side effect of the drug. In HepG2 cells, the IC50 of 28c for in vivo SCD1 activity is 7–8 nm, and 28c almost completely inhibits SCD1 activity at a concentration of 1 μm (25). In this study, the IC50 of 28c for starvation-induced autophagy was ∼5.1 μm, much higher than the concentration required to inhibit SCD1 activity. This difference between the IC50 for SCD1 activity and the IC50 for inhibition of autophagy might be explained by the presence of SCD isozymes that are more resistant than SCD1 to 28c and that also participate in autophagy. It is also possible that residual SCD1 activity in the presence of nanomolar concentrations of 28c is sufficient for autophagy.
28c suppresses starvation-induced autophagy without affecting inactivation of mTOR after nutrient deprivation, and also suppresses rapamycin-induced autophagy, suggesting a requirement for SCD1 activity downstream of mTOR. Following starvation, 28c inhibited formation of puncta containing p62/SQSTM1, ULK1, WIPI1, and Atg16L, as well as LC3. Formation of ULK1 and p62/SQSTM1 puncta is the earliest step of autophagosome formation, corresponding to the targeting of these proteins to the ER followed by construction of omegasomes (sites of autophagosome formation) on the ER. Supplementation with oleic acid restored ULK1 and p62/SQSTM1 puncta formation, suggesting that a MUFA such as oleic acid may be indispensable for the earliest step of autophagosome formation. Given that cytochemistry has suggested that the content of unsaturated fatty acids in the isolation membrane is high (5), it is very important to determine whether MUFA produced by SCD1 is used for autophagosome formation. The idea that SCD1 activity and MUFA are required for autophagy, as suggested in this study, is consistent with a recent report by Mei et al. (42) showing that exogenously added oleic acid induced autophagy, whereas exogenously added palmitic acid suppressed autophagy, in HepG2 cells. However, the effects of exogenously added fatty acids on autophagy have been inconsistent across studies (43, 44). Tan et al. (45) reported that inhibition of SCD1 activity resulted in an increase of autophagic flux in Tsc2−/− but not wild-type MEF cells. This result is apparently inconsistent with our findings in this study. This discrepancy may be due to differences in the cells and experimental conditions used in the two studies. Tan et al. (45) examined changes in constitutive (but not starvation-induced) autophagy by long term (24 h) inhibition of SCD1 activity. They suggested that constitutive autophagy was up-regulated by an increase in ATG gene expression, mediated by FOXO1. On the other hand, we examined the effects of the SCD1 inhibitor 28c on starvation-induced autophagy for a short period (2 h). Short term treatment with 28c did not significantly change the overall lipid composition of whole cells, suggesting that such brief treatment does not cause changes in gene expression. Furthermore, our findings suggest that oleic acid produced by SCD1 may be required for starvation-induced autophagy at specific locations such as autophagosome formation sites.
Furthermore, the polyunsaturated fatty acid docosahexaenoic acid induces autophagy. Jing et al. (46) reported that docosahexaenoic acid induces autophagy by suppressing p53 following activation of AMPK and inactivation of mTOR. What processes at the earliest step of autophagosome formation require SCD1 activity and a MUFA product such as oleic acid? We propose two distinct possibilities: 1) SCD1 can increase membrane fluidity by increasing the MUFA composition of membrane phospholipids on the ER. High membrane fluidity may be necessary to expand the isolation membranes from sites of autophagosome formation on the ER. 2) Unsaturated fatty acids such as oleic acid are truncated cone-shaped fatty acids that can generate membrane curvature. Chan et al. (47) reported that ULK1 recognizes and translocates to the autophagosome formation site via the C-terminal domain of ULK1. Additionally, Ragusa et al. (48) reported that the C-terminal EAT domain of Atg1 (the yeast homolog of ULK1) senses membrane curvature. Similar dependence on high membrane curvature has been reported for Atg3 activity (49). Further studies will be needed to test both of these models.
This work was supported by a Sasakawa Scientific Research Grant from the Japan Science Society.

This article contains supplemental Figs. S1–S7.
Y. Ogasawara, E. Itakura, N. Kono, N. Mizushima, H. Arai, A. Nara, T. Mizukami, and A. Yamamoto, unpublished data.
- PtdIns
- phosphatidylinositol
- 28c
- 3-[4-(2-chloro-5-fluorophenoxy)-1-piperidinyl]-6-(5-methyl-1,3,4-oxadiazol-2-yl)-pyridazine
- AMPK
- AMP-activated protein kinase
- Atg16L
- autophagy related 16–like protein
- FIP200
- FAK family kinase-interacting protein of 200 kDa
- GFP
- green fluorescent protein
- LC3
- microtubule-associated proteins 1A/1B light chain 3
- mTOR
- mammalian target of rapamycin
- OA
- oleic acid
- OA-BSA
- oleic acid-BSA conjugate
- PA
- palmitic acid
- PA-BSA
- palmitic acid-BSA conjugate
- p62/SQSTM1
- ubiquitin-binding protein p62/sequestosome-1
- ULK1
- Unc-51-like kinase 1
- Vps34
- vacuolar protein sorting-associated protein 34
- WIPI1
- WD-repeat domain phosphoinositide-interacting protein 1
- PC
- phosphatidylcholine
- MEF
- mouse embryonic fibroblast
- ER
- endoplasmic reticulum
- SCD
- stearoyl-CoA desaturase
- MUFA
- monounsaturated fatty acid.
REFERENCES
- 1. Mizushima N., Levine B., Cuervo A. M., Klionsky D. J. (2008) Autophagy fights disease through cellular self-digestion. Nature 451, 1069–1075 [DOI] [PMC free article] [PubMed] [Google Scholar]
- 2. Hirsimäki Y., Hirsimäki P., Lounatmaa K. (1982) Vinblastine-induced autophagic vacuoles in mouse liver and Ehrlich ascites tumor cells as assessed by freeze-fracture electron microscopy. Eur. J. Cell Biol. 27, 298–301 [PubMed] [Google Scholar]
- 3. Fengsrud M., Erichsen E. S., Berg T. O., Raiborg C., Seglen P. O. (2000) Ultrastructural characterization of the delimiting membranes of isolated autophagosomes and amphisomes by freeze-fracture electron microscopy. Eur. J. Cell Biol. 79, 871–882 [DOI] [PubMed] [Google Scholar]
- 4. Réz G., Meldolesi J. (1980) Freeze-fracture of drug-induced autophagocytosis in the mouse exocrine pancreas. Lab. Invest. 43, 269–277 [PubMed] [Google Scholar]
- 5. Reunanen H., Punnonen E. L., Hirsimäki P. (1985) Studies on vinblastine-induced autophagocytosis in mouse liver: V. a cytochemical study on the origin of membranes. Histochemistry 83, 513–517 [DOI] [PubMed] [Google Scholar]
- 6. Juhasz G., Neufeld T. P. (2006) Autophagy: a forty-year search for a missing membrane source. PLoS Biol. 4, e36. [DOI] [PMC free article] [PubMed] [Google Scholar]
- 7. Axe E. L., Walker S. A., Manifava M., Chandra P., Roderick H. L., Habermann A., Griffiths G., Ktistakis N. T. (2008) Autophagosome formation from membrane compartments enriched in phosphatidylinositol 3-phosphate and dynamically connected to the endoplasmic reticulum. J. Cell Biol. 182, 685–701 [DOI] [PMC free article] [PubMed] [Google Scholar]
- 8. Hayashi-Nishino M., Fujita N., Noda T., Yamaguchi A., Yoshimori T., Yamamoto A. (2009) A subdomain of the endoplasmic reticulum forms a cradle for autophagosome formation. Nat. Cell. Biol. 11, 1433–1437 [DOI] [PubMed] [Google Scholar]
- 9. Hamasaki M., Furuta N., Matsuda A., Nezu A., Yamamoto A., Fujita N., Oomori H., Noda T., Haraguchi T., Hiraoka Y., Amano A., Yoshimori T. (2013) Autophagosomes form at ER-mitochondria contact sites. Nature 495, 389–393 [DOI] [PubMed] [Google Scholar]
- 10. Ohsumi Y. (1999) Molecular mechanism of autophagy in yeast, Saccharomyces cerevisiae. Philos. Trans. R. Soc. Lond. B Biol. Sci. 354, 1577–1580; discussion 1580–1 [DOI] [PMC free article] [PubMed] [Google Scholar]
- 11. Hara T., Takamura A., Kishi C., Iemura S., Natsume T., Guan J. L., Mizushima N. (2008) FIP200, a ULK-interacting protein, is required for autophagosome formation in mammalian cells. J. Cell Biol. 181, 497–510 [DOI] [PMC free article] [PubMed] [Google Scholar]
- 12. Mercer C. A., Kaliappan A., Dennis P. B. (2009) A novel, human Atg13 binding protein, Atg101, interacts with ULK1 and is essential for macroautophagy. Autophagy 5, 649–662 [DOI] [PubMed] [Google Scholar]
- 13. Hosokawa N., Hara T., Kaizuka T., Kishi C., Takamura A., Miura Y., Iemura S., Natsume T., Takehana K., Yamada N., Guan J. L., Oshiro N., Mizushima N. (2009) Nutrient-dependent mTORC1 association with the ULK1-Atg13-FIP200 complex required for autophagy. Mol. Biol. Cell 20, 1981–1991 [DOI] [PMC free article] [PubMed] [Google Scholar]
- 14. Kim J., Kundu M., Viollet B., Guan K. L. (2011) AMPK and mTor regulate autophagy through direct phosphorylation of Ulk1. Nat. Cell. Biol. 13, 132–141 [DOI] [PMC free article] [PubMed] [Google Scholar]
- 15. Russell R. C., Tian Y., Yuan H., Park H.W., Chang Y.Y., Kim J., Kim H., Neufeld T. P., Dillin A., Guan K. L. (2013) ULK1 induces autophagy by phosphorylating Beclin-1 and activating VPS34 lipid kinase. Nat. Cell Biol. 15, 741–750 [DOI] [PMC free article] [PubMed] [Google Scholar]
- 16. Matsunaga K., Morita E., Saitoh T., Akira S., Ktistakis N. T., Izumi T., Noda T., Yoshimori T. (2010) Autophagy requires endoplasmic reticulum targeting of the PI3-kinase complex via Atg14L. J. Cell Biol. 190, 511–521 [DOI] [PMC free article] [PubMed] [Google Scholar]
- 17. Proikas-Cezanne T., Waddell S., Gaugel A., Frickey T., Lupas A., Nordheim A. (2004) WIPI-1α (WIPI49), a member of the novel 7-bladed WIPI protein family, is aberrantly expressed in human cancer and is linked to starvation-induced autophagy. Oncogene 23, 9314–9325 [DOI] [PubMed] [Google Scholar]
- 18. Fujita N., Itoh T., Omori H., Fukuda M., Noda T., Yoshimori T. (2008) The Atg16L complex specifies the site of LC3 lipidation for membrane biogenesis in autophagy. Mol. Biol. Cell 19, 2092–2100 [DOI] [PMC free article] [PubMed] [Google Scholar]
- 19. Kabeya Y., Mizushima N., Ueno T., Yamamoto A., Kirisako T., Noda T., Kominami E., Ohsumi Y., Yoshimori T. (2000) LC3, a mammalian homologue of yeast Apg8p, is localized in autophagosome membranes after processing. EMBO J. 19, 5720–5728 [DOI] [PMC free article] [PubMed] [Google Scholar]
- 20. Itakura E., Mizushima N. (2010) Characterization of autophagosome formation site by a hierarchical analysis of mammalian Atg proteins. Autophagy 6, 764–776 [DOI] [PMC free article] [PubMed] [Google Scholar]
- 21. Seglen P. O., Gordon P. B. (1982) 3-Methyladenine: specific inhibitor of autophagic/lysosomal protein degradation in isolated rat hepatocytes. Proc. Natl. Acad. Sci. U.S.A. 79, 1889–1892 [DOI] [PMC free article] [PubMed] [Google Scholar]
- 22. Noda T., Ohsumi Y. (1998) Tor, a phosphatidylinositol kinase homologue, controls autophagy in yeast. J. Biol. Chem. 273, 3963–3966 [DOI] [PubMed] [Google Scholar]
- 23. Miller S., Tavshanjian B., Oleksy A., Perisic O., Houseman B. T., Shokat K. M., Williams R. L. (2010) Shaping development of autophagy inhibitors with the structure of the lipid kinase Vps34. Science 327, 1638–1642 [DOI] [PMC free article] [PubMed] [Google Scholar]
- 24. Iida T., Mitani I., Nakagawa Y., Tanaka M. (October 16, 2008) Patent WO2008/123469
- 25. Liu G., Lynch J. K., Freeman J., Liu B., Xin Z., Zhao H., Serby M. D., Kym P. R., Suhar T. S., Smith H. T., Cao N., Yang R., Janis R. S., Krauser J. A., Cepa S. P., Beno D. W., Sham H. L., Collins C. A., Surowy T. K., Camp H. S. (2007) Discovery of potent, selective, orally bioavailable stearoyl-CoA desaturase 1 inhibitors. J. Med. Chem. 50, 3086–3100 [DOI] [PubMed] [Google Scholar]
- 26. Köhler K., Brunner E., Guan X. L., Boucke K., Greber U. F., Mohanty S., Barth J. M., Wenk M. R., Hafen E. (2009) A combined proteomic and genetic analysis identifies a role for the lipid desaturase Desat1 in starvation-induced autophagy in Drosophila. Autophagy 5, 980–990 [DOI] [PubMed] [Google Scholar]
- 27. Hannah V. C., Ou J., Luong A., Goldstein J. L., Brown M. S. (2001) Unsaturated fatty acids down-regulate srebp isoforms 1a and 1c by two mechanisms in HEK-293 cells. J. Biol. Chem. 276, 4365–4372 [DOI] [PubMed] [Google Scholar]
- 28. Sahani M.H., Itakura E., Mizushima N. (2014) Expression of the autophagy substrate SQSTM1/p62 is restored during prolonged starvation depending on transcriptional upregulation and autophagy-derived amino acids. Autophagy 10, 431–441 [DOI] [PMC free article] [PubMed] [Google Scholar]
- 29. Ariyama H., Kono N., Matsuda S., Inoue T., Arai H. (2010) Decrease in membrane phospholipid unsaturation induces unfolded protein response. J. Biol. Chem. 285, 22027–22035 [DOI] [PMC free article] [PubMed] [Google Scholar]
- 30. Bligh E. G., Dyer W. J. (1959) A rapid method of total lipid extraction and purification. Can. J. Biochem. Physiol. 37, 911–917 [DOI] [PubMed] [Google Scholar]
- 31. Barth S., Glick D., Macleod K. F. (2010) Autophagy: assays and artifacts. J. Pathol. 221, 117–124 [DOI] [PMC free article] [PubMed] [Google Scholar]
- 32. Bjørkøy G., Lamark T., Brech A., Outzen H., Perander M., Overvatn A., Stenmark H., Johansen T. (2005) p62/SQSTM1 forms protein aggregates degraded by autophagy and has a protective effect on huntingtin-induced cell death. J. Cell Biol. 171, 603–614 [DOI] [PMC free article] [PubMed] [Google Scholar]
- 33. Bjørkøy G., Lamark T., Pankiv S., Øvervatn A., Brech A., Johansen T. (2009) Monitoring autophagic degradation of p62/SQSTM1. Methods Enzymol. 452, 181–197 [DOI] [PubMed] [Google Scholar]
- 34. Wang J., Yu L., Schmidt R. E., Su C., Huang X., Gould K., Cao G. (2005) Characterization of HSCD5, a novel human stearoyl-CoA desaturase unique to primates. Biochem. Biophys. Res. Commun. 332, 735–742 [DOI] [PubMed] [Google Scholar]
- 35. Martin D. E., Hall M. N. (2005) The expanding TOR signaling network. Curr. Opin. Cell Biol. 17, 158–166 [DOI] [PubMed] [Google Scholar]
- 36. Egan D. F., Shackelford D. B., Mihaylova M. M., Gelino S., Kohnz R. A., Mair W., Vasquez D. S., Joshi A., Gwinn D. M., Taylor R., Asara J. M., Fitzpatrick J., Dillin A., Viollet B., Kundu M., Hansen M., Shaw R. J. (2011) Phosphorylation of ULK1 (hATG1) by AMP-activated protein kinase connects energy sensing to mitophagy. Science 331, 456–461 [DOI] [PMC free article] [PubMed] [Google Scholar]
- 37. Itakura E., Mizushima N. (2011) p62 Targeting to the autophagosome formation site requires self-oligomerization but not LC3 binding. J. Cell Biol. 192, 17–27 [DOI] [PMC free article] [PubMed] [Google Scholar]
- 38. Young A. R., Chan E. Y., Hu X. W., Köchl R., Crawshaw S. G., High S., Hailey D. W., Lippincott-Schwartz J., Tooze S. A. (2006) Starvation and ULK1-dependent cycling of mammalian Atg9 between the TGN and endosomes. J. Cell Sci. 119, 3888–3900 [DOI] [PubMed] [Google Scholar]
- 39. Orsi A., Razi M., Dooley H. C., Robinson D., Weston A. E., Collinson L. M., Tooze S. A. (2012) Dynamic and transient interactions of Atg9 with autophagosomes, but not membrane integration, are required for autophagy. Mol. Biol. Cell 23, 1860–1873 [DOI] [PMC free article] [PubMed] [Google Scholar]
- 40. Paton C. M., Ntambi J. M. (2009) Biochemical and physiological function of stearoyl-CoA desaturase. Am. J. Physiol. Endocrinol. Metab. 297, E28–37 [DOI] [PMC free article] [PubMed] [Google Scholar]
- 41. Miyazaki M., Jacobson M. J., Man W. C., Cohen P., Asilmaz E., Friedman J. M., Ntambi J. M. (2003) Identification and characterization of murine SCD4, a novel heart-specific stearoyl-CoA desaturase isoform regulated by leptin and dietary factors. J. Biol. Chem. 278, 33904–33911 [DOI] [PubMed] [Google Scholar]
- 42. Mei S., Ni H. M., Manley S., Bockus A., Kassel K. M., Luyendyk J. P., Copple B. L., Ding W. X. (2011) Differential roles of unsaturated and saturated fatty acids on autophagy and apoptosis in hepatocytes. J. Pharmacol. Exp. Ther. 339, 487–498 [DOI] [PMC free article] [PubMed] [Google Scholar]
- 43. Tan S. H., Shui G., Zhou J., Li J. J., Bay B. H., Wenk M. R., Shen H. M. (2012) Induction of autophagy by palmitic acid via protein kinase C-mediated signaling pathway independent of mTOR (mammalian target of rapamycin). J. Biol. Chem. 287, 14364–14376 [DOI] [PMC free article] [PubMed] [Google Scholar]
- 44. Wen H., Gris D., Lei Y., Jha S., Zhang L., Huang M. T., Brickey W. J., Ting J. P. (2011) Fatty acid-induced NLRP3-ASC inflammasome activation interferes with insulin signaling. Nat. Immunol. 12, 408–415 [DOI] [PMC free article] [PubMed] [Google Scholar]
- 45. Tan S. H., Shui G., Zhou J., Shi Y., Huang J., Xia D., Wenk M. R., Shen H. M. (2014) Critical role of SCD1 in autophagy regulation via lipogenesis and lipid rafts-coupled AKT-FOXO1 signaling pathway. Autophagy 10, 226–242 [DOI] [PMC free article] [PubMed] [Google Scholar]
- 46. Jing K., Song K. S., Shin S., Kim N., Jeong S., Oh H. R., Park J. H., Seo K. S., Heo J. Y., Han J., Park J. I., Han C., Wu T., Kweon G. R., Park S. K., Yoon W. H., Hwang B. D., Lim K. (2011) Docosahexaenoic acid induces autophagy through p53/AMPK/mTOR signaling and promotes apoptosis in human cancer cells harboring wild-type p53. Autophagy 7, 1348–1358 [DOI] [PMC free article] [PubMed] [Google Scholar]
- 47. Chan E. Y., Longatti A., McKnight N. C., Tooze S. A. (2009) Kinase-inactivated ULK proteins inhibit autophagy via their conserved C-terminal domains using an Atg13-independent mechanism. Mol. Cell Biol. 29, 157–171 [DOI] [PMC free article] [PubMed] [Google Scholar]
- 48. Ragusa M. J., Stanley R. E., Hurley J. H. (2012) Architecture of the Atg17 complex as a scaffold for autophagosome biogenesis. Cell 151, 1501–1512 [DOI] [PMC free article] [PubMed] [Google Scholar]
- 49. Nath S., Dancourt J., Shteyn V., Puente G., Fong W. M., Nag S., Bewersdorf J., Yamamoto A., Antonny B., Melia T. J. (2014) Lipidation of the LC3/GABARAP family of autophagy proteins relies on a membrane-curvature-sensing domain in Atg3. Nat. Cell. Biol. 16, 415–424 [DOI] [PMC free article] [PubMed] [Google Scholar]


