Abstract
Background and Aims
Cotton (Gossypium hirsutum) has indeterminate growth. The growth regulator mepiquat chloride (MC) is used worldwide to restrict vegetative growth and promote boll formation and yield. The effects of MC are modulated by complex interactions with growing conditions (nutrients, weather) and plant population density, and as a result the effects on plant form are not fully understood and are difficult to predict. The use of MC is thus hard to optimize.
Methods
To explore crop responses to plant density and MC, a functional–structural plant model (FSPM) for cotton (named CottonXL) was designed. The model was calibrated using 1 year's field data, and validated by using two additional years of detailed experimental data on the effects of MC and plant density in stands of pure cotton and in intercrops of cotton with wheat. CottonXL simulates development of leaf and fruits (square, flower and boll), plant height and branching. Crop development is driven by thermal time, population density, MC application, and topping of the main stem and branches.
Key Results
Validation of the model showed good correspondence between simulated and observed values for leaf area index with an overall root-mean-square error of 0·50 m2 m−2, and with an overall prediction error of less than 10 % for number of bolls, plant height, number of fruit branches and number of phytomers. Canopy structure became more compact with the decrease of leaf area index and internode length due to the application of MC. Moreover, MC did not have a substantial effect on boll density but increased lint yield at higher densities.
Conclusions
The model satisfactorily represents the effects of agronomic measures on cotton plant structure. It can be used to identify optimal agronomic management of cotton to achieve optimal plant structure for maximum yield under varying environmental conditions.
Keywords: Cotton, Gossypium hirsutum, canopy development, growth regulator, intercropping, mepiquat chloride, MC, morphology, shoot topping, simulation model
INTRODUCTION
In contrast to many other crops, cotton (Gossypium hirsutum) growth must be regulated and eventually terminated by chemical means, due to the plants' indeterminate growth habit. The crop growth regulator mepiquat chloride (MC) is commonly used in cotton production in China and elsewhere to maximize cotton yield and fibre quality (Oosterhuis and Egilla, 1996; Ren et al., 2013). MC application increases leaf thickness (Reddy et al., 1996), reduces leaf area (Reddy et al., 1996), shortens internodes (Fernandez et al., 1991) and decreases plant height (Mondino et al., 2004), and thus results in a more compact plant architecture (Reddy et al., 1990). Modification of cotton structure affects light penetration into the canopy and increases light interception in the middle part of the canopy (Gwathmey et al., 1995). In addition, light use efficiency (LUE) of cotton is increased by MC application (Gonias et al., 2012). Furthermore, cotton canopy structure is affected by population density (Gwathmey and Clement, 2010) and practices such as wheat–cotton intercropping (Zhang et al., 2008a), all of which influence crop light interception and fruit formation and thereby biomass growth and yield. High population densities increase leaf area index (LAI) but reduce individual leaf area (Gwathmey and Clement, 2010). Like most species, cotton plant height increases with population density (Siebert and Stewart, 2006). As we observed in field experiments, cotton plant structure was obviously affected by MC and plant density. Due to the complexity and plasticity of cotton plant architecture in relation to MC, population density, pruning and shoot topping, it is a great challenge to manage cotton such that production is optimized.
To explore the effects of crop management, crop simulation models have been used to address the effects of pruning (removal of branches), topping the main stem and branches to arrest development (Yang et al., 2008), and film cover (Zhang et al., 2008b). Numerous growth models have been developed for cotton (Duncan, 1972; Lemmon and Chuk, 1997; Zhang et al., 2008b). They simulate development, morphogenesis, fruit formation and abscission, photosynthesis, dry matter partitioning and yield, using a state-variable approach (de Wit and Goudriaan, 1978; Leffelaar, 1999). Such models play an important role in cultivation design and the evaluation of potential productivity of cotton in different agro-ecological zones. However, modelling development of cotton plants under the influence of external factors such as MC or population density requires a more detailed approach that takes into account the physiological processes and interactions within the plant at the level of the individual organs.
Cotton has an indeterminate fruiting habit, and produces two different types of branches (vegetative and fruiting) (Zhao and Oosterhuis, 2000), each with their own particular growth habit. Complex plant architectures such as with cotton are best simulated using functional–structural plant (FSP) models (Godin and Sinoquet, 2005; Hanan and Prusinkiewicz, 2008; Vos et al., 2010). FSP models explicitly describe the development over time of the three-dimensional (3D) architecture or structure of plants as governed by physiological processes as affected by genotype, environment and management. FSP models of cotton have been developed in the past (Room et al., 1996; de Reffye et al., 1999; Hanan and Hearn, 2003; Thornby et al., 2003; Renton et al., 2005; Jallas et al., 2009). However, these models do not consider the effects of plant density and MC on cotton architecture.
The objectives of this study were (1) to develop an FSP model of cotton that is capable of simulating plant response to MC application, population density and topping strategies; and (2) to quantify cotton plasticity in relation to agronomical practices using the FSP model and develop a tool that may be used for optimizing cotton management under different conditions, aiming at ultimately developing a tool to help farmers manage their cotton crop optimally in given environmental conditions.
MATERIALS AND METHODS
Experimental years and site
Field experiments were conducted in 2010, 2011 and 2012 at the Cotton Research Institute of the Chinese Academy of Agricultural Sciences, Anyang, Henan, China (36°07′N, 116°22′E). The soil of the experimental field is a sandy loam, with a pH of 8·0, a bulk density of 1·36 g cm−3, an organic matter content of 13·2 g kg−1, a total N content of 1·02 g kg−1, a total P content of 0·52 g kg−1 and a total K content of 17·3 g kg−1. Weather data were collected on site (Table 1).
Table 1.
Monthly weather data at the experimental site (Anyang, China) in three growing seasons
| Climate factor | Year | Apr. | May | Jun. | Jul. | Aug. | Sept. | Oct. |
|---|---|---|---|---|---|---|---|---|
| Tmin (°C) | 2010 | 6 | 14·9 | 20·2 | 23·6 | 21·1 | 16·3 | 8·5 |
| 2011 | 7·8 | 14·7 | 21·1 | 22·8 | 20·7 | 14·5 | 9·5 | |
| 2012 | 10·8 | 16·6 | 20·7 | 23·9 | 21·3 | 16·4 | 10·3 | |
| Tmax (°C) | 2010 | 17·5 | 26·7 | 32·4 | 33·2 | 29·3 | 25·8 | 21·2 |
| 2011 | 21·4 | 27·2 | 33·5 | 32·8 | 29·2 | 23 | 21 | |
| 2012 | 22·9 | 28·6 | 33·4 | 32·8 | 29·6 | 26·5 | 22·8 | |
| Rainfall (mm) | 2010 | 19·6 | 57·0 | 20·2 | 89·4 | 223·8 | 111·5 | 7·8 |
| 2011 | 7·6 | 41·2 | 13·5 | 84·0 | 152·6 | 109·9 | 37·2 | |
| 2012 | 45·6 | 4·9 | 44·7 | 184·1 | 145·9 | 29·3 | 12·5 |
Experimental design
The experiments comprised both a monoculture cotton crop (Gossypium hirsutum ‘Guoxin 3’) and an intercropping system of cotton and wheat (Triticum aestivum ‘Zhongyu 10’). The intercropping system involved treatments of cotton with and without MC at four population densities (3, 4·5, 6 and 7·5 plants m−2) in the intercrop, with three replicates in a randomized block design. MC was applied at seedling, squaring, flowering and boll stages. The MC dose was adjusted to plant stage: 6, 18, 45 and 60 g ha−1, respectively. Strips of wheat and cotton in intercrops consisted of three rows of wheat and two rows of cotton with a total width 1·4 m. Distance between rows in the pure cotton was 70 cm. In intercropping, distance between rows was 20 cm in the wheat strip and 40 cm in the cotton strip with 30 cm between adjacent border rows of wheat and cotton. The size of each block was 84 m2. In this study, population density was identical in the pure cotton and in the cotton intercrop. Detailed row configuration for wheat and cotton intercropping has been described by Zhang et al. (2007). In the monoculture cotton crop, the plants were grown at a population density of 6·0 plants m−2, and MC was applied with the same timing and dosage as in the intercropping system.
In the intercropping system, wheat was sown on 5 November of the previous year and harvested on 15 June. In both intercropping and monoculture systems, cotton were sown on 29 April and bolls were picked during October. Fertilizer was applied according to farmer's practice: 225 kg ha−1 N, 150 kg ha−1 P2O5 and 225 kg ha−1 K2O. Flood irrigations for cotton in 2010, 2011 and 2012 comprised 87, 87 and 50 mm, respectively.
Measurements
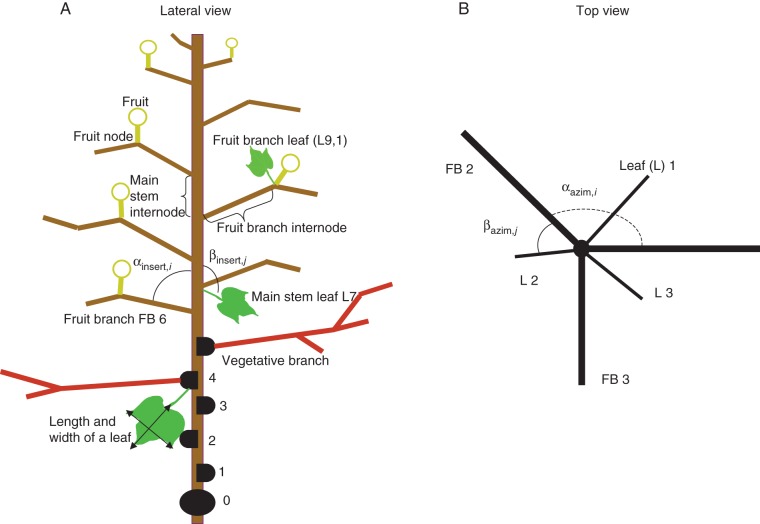
Destructive measurements were made on three plants in each plot (nine in total) during flowering and boll stages (110 d after sowing) in 2012 to obtain cotton architectural parameters. The insertion and azimuth angle of each branch and main stem leaf of the plants were measured using a protractor (Fig. 1). Length and diameter of each internode and leaf petiole as well as length and width of each leaf were measured with rulers and digital callipers. Phytomer rank was counted from the cotyledon node (0) upwards on the main stem, and from the insertion point (0) upwards on branches. Internode diameter was measured in the middle of the internode, and leaf length and width were measured as indicated in Fig. 1A. Leaf area was calculated as 0·81 × length × width (Zhang et al., 2008a) and LAI was calculated by multiplying total leaf area per plant with population density. To validate the model, LAI measured in 2010 and 2011 was used, as well as fruit branches and boll numbers per plant, plant height, and the number of phytomers per plant measured in 2010.
Fig. 1.
Schematic representation of cotton plant structure viewed from the side (A) and from the top (B). αazim,i and βazim,j are azimuth angles between two consecutive branches on the main stem, and between leaf and branch at the same phytomer rank (i for branch and j for leaf). αinsert,i and βinsert,j are insertion angles for branches and leaves at phytomer ranks i and j.
Data analysis
Curve estimations for calibration of the model were performed by using non-linear regression in SPSS 17·0 (SPSS Inc., Chicago, IL, USA). The significance of the difference between treatments was tested by using the Univariate General Linear Models procedure in SPSS. Goodness-of-fit was assessed with root mean square error (RMSE). The results given in figures were mean values and standard error for three replicates. In the case of non-significant treatment effects, mean values and standard error were averaged.
Model development
The FSP model of cotton, called CottonXL, was developed using the GroIMP platform (available for free at www.sourceforge.net/projects/groimp) (Hemmerling et al., 2008). In the model, extension of organs and development of the plant is driven by thermal time, expressed in growing degree days (GDD), the temperature sum of above 12 °C (Zhang et al., 2008b). All organ extension processes were represented by standard logistic growth equations, of which the upper asymptote parameters were parameterized using the final organ sizes as measured in the 2012 experiment. The rate of cotton development and growth of each organ were taken from a previous study (Zhang et al., 2008b), for example rates of organ appearances, leaf elongation, and fruit development from a square to flower to open boll, in relation to thermal time, and implemented in the model. To simulate the effects of MC and plant density on the rate of fruit development, appropriate empirical coefficients were derived and applied.
In the model, new phytomers appeared at a plastochron of 3–3·5 physiological days, i.e. the number of days required at optimal temperature (Zhang et al., 2008b). Plastochron values increased with increasing population density and the application of MC (L. Zhang, China Agricultural University, China, unpubl. res.). Fruits appeared on all phytomers on fruiting branches. Fruit development through successive stages (square, flower, immature green boll, mature open boll) was simulated using previously established relationships between fruit development and thermal time (Zhang et al., 2008b). These developmental parameters were set for all organs at different positions in this model. The probabilities of fruit abscission differed depending on the fruit age and were taken from Zhang et al. (2008b).
The model was calibrated using data from the field experiment in 2012. Relationships were set up between model parameters and MC application, plant population density and cropping system (monoculture and intercropping) and incorporated into the model.
Simulations
The model was validated by comparing simulated and measured LAI, plant height, number of fruit branches per plant, boll numbers per plant and phytomer numbers per plant. We simulated cotton growth at four population densities (3, 4·5, 6 and 7·5 plants m−2) and two MC treatments (with and without). Row distance was fixed to 0·7 m, similar to the experiment. Population densities were achieved by changing plant distance within the row accordingly. Additional simulation settings were set to farmers' practice, i.e. intercropping, no vegetative branches, main stem topping at 85 d after sowing (DAS) and branch topping at 110 DAS. Sowing date was set to 30 April, in the experiments. Simulations of the validation were run using temperatures in 2010 and 2011 at Anyang experimental station.
Additionally, to assess the predictive power of the model, we explored several agronomic scenarios. We applied CottonXL to explore the effects of agronomic practices on model output (population density, MC, topping time) at a wide range of densities (from 1·5 to 12 plants m−2). Although parameters of plant architecture (e.g. blade length, petiole diameter, internode length and diameter) were affected by plant density, which were outside the range of plant population densities in calibration and validation experiments, these differences did not affect simulation results on fruit development and the number of bolls. Thus, we first assessed the effect of MC on boll density (bolls m−2) and lint yield. The current model lacks provisions to directly simulate yield. Therefore, to extrapolate from boll numbers to cotton production, lint yield was estimated by multiplying simulated boll density with measured single boll weight (g per boll) and lint percentage (%), which were both taken from Ren et al. (2013). Secondly, we assessed the effect of the time of topping main stem and branches, i.e. farmers' practice (main stem topping at 85 DAS and branch topping at 110 DAS) and both 10 d earlier and later. The remaining settings were kept as in farmers' practice.
RESULTS
Model calibration
Azimuth and insertion angles
Azimuth angles αazim,i were not significantly affected by the phytomer rank (i), MC application, intercropping or population density (Table 2), which had a mean value of 133·7 ± 8·2°. Azimuth angles between leaf and branch on the same rank of phytomer, βazim,j, were not significantly affected by phytomer rank (j), MC, population density or cropping systems either (Table 2), with a mean value of –49·70 ± 3·78°.
Table 2.
Results of ANOVA for effects of cropping system, phytomer rank, mepiquat chloride (MC) and plant population density on parameters of cotton architecture
| Azimuth angle |
Insertion angle |
Blade length, M | Petiole length |
Petiole diameter |
Internode length |
Internode diameter |
|||||||
|---|---|---|---|---|---|---|---|---|---|---|---|---|---|
| Effect | αazim,i | βazim,j | αinsert,i | βinsert,j | M | B | M | B | M | B | M | B | |
| Cropping system | 0·959 | 0·280 | 0·288 | 0·000 | 0·008 | 0·000 | 0·578 | 0·001 | 0·446 | 0·005 | 0·000 | 0·789 | 0·000 |
| Phytomer rank | 0·981 | 0·061 | 0·000 | 0·033 | 0·014 | 0·000 | 0·000 | 0·347 | 0·000 | 0·000 | 0·000 | 0·000 | 0·000 |
| MC application | 0·194 | 0·392 | 0·828 | 0·352 | 0·000 | 0·385 | 0·526 | 0·090 | 0·005 | 0·004 | 0·000 | 0·000 | 0·000 |
| Population density | 0·087 | 0·280 | 0·936 | 0·377 | 0·017 | 0·000 | 0·137 | 0·000 | 0·000 | 0·220 | 0·004 | 0·001 | 0·000 |
P values are given in the table. M, main stem; B, branches. α, branch angle; β, leaf angle.
Insertion angle of the main stem leaf (βinsert,j) was significantly affected by intercropping (P < 0·00). For phytomer ranks above 10, βinsert,j in intercropping decreased linearly with phytomer rank: βinsert,j = –2·44 ± 0·20 × rank + 85·14 ± 3·18 (R2 = 0·931), while in monoculture, βinsert,j did not significantly differ between phytomers (Fig. 2) (P = 0·115) with an average value of 54·29 ± 1·12°. A decreasing insertion angle means that successive leaves are more erect. For phytomer ranks of 10 and below, this insertion angle was 90° for intercropping and 59·81 ± 1·83° for monoculture, i.e. the leaf orientation in intercropping was horizontal, whereas the leaf orientation in monoculture was orientated upwards. MC, population density and cropping system did not significantly affect branch insertion angle αinsert,i (Table 2). For phytomer ranks below 14, αinsert,i was 59·12 ± 0·76 °; for ranks 14 and higher, αinsert,i was 54·29 ± 1·12°.
Fig. 2.
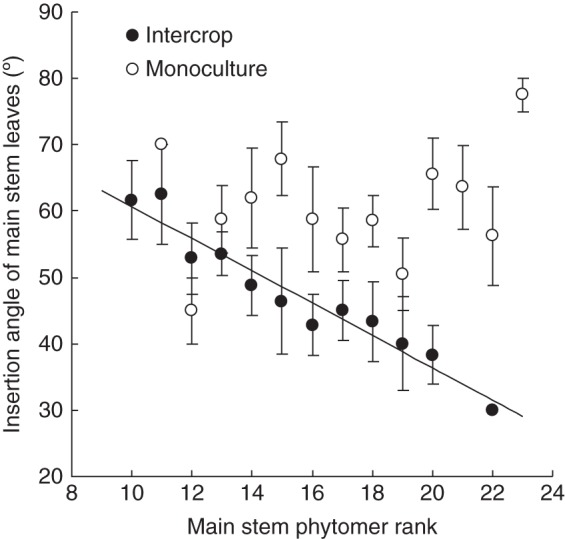
Insertion angles of main stem leaves affected by cropping system (open circles: intercrop, closed circles: monoculture) in Anyang, 2012. Values are means ± s.e. (n = 3).
Leaf dimensions
The relationship between final length of leaf blade on the main stem (L) and phytomer rank (r) was significantly affected by MC (P < 0·01, Fig. 3A). Final blade length was described using the Lorentz peak distribution function (Buck-Sorlin, 2002; Evers et al., 2005):
| (1) |
where Lm is final blade length of the largest leaf (cm), b is a slope coefficient and rm is phytomer rank of the largest leaf. The fitted values were Lm = 14·36 ± 0·21 cm, b = 16·97 ± 1·70 cm and rm =14·36 ± 0·38 with MC (R2 = 0·711), and Lm = 15·73 ± 0·28 cm, b = 15·39 ± 1·63 cm and rm =14·64 ± 0·40 without MC (R2 = 0·711).
Fig. 3.
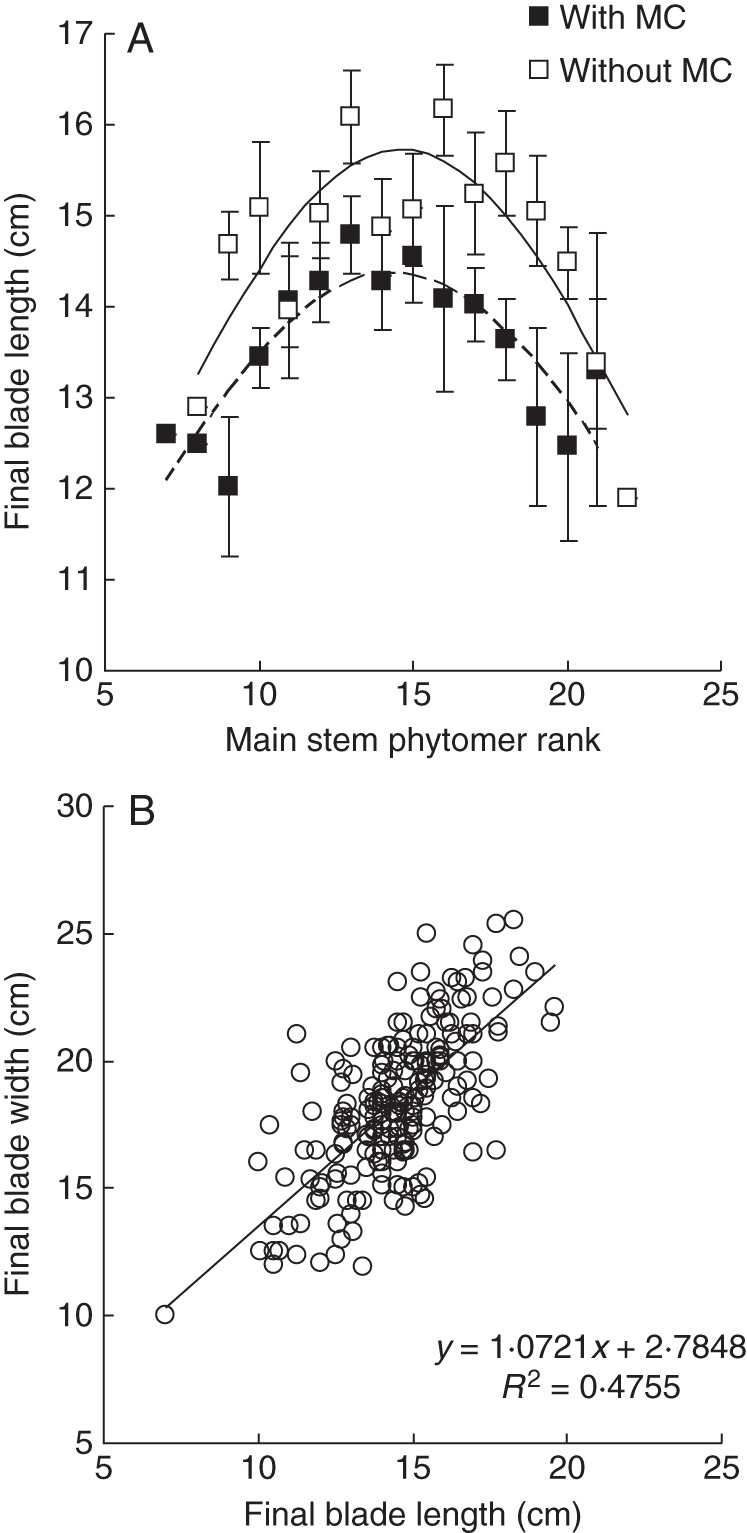
Effect of mepiquat chloride (MC) on the leaf blade length distribution on the main stem (A) and relationship between blade length and width for all leaves (B) in Anyang, 2012. Values are means ± s.e. (n = 3).
Final blade lengths for leaves on branches were correlated with the final length of the main stem leaf blade at the base of the branch, at a consistent fraction of 0·80 ± 0·01, i.e. all leaves on a branch had the same final size. Final blade width was linearly related to its final length, although variation was considerable (Fig. 3B). Fitted slope and intercept of the linear regression were 1·07 ± 0·08 and 2·79 ± 1·11, respectively.
Petiole dimensions
Petiole length of main stem leaves was significantly (P < 0·01) different among phytomer ranks, population density and cropping systems but not for MC (Table 2); we set petiole length to 19·13 ± 0·21 cm in intercropping and 16·12 ± 0·43 cm in monoculture (Fig. 4A), averaged over plant densities and MC treatments due to very limited variation between ranks and population densities.
Fig. 4.
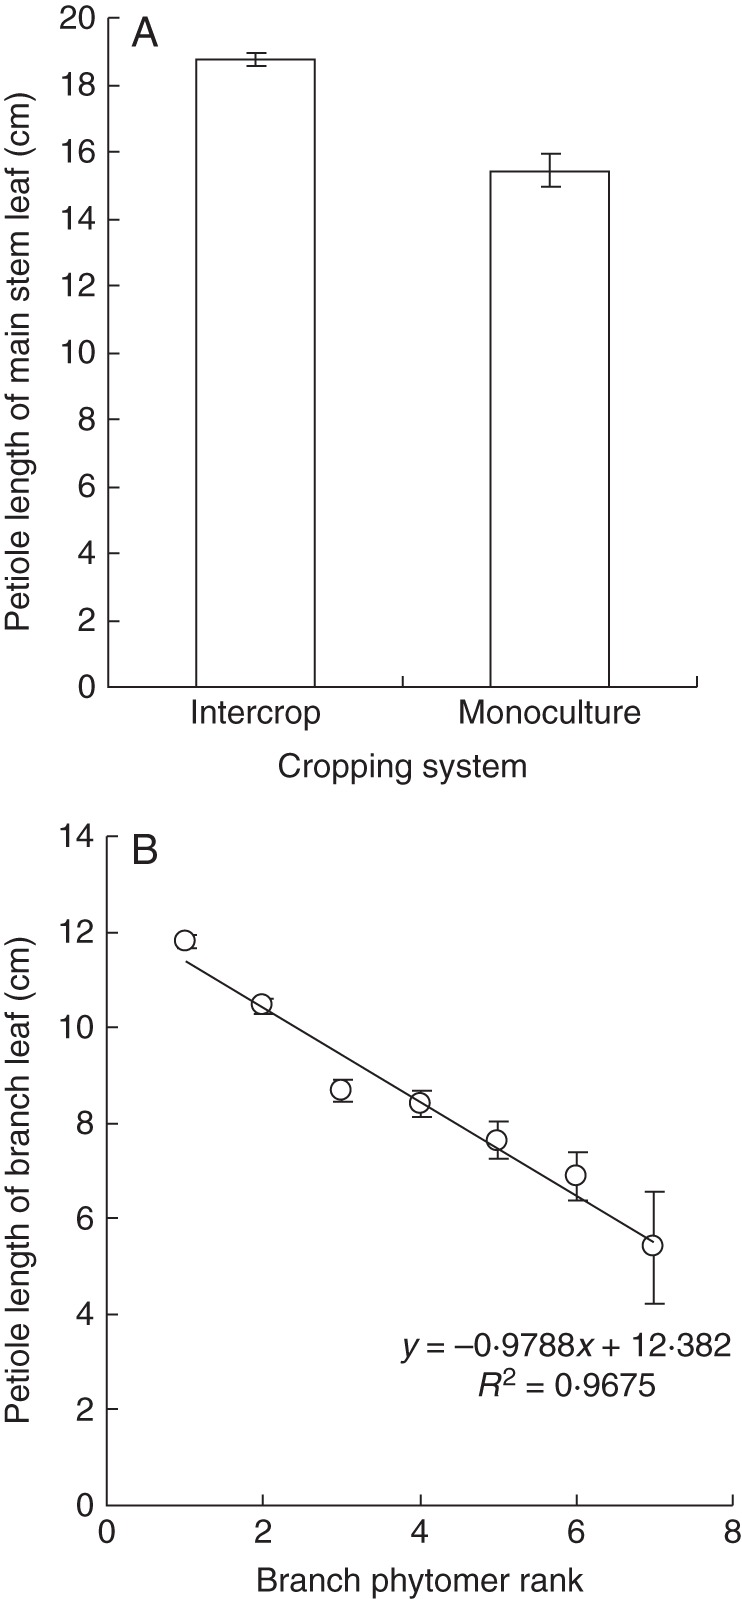
Petiole length of main stem (A) and branch (B) leaves in Anyang, 2012. Values are means ± s.e. (n = 3).
For leaves on branches, petiole length showed no significant effects of MC (P = 0·526), population density (P = 0·137) or cropping system (P = 0·578), but it was linearly related to phytomer rank where the branch was attached to the main stem (P < 0·01) (Fig. 4B). Fitted slope and intercept of the linear regression were –0·98 ± 0·08 and 12·38 ± 0·36 (R2 = 0·961), respectively.
The diameter of the leaf petiole on main stem leaves differed significantly with cropping systems and plant population density. The diameter of leaf petiole on branch leaves differed significantly with phytomer rank, MC and plant population density (Table 2).
Internode dimensions
Final length of main stem internodes was significantly (P < 0·01) affected only by MC (Table 2), and final length followed a Lorentz peak distribution (eqn 1) along the stem. The fitted parameter values were Lm = 5·63 ± 0·24 cm, b = 8·69 ± 0·86 cm and r0 = 14·42 ± 0·42 if MC was applied (R2 = 0·842), and Lm = 6·80 ± 0·23 cm, b = 7·87 ± 0·54 cm and r0 = 14·41 ± 0·28 if MC was not applied (R2 = 0·906) (Fig. 5A).
Fig. 5.
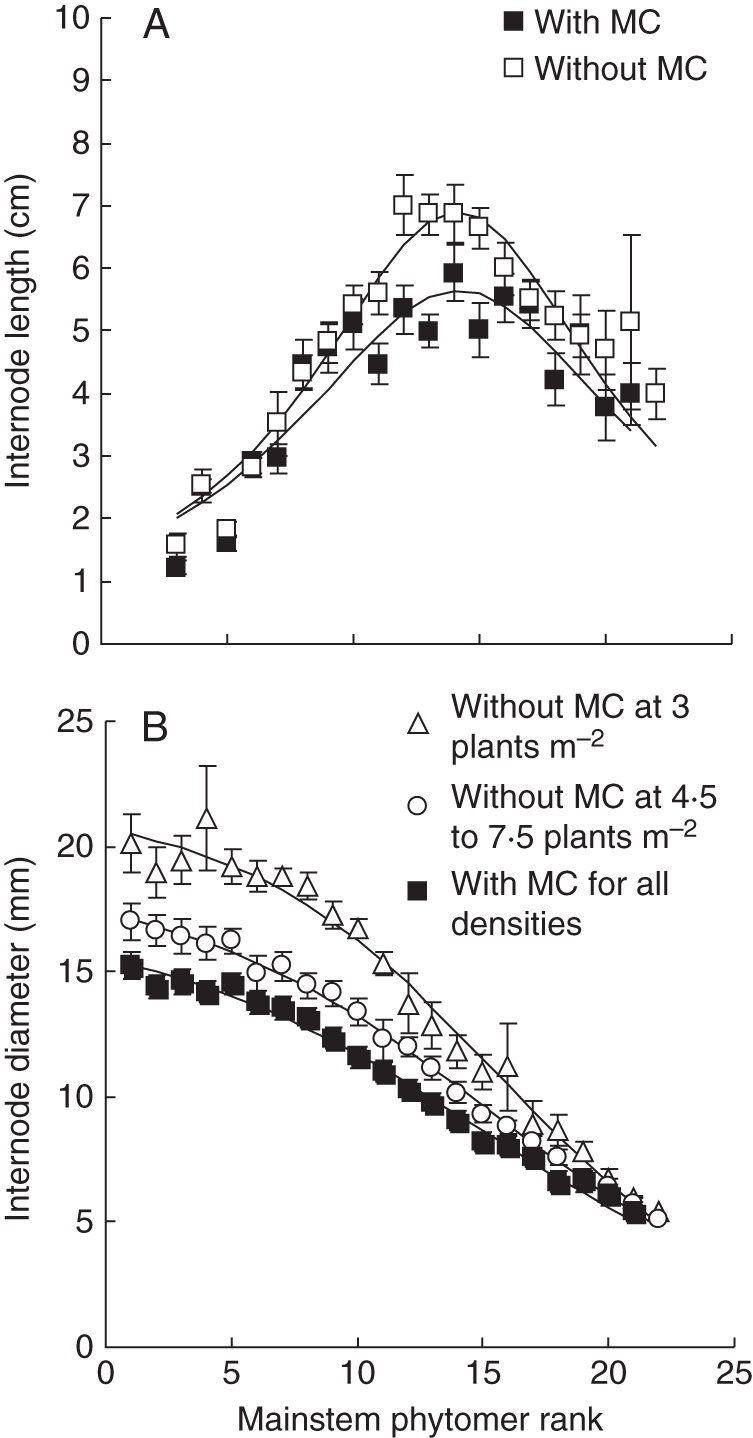
Internode length (A) and diameter (B) on the main stem affected by mepiquat chloride (MC) and plant population density. Low density indicates 3·0 plants m−2, and higher density indicates 4·5–7·5 plants m−2 in Anyang, 2012. Values are means ± s.e. (n = 3).
The final diameter of main stem internodes was significantly (P < 0·01) affected by MC and population density (Table 2). Application of MC significantly decreased final diameter (P < 0·01, Fig. 5B). Internode diameter was lower (12·46 ± 0·28 mm) at high population densities (4·5–7·5 plants m−2) than at the lowest population density of 3·0 plants m−2 (14·42 ± 0·63 mm). In all cases, internode diameter distribution along the main stem could be described by a decreasing logistic equation:
| (2) |
where Dr is final internode diameter (mm) at rank r, r is phytomer rank, Dm is the theoretical maximum internode diameter at the base of the plant, k is a slope coefficient and r0 is the phytomer rank at the inflection point. The fitted values for Dm, k and r0 were 17·44 ± 0·65 mm, 0·14 ± 0·01 and 15·01 ± 0·61 with MC application (R2 = 0·991). Without MC, fitted values were 21·84 ± 0·70 mm, 0·19 ± 0·015 and 17·58 ± 0·47 at 3·0 plants m−2 (R2 = 0·984), and 18·99 ± 0·39 mm, 0·16 ± 0·007 and 15·27 ± 0·32 at 4·5, 6·0 and 7·5 plants m−2 (R2 = 0·996).
Final branch internode length was significantly (P < 0·01) affected by MC application, cropping system and phytomer rank (Fig. 6A), and could be expressed using a logarithmic relationship with phytomer number on the branch (eqn 3):
| (3) |
where Lr is final branch internode length (cm), r is phytomer rank on the branch, a is a slope coefficient and b is the intercept. Similarly, final branch internode diameter was significantly (P < 0·01) affected by MC, population density, cropping system and phytomer rank (Table 2). The logarithmic function of eqn (3) (replacing Lr with Dr) was used to relate internode diameter to phytomer rank. Good fits were obtained, both at low and at high plant density, and with or without MC (R2 from 0·93 to 0·95; Fig. 6B, C).
Fig. 6.
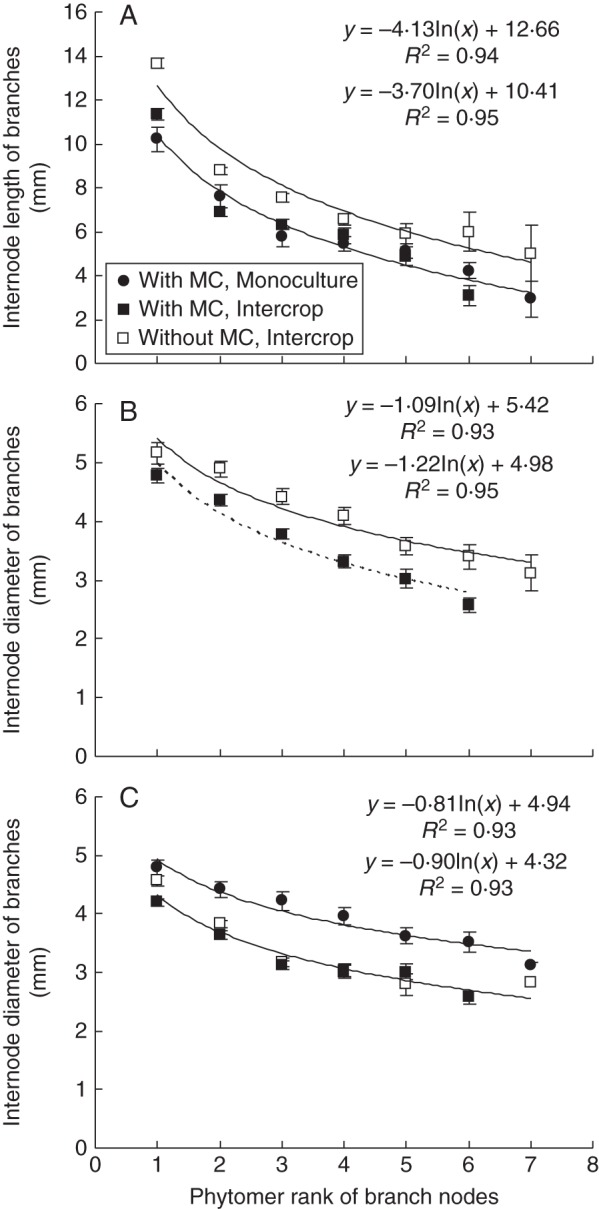
Internode length of branch phytomers over all population densities (A) and internode diameter for 3 plants m−2 (B) and for 4·5, 6 and 7·5 plants m−2 (C) as affected by mepiquat chloride (MC) and cropping system in Anyang, 2012. Values are means ± s.e. (n = 3).
Model validation
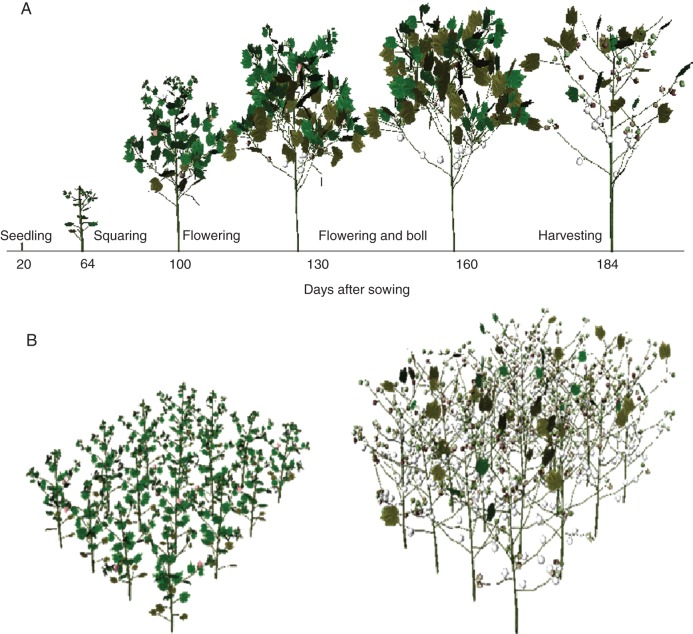
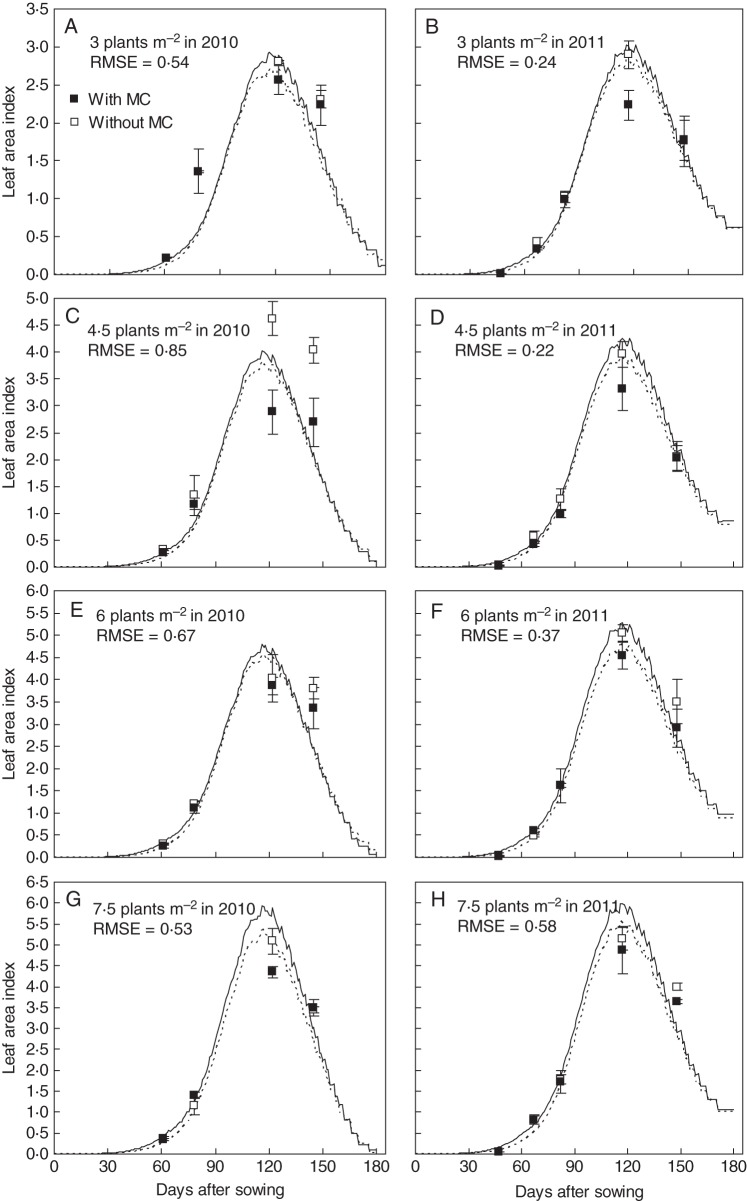
Simulations with CottonXL resulted in realistic visualizations of cotton plant architectural development (Fig. 7), including representation of overall plant geometry, plant height, formation of vegetative and fruiting branches, leaf area expansion and fruit number dynamics in terms of numbers of squares, flowers and bolls. Simulated LAI showed a characteristic pattern of increase during leaf production and extension, and decrease during leaf ageing and shedding (Fig. 8). There was satisfactory correspondence between simulated and actual LAI, with RMSE ranging from 0·22 to 0·85 m2 m−2 across densities. Measured and simulated plant height, number of bolls, fruiting branches and phytomers per plant in two plant population densities (4·5 and 7·5 plants m−2) for MC application and MC-free control showed good agreement, with low RMSE values (Fig. 9).
Fig. 7.
Visual output of simulated cotton at a plant population density of 7·5 plants m−2, with MC application, main stem topping to terminate development of the main stem at 95 d after sowing (DAS), and branch topping at 120 DAS: (A) single plant, (B) plot (left, 68 DAS; right, 220 DAS).
Fig. 8.
Simulation and validation of leaf area index in relation to mepiquat chloride (MC) application using data from the 2010 and 2011 experiments for all population densities. The solid line indicates the treatments without MC and the dotted line indicates those with MC. Values are means ± s.e. (n = 3).
Fig. 9.

Comparison of observed and simulated values for boll number per plant (A), number of fruit branches per plant (B), plant height (C) and phytomer number per plant (D) at 68, 108 and 136 d after sowing in relation to mepiquat chloride (MC) application and plant population density in 2010 in Anyang. Values are means ± s.e. (n = 3).
Scenario studies
Boll density increased with population density, but the rate of increase was lower at high densities (Fig. 10) because of a decrease in development rate of the plants at high densities. MC did not have a substantial effect on boll density. After converting boll density to yield, MC increased the yield only at higher densities (from 7·5 to 12 plants m−2).
Fig. 10.
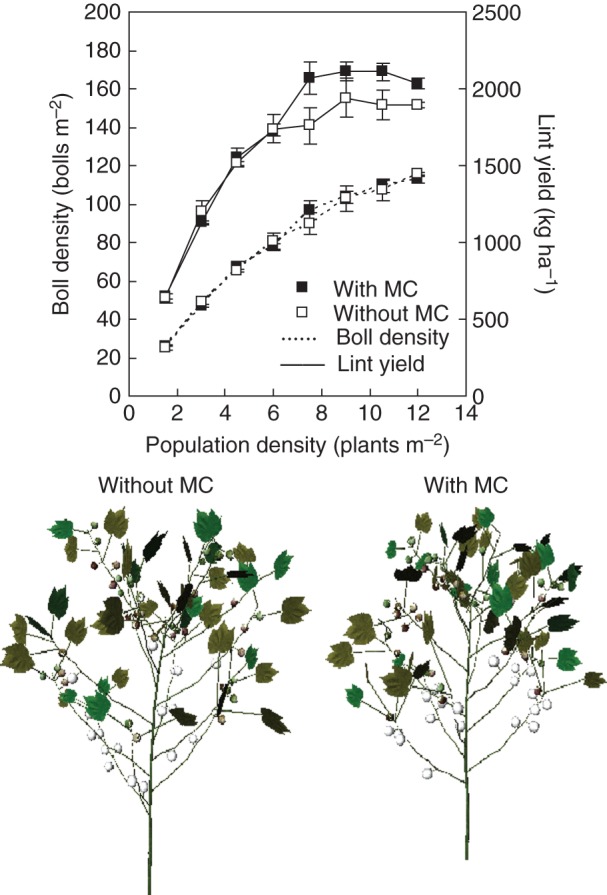
Visual comparison of cotton architecture at 196 d after sowing, simulated boll density and predicted lint yields in relation to population density and mepiquat chloride (MC). Values are means ± s.e. (n = 3).
An earlier time of topping main stem and branches, as compared with the usual topping time of farmers, i.e. 85 DAS for the main stem and 110 DAS for the branches, significantly decreased the number of bolls per plant, and hence boll density (Fig. 11), but later topping did not further increase boll density.
Fig. 11.
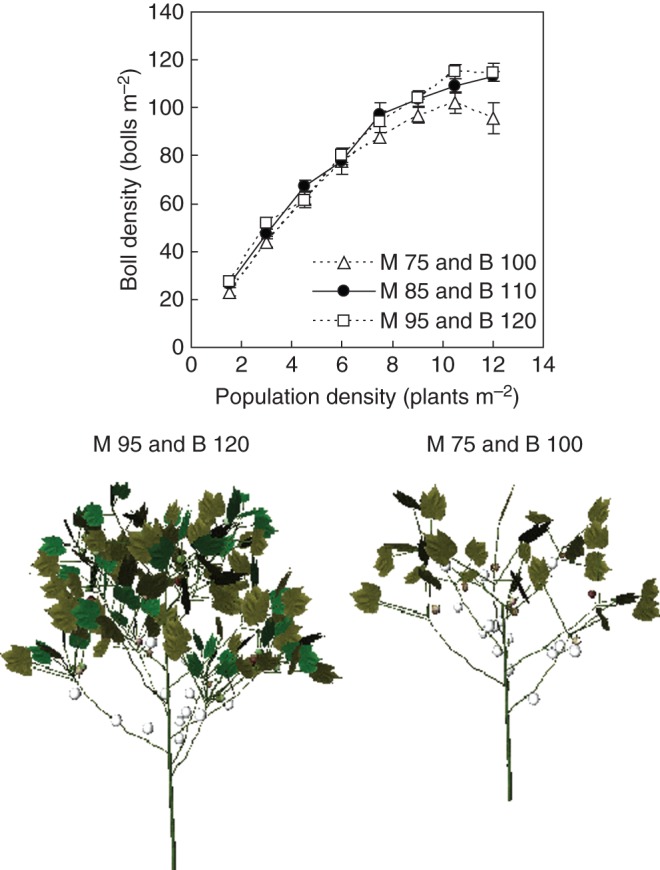
Visual comparison of cotton architecture at 168 d after sowing and simulated boll density at different times of topping main stem and branches in relation to population density. M, main stem topping; B, branch topping. The subsequent number indicates days after sowing. Values are means ± s.e. (n = 3).
DISCUSSION
An functional–structural plant model of 3D cotton structural development was developed, in which cotton development is driven by thermal time. The model includes the effects of agronomic practices related to plant structure: application of MC, plant population density, topping and cropping system (monoculture versus intercropping). The visual output and quantitative validation of the model using independent field data on LAI, plant height, number of fruit branches, bolls and phytomers demonstrated a good fit at low population density (Figs 8 and 9). Simulation was satisfactory but could still be improved, however, as the current version of the model does not simulate mechanistically the effect of increased plant–plant competition on leaf area growth. We conclude therefore that our current model is capable of simulating cotton development across population densities with and without MC, and can be used directly for studies that require a good description of cotton development. To improve predictions further, the model will need incorporation of detailed density-dependent processes to simulate cotton growth as affected by competition between plants. Such density dependence may be built in by allowing for competition for light and other resources, and including structural responses to neighbours, such as shade-avoidance responses (Franklin and Whitelam, 2005).
The relationships between plant architecture and MC we used in our model are in good agreement with observational data on MC effects on cotton leaf area (Reddy et al., 1990; Fernandez et al., 1991), plant height (Pettigrew and Johnson, 2005) and shoot length (de Almeida and Rosolem, 2012). Ren et al. (2013) suggested that MC application may reduce intraspecific competition due to a more compact plant structure. An interaction between MC and population density was suggested by York (1983). However, the opposite effects of MC and plant population density on fruit numbers showed a complex relationship (Ren et al., 2013). In that work, the interaction between MC and population density in their effect on yield was found only at high population densities. The scenario study revealed that only when population density was 7·5 plants m−2 or higher could lint yield be increased by MC. This result confirmed the assumption that the interaction between population density and MC exists only at high population density (Ren et al., 2013).
Using this FSP model for exploration of interactive effects of genotype (G) × management (M) × environment (E) on cotton yield and quality, will require further functional elaborations of CottonXL. For instance, the detailed exploration of the effects of MC and plant population density on cotton leaf area growth, light interception and yield require the simulation of light distribution, photosynthesis, carbon allocation and biomass growth of organs. Extending CottonXL with such functional elements will be the focus of future work, to achieve proper prediction of cotton yield under a range of environmental and management conditions.
CONCLUDING REMARKS
CottonXL simulates development of cotton structure as affected by agronomical practices well. The model can be applied as a tool to explore the interaction between crop structure and functioning, and to optimize agronomic management related to the morphology of the cotton crop. Also, the model can serve as a tool to guide set up of new experiments, ultimately leading to an improved understanding of cotton development as affected by external conditions. This will guide growers and breeders in their choice for proper crop management decisions and finding genotypes that have crop architecture optimally suited for specific conditions.
ACKNOWLEDGEMENTS
This research was supported by ‘948’ Program (2011-G19), Transgenic Major Project (2012ZX08013010) and the program of the Modern Agricultural Industry Technology System (CARS-18-18).
LITERATURE CITED
- de Almeida AQ, Rosolem CA. Cotton root and shoot growth as affected by application of mepiquat chloride to cotton seeds. Acta Scientiarum. Agronomy. 2012;34:61–65. [Google Scholar]
- Buck-Sorlin GH. L-system model of the vegetative growth of winter barley. In: Polani D, Kim J, Martinez T, editors. Fifth German Workshop on Artificial Life. Lübeck: Akademische Verlagsgesellschaft Aka GmbH; 2002. pp. 53–64. [Google Scholar]
- Duncan WG. SIMCOT: a simulator of cotton growth and yield. In: Murphy CM, editor. Proceedings of a Workshop for Modeling Tree Growth. Durham, NC: Duke University; 1972. pp. 115–118. [Google Scholar]
- Evers JB, Vos J, Fournier C, Andrieu B, Chelle M, Struik PC. Towards a generic architectural model of tillering in Gramineae, as exemplified by spring wheat (Triticum aestivum) New Phytologist. 2005;166:801–812. doi: 10.1111/j.1469-8137.2005.01337.x. [DOI] [PubMed] [Google Scholar]
- Fernandez CJ, Cothren JT, McInnes KJ. Partitioning of biomass in well-watered and water-stressed cotton plants treated with mepiquat chloride. Crop Science. 1991;31:1224–1228. [Google Scholar]
- Franklin KA, Whitelam GC. Phytochromes and shade-avoidance responses in plants. Annals of Botany. 2005;96:169–175. doi: 10.1093/aob/mci165. [DOI] [PMC free article] [PubMed] [Google Scholar]
- Godin C, Sinoquet H. Functional–structural plant modelling. New Phytologist. 2005;166:705–708. doi: 10.1111/j.1469-8137.2005.01445.x. [DOI] [PubMed] [Google Scholar]
- Gonias ED, Oosterhuis DM, Bibi AC. Cotton radiation use efficiency response to plant growth regulators. Journal of Agricultural Science. 2012;150:595–602. [Google Scholar]
- Gwathmey CO, Clement JD. Alteration of cotton source–sink relations with plant population density and mepiquat chloride. Field Crops Research. 2010;116:101–107. [Google Scholar]
- Gwathmey CO, Wassel OM, Michaud C. Pix effects on canopy light interception by contrasting cotton varieties. In: Richter DA, Armour J, editors. Proceedings of Beltwide Cotton Conference. Memphis, TN: National Cotton Council of America, 1153; 1995. [Google Scholar]
- Hanan J, Hearn AB. Linking physiological and architectural models of cotton. Agricultural Systems. 2003;75:47–77. [Google Scholar]
- Hanan J, Prusinkiewicz P. Foreword: studying plants with functional–structural models. Functional Plant Biology. 2008;35:i–iii. doi: 10.1071/FPv35n10_FO. [DOI] [PubMed] [Google Scholar]
- Hemmerling R, Kniemeyer O, Lanwert D, Kurth W, Buck-Sorlin GH. The rule-based language XL and the modelling environment GroIMP illustrated with simulated tree competition. Functional Plant Biology. 2008;35:739–750. doi: 10.1071/FP08052. [DOI] [PubMed] [Google Scholar]
- Jallas E, Sequeira R, Martin P, Turner S, Papajorgji P. Mechanistic virtual modelling: coupling a plant simulation model with a three-dimensional plant architecture component. Environmental Modeling & Assessment. 2009;14:29–45. [Google Scholar]
- Leffelaar PA. Basic elements of dynamic simulation. In: Leffelaar PA, editor. On systems analysis and simulation of ecological processes: with examples in CSMP, FST and FORTRAN. 1999. Dordrecht: Kluwer, 11–27. [Google Scholar]
- Lemmon H, Chuk N. Object-oriented design of a cotton crop model. Ecological Modelling. 1997;94:45–51. [Google Scholar]
- Mondino MH, Peterlin OA, Garay F. Response of late-planted cotton to the application of a growth regulator (chlorocholine chloride, CYCOCEL 75) Experimental Agriculture. 2004;40:381–387. [Google Scholar]
- Oosterhuis DM, Egilla JN. Field evaluation of plant growth regulators for effect on the growth and yield of cotton summary of 1995 results. In: Dugger P, Richter D, editors. Proceedings of Beltwide Cotton Conference. Memphis, TN: National Cotton Council of America; 1996. pp. 1213–1215. [Google Scholar]
- Pettigrew WT, Johnson JT. Effects of different seeding rates and plant growth regulators on early-planted cotton. Journal of Cotton Science. 2005;9:189–198. [Google Scholar]
- Reddy AR, Reddy KR, Hodges HF. Mepiquat chloride (PIX)-induced changes in photosynthesis and growth of cotton. Plant Growth Regulation. 1996;20:179–183. [Google Scholar]
- Reddy VR, Baker DN, Hodges HF. Temperature and mepiquat chloride effects on cotton canopy architecture. Agronomy Journal. 1990;82:190–195. [Google Scholar]
- de Reffye P, Blaise F, Chemouny S, Jaffuel S, Fourcaud T, Houllier F. Calibration of a hydraulic architecture-based growth model of cotton plants. Agronomie. 1999;19:265–280. [Google Scholar]
- Ren X, Zhang L, Du M, et al. Managing mepiquat chloride and plant density for optimal yield and quality of cotton. Field Crops Research. 2013;149:1–10. [Google Scholar]
- Renton M, Hanan J, Burrage K. Using the canonical modelling approach to simplify the simulation of function in functional–structural plant models. New Phytologist. 2005;166:845–857. doi: 10.1111/j.1469-8137.2005.01330.x. [DOI] [PubMed] [Google Scholar]
- Room P, Hanan J, Prusinkiewicz P. Virtual plants: new perspectives for ecologists, pathologists and agricultural scientists. Trends in Plant Science. 1996;1:33–38. [Google Scholar]
- Siebert JD, Stewart AM. Influence of plant density on cotton response to mepiquat chloride application. Agronomy Journal. 2006;98:1634–1639. [Google Scholar]
- Thornby D, Renton M, Hanan J. Using computational plant science tools to investigate morphological aspects of compensatory growth. Lecture Notes in Computer Science. 2003;2660:708–717. [Google Scholar]
- Vos J, Evers JB, Buck-Sorlin GH, Andrieu B, Chelle M, de Visser PHB. Functional–structural plant modelling: a new versatile tool in crop science. Journal of Experimental Botany. 2010;61:2101–2115. doi: 10.1093/jxb/erp345. [DOI] [PubMed] [Google Scholar]
- de Wit CT, Goudriaan J. Simulation of ecological processes. Wageningen: Pudoc; 1978. [Google Scholar]
- Yang YM, Ouyang Z, Yang YH, Liu XJ. Simulation of the effect of pruning and topping on cotton growth using COTTON2K model. Field Crop Research. 2008;106:126–137. [Google Scholar]
- York AC. Response of cotton to mepiquat chloride with varying N rates and plant populations. Agronomy Journal. 1983;75:667–672. [Google Scholar]
- Zhang L, van der Werf W, Zhang S, Li B, Spiertz JHJ. Growth, yield and quality of wheat and cotton in relay strip intercropping systems. Field Crops Research. 2007;103:178–188. [Google Scholar]
- Zhang L, van der Werf W, Bastiaans L, Zhang S, Li B, Spiertz JHJ. Light interception and utilization in relay strip intercrops of wheat and cotton. Field Crops Research. 2008a;107:29–42. [Google Scholar]
- Zhang L, van Der Werf W, Cao W, Li B, Spiertz JHJ. Development and validation of SUCROS-Cotton: a potential crop growth simulation model for cotton. NJAS-Wageningen Journal of Life Sciences. 2008b;56:59–83. [Google Scholar]
- Zhao D, Oosterhuis DM. Pix plus and mepiquat chloride effects on physiology, growth, and yield of field-grown cotton. Journal of Plant Growth Regulation. 2000;19:415–422. [Google Scholar]


