

Abstract
Mass spectrometric strategies to identify protein subpopulations involved in specific biological functions rely on covalently tagging biotin to proteins using various chemical modification methods. The biotin tag is primarily used for enrichment of the targeted subpopulation for subsequent mass spectrometry (MS) analysis. A limitation of these strategies is that MS analysis does not easily discriminate unlabeled contaminants from the labeled protein subpopulation under study. To solve this problem, we developed a flexible method that only relies on direct MS detection of biotin-tagged proteins called “Direct Detection of Biotin-containing Tags” (DiDBiT). Compared with conventional targeted proteomic strategies, DiDBiT improves direct detection of biotinylated proteins ∼200 fold. We show that DiDBiT is applicable to several protein labeling protocols in cell culture and in vivo using cell permeable NHS-biotin and incorporation of the noncanonical amino acid, azidohomoalanine (AHA), into newly synthesized proteins, followed by click chemistry tagging with biotin. We demonstrate that DiDBiT improves the direct detection of biotin-tagged newly synthesized peptides more than 20-fold compared to conventional methods. With the increased sensitivity afforded by DiDBiT, we demonstrate the MS detection of newly synthesized proteins labeled in vivo in the rodent nervous system with unprecedented temporal resolution as short as 3 h.
Keywords: biotinylated protein, mass spectrometry, DiDBiT, AHA, click chemistry, MudPIT, azidohomoalanine, retina, in vivo protein synthesis
Introduction
Proteome investigation has been significantly advanced by analysis of targeted subpopulations of proteins covalently labeled with biotin-containing tags.1−9 Enrichment of biotinylated proteins using avidin or its homologues conjugated with bead matrices allows candidate identification by mass spectrometry (MS)5 (Figure 1). For example, succinimide esters containing biotin that attach covalently to free amine groups have been used to study cell surface proteins in vitro and in vivo.10−12 Recently, a novel genetic-chemical strategy has targeted a biotinylating enzyme to dissect the proteome of specific intracellular organelles.13 Furthermore, using a promiscuous biotin ligase, protein interactions and complexes can be studied at the proteomic level.14 Another major application of protein biotinylation is bio-orthogonal metabolic labeling, for instance, to detect newly synthesized proteins by incorporation of azide- or alkyne-containing noncanonical amino acids,15 followed by copper catalyzed azide–alkyne cycloaddition (CuAAC) with biotin-containing tags.16,17 These chemical tagging methods are useful to target selected protein subpopulations for subsequent enrichment and MS analysis, but require the identification and discrimination of true candidates from background contaminating proteins. The contaminating proteins may result from nonspecific interactions with the bead matrix or nonspecific and specific interactions with the biotinylated proteins. After enrichment of biotinylated proteins from the complex mixture, the proteins are usually eluted off the beads followed by subsequent digestion or digested directly on the beads. Using either of these popular methods, the detection of the biotin modification on the peptides that serves as unambiguous identification of real “hits” and distinguishes them from contaminant proteins is poorly achieved.13,18−20 To alleviate this problem, additional MS analyses are typically performed on mock experiments, expensive colabeling reagents are added, or extensive non-MS validation is performed to distinguish biotinylated proteins from contaminants.10,13,18,21 These complex and time-consuming analyses to filter contaminant proteins are crucial for the accurate identification and assessment of the targeted proteome subpopulation.
Figure 1.

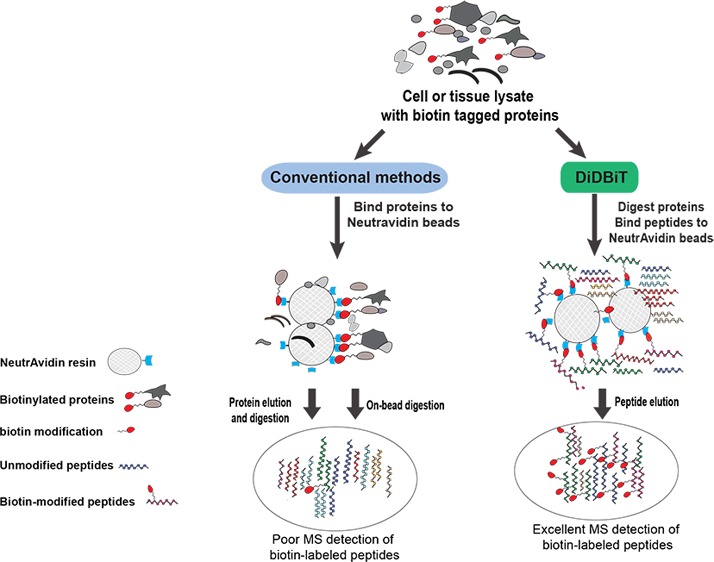
Schematic of DiDBiT and conventional strategies for sample preparation and analysis of purified biotinylated proteins. Conventional methods, schematized on the left in steps 1A–3A, involve incubating a complex mixture of proteins with NeutrAvidin beads (step 1A), washing the beads to remove unlabeled proteins (step 2A), elution of labeled proteins and protease digestion of eluted proteins (step 3A), or direct protease digestion of proteins bound to beads (step 3Ai). Note that labeled proteins may be a minority within the sample and that nonspecific or indirect binding to the beads may further decrease the representation of the labeled proteins. Coelution and codigestion of both labeled and unlabeled proteins often produces a mixture in which tagged peptides are too dilute for direct detection of tags (A and 3Ai; see outcome in Figure 3a). DiDBiT is schematized on the right in steps 1B–3B, showing the improvement in enrichment (step 1B), recovery (step 2B), and analysis (step 3B) of biotinylated peptides. Complete protease digestion of the input material allows the incubation of highly concentrated peptide mixtures with NeutrAvidin beads due the higher solubility of peptide mixtures in aqueous buffer (PBS) compared to their input protein extracts (step 1B). Washes to remove nonspecific bound peptides can be done in 5–10% acetonitrile in PBS (step 2B). Peptides bound to NeutrAvidin are efficiently eluted by boiling in TFA/FA/acetonitrile. This sample preparation protocol significantly increases labeled/nonlabeled peptide ratio (step 3B; see output results in Figure 3b). Biotinylated peptides were consistently detected using DiDBiT. This peptide elution strategy can also be used after the conventional on-bead digestion to release the bound peptides from the resin after trypsinization (A3ii or “on-bead release 2”) (see output results in Figure 3a).
Here we present a new strategy named Direct Detection of Biotin-containing Tags (DiDBiT) to improve the detection of the biotin modification on peptides for in vitro and in vivo applications. Unlike commonly used strategies, in DiDBiT proteins are digested prior to the enrichment of the biotin-tagged peptides. The reduced sample complexity in the mass spectrometer increases the yield of enriched biotinylated peptides, which, together with direct detection of the biotin modification, significantly increases identification of the biotin-labeled proteins. We compare DiDBiT with conventional strategies of MS sample preparation from cultured cells labeled with NHS-biotin, which produces abundant biotin label, and observe several fold increased detection of biotinylated peptides. We next tested the ability of DiDBiT to improve detection of a targeted population with much lower abundance, by labeling newly synthesized proteins with azidohomoalanine (AHA), followed by click chemistry tagging with biotin. We demonstrate that DiDBiT improves the direct detection of biotin-tagged newly synthesized proteins compared to conventional methods without the need of additional experiments or expensive colabeling reagents.21−23 With this increased sensitivity, we demonstrate the MS detection of newly synthesized proteins labeled in vivo in the rodent with temporal resolution as short as 3 h.
Experimental Procedures
Biotin-Labeling Procedures for HEK Cells and Retina
Biotinylation of HEK 293T Cells with NHS-Biotin
HEK 293T cells were grown to 100% confluence in 75 or 150 cm2 flasks, dissociated, and resuspended with TrypLE, transferred to 15 mL falcon tubes, centrifuged for 5 min at 1000 rpm at room temperature, and washed three times in Dulbecco’s modified PBS (DPBS, Gibco). Cells were incubated in suspension with 1 mg/mL of EZ-link NHS-biotin in 10 mL of DPBS at 4 °C with gentle rotation. Cells were washed three times in DPBS, pelleted by centrifugation, and frozen on dry ice. The biotinylated cell pellets were homogenized in RIPA buffer containing 1% NP40, 0.5% sodium deoxycholate, 0.1% SDS, 150 mM NaCl, 1 mM EDTA, and 25 mM TrisHCl, pH 7.4. Lysates were rotated at 4 °C for 30 min and centrifuged at 10 000g for 10 min at 4 °C to remove DNA and cell debris. After measuring the protein concentration using the DC Protein Assay Kit II (Bio-Rad), the lysates were aliquoted by transferring 1–2 mg of protein to 2 mL eppendorf tubes.
Labeling Newly Synthesized Proteins in Cultured Cells with AHA
HEK 293T cells were grown to 100% confluence in 75 cm2 flasks in growth media (DMEM media supplemented with 20% fetal bovine serum, containing among other amino acids, 0.2 mM methionine), in a 37 °C incubator in a humidified atmosphere of 5% CO2 in air. Prior to AHA labeling, media was replaced with HEPES buffered saline (HBS) supplemented with 4 mM CaCl2, 4 mM MgCl2, and 60 mM glucose (HBS + Ca + Mg + Gluc) and flasks were returned to the incubator for 30 min to deplete methionine from the medium. Media was changed again for HBS + Ca + Mg + Gluc with 4 mM AHA, and cells were incubated for 1 h at 37 °C. In some experiments, 8 mM AHA was added to the growth media without depleting methionine (Supporting Information Figure 1b). After 1 h incubation with AHA, cells were dissociated with TrypLE (Gibco), transferred to 15 mL falcon tubes, centrifuged for 5 min at 1000 rpm at room temperature, and washed three times in DPBS (Gibco). Cells were pelleted by centrifugation and stored at −80 °C until the click reaction with biotin-alkyne was performed, as described below.
Intraocular Administration of AHA
All protocols were approved by the Animal Care and Use Committee at the Scripps Research Institute. Male Wistar rats around 45 days old were anesthetized by injection of 75 mg/kg ketamine mixed with 5 mg/kg xylazine. To label newly synthesized proteins in the retina in vivo, we injected AHA (Anaspec) in phosphate buffer, pH 7 intraocularly. In preliminary experiments, in order to determine which dose achieves optimal AHA incorporation into proteins, we injected each eye with ∼5 μL of 4, 100, or 400 mM AHA in PBS, which correspond to doses of 14, 350, 1400 μg/kg, respectively. Intraocular injections were done using a pulled glass micropipette attached to a Picosprizer III microinjection system (Parker) as described previously.24 Based on published work estimating the dilution volume in the vitreous of 2 month old rats,25 we estimate an ∼6.5× dilution of injected AHA in the vitreous, resulting in an estimated 66 mM AHA concentration in the vitreous after 5 μL of 400 mM AHA stock injection and 0.66 mM after 5 μL of 4 mM AHA stock injection. For the mass spectrometry experiments 5 μL of 400 mM AHA solution was injected into each eye of 12 animals. Ointment containing topical anesthetic was applied to the injection site. After the procedure, animals were given 0.1 mg/kg Atipamezole, ip, to facilitate recovery from anesthesia. Six animals were euthanized in a CO2 chamber 3 h after the eye injections, and 6 animals were given a second dose of 400 mM AHA 20 h after the first eye injection and euthanized 3 h later. Eyes and optic nerves were dissected immediately after euthanasia and frozen in an isopentane/dry ice bath and stored at −80 °C. Eyes were thawed on ice and retinas were dissected and frozen again on dry ice. Retinas and optic nerves were homogenized in 0.5% SDS in PBS to extract AHA-labeled proteins and perform the click chemistry reaction, as described below.
Click Reaction for Biotinylation of AHA-Labeled Proteins from HEK Cell or Retina Lysates
AHA-labeled HEK cell pellets or neuronal tissue (optic nerves or retinas) were lysed in 0.5% SDS in PBS plus a cocktail of endogenous protease inhibitors (Complete Protease Inhibitor Cocktail Tablets, Roche) by homogenizing and sonicating with 10 pulses using a tip sonicator (Sonic Dismembrator model 100, Fisher Scientific). Samples were boiled for 10 min and cooled to room temperature. Any remaining insoluble material was resuspended with additional sonication pulses. Protein concentration in the suspension was measured, and aliquots of 1.5 mg of protein suspension were transferred to eppendorf tubes. AHA that was incorporated into proteins was labeled with PEG4 carboxamide-Propargyl Biotin (biotin-alkyne) (Invitrogen) by click chemistry reaction performed in the total protein suspension as described previously.9,17 Centrifugation steps that can result in loss of AHA-labeled material were avoided to maximize coverage of AHA biotin labeled protein by MS. For each reaction, we used an aliquot of 1.5 mg of protein suspension, adding PBS to reach 346 μL before adding the click reaction reagents. We added the following reagents in sequence, vigorously vortexing after each addition: 30 μL of 1.7 mM tris[(1-benzyl-1H-1,2,3-triazol-4-yl)methyl]amine (TBTA) (Sigma) dissolved in 4:1 tert-butanol/DMSO (Sigma), 8 μL of 50 mM CuSO4 dissolved in ultrapure water (Sigma), 8 μL of 5 mM of PEG4 carboxamide-Propargyl Biotin (biotin-alkyne) (Invitrogen) dissolved in DMSO, and 8 μL of 50 mM TCEP (Sigma) dissolved in water. The click reactions were incubated at room temperature for 1–2 h or overnight with gentle rotation at 4 °C. After the completion of each click reaction, samples were aliquoted by transferring 200 μL of each click reaction suspension to 2 mL eppendorf tubes. Proteins were precipitated with methanol/chloroform, as described below. To assess the efficiency of the click reaction and sample quality for MudPIT detection, 10 μL of each reaction was collected for Western blot detection.
DiDBiT Protocol
Protein Precipitation for DiDBiT
Protein aliquots containing NHS-biotin or AHA-biotin labeled proteins were precipitated by adding three volumes of methanol, one volume of chloroform, and three volumes of water, vortexed, and centrifuged at 15 000g for 2 min at room temperature. The aqueous and organic phases were removed carefully from the tube without disturbing the protein disc at the interface. Protein pellets were washed once by adding three volumes of methanol and centrifuging at 15 000g for 2 min. Pellets containing biotinylated proteins were air-dried for 10 min before total protein digestion as described bellow.
Protein Digestion for DiDBiT
Protein pellets were digested with trypsin and ProteaseMax surfactant trypsin enhancer (Promega) in all experiments following DiDBiT, except were indicated below. We resuspended the protein pellet in 200 μL of a buffer containing 4 M urea, 50 mM NH4HCO3, and 0.1% ProteaseMax with a brief sonication pulse. The protein suspension was reduced by adding tris(2-carboxyethyl)phosphine (TCEP, Sigma) to 5 mM final concentration. The solution was incubated at 55 °C with vigorous orbital shaking using a Thermomixer (Eppendorf). Protein alkylation was done by adding iodoacetamide (Sigma) to 10 mM final concentration and incubating with vigorous shaking in the dark for 20 min. To digest the proteins, we added in the following order: 150 μL of 50 mM NH4HCO3, 2.5 μL of 1% ProteaseMAX dissolved in 50 mM NH4HCO3, and 1:100 (enzyme/protein, w/w) sequencing grade trypsin (Promega) to a final reaction volume of 500 μL. The digestion reactions were incubated for 3 h at 37 °C with vigorous orbital shaking and stored at −80 °C until enrichment of biotinylated peptides.
In one experiment, proteins pellets from NHS-biotin labeled cells were digested with Proteinase K (Roche) as described.26 The pellets were solubilized by vigorously vortexing and pipetting in 1 mL of buffer containing 8 M urea and 0.2 M NaHCO3, pH = 11. Solubilized proteins were reduced by adding TCEP to 5 mM final concentration while rotating during 20 min and alkylated by adding 20 μL of 0.5 M iodoacetamide to 10 mM final concentration while rotating for 20 min in the dark. Proteins were digested by incubating with 1:50 (enzyme/protein, w/w) Proteinase K for 5 h at 37 °C with vigorous orbital shaking.
Enrichment of Biotinylated Peptides for DiDBiT
The protein digestion reactions from both NHS-biotin and biotin-AHA labeled proteins were stopped by adding trifluoroacetic acid (TFA) (Sigma) to 0.1% final concentration. Samples were centrifuged at 20 000g for 20 min at room temperature to remove undigested insoluble material and supernatant containing the peptide mixture was collected in an eppendorf tube. Any remaining peptides in the insoluble pellet were extracted by adding 0.5 mL of 0.1% TFA in water, resuspending the pellet by pipetting and centrifuging again for 20 min. The supernatant was pooled with the previous one before desalting using Sep-Pak tC18 solid-phase extraction cartridges (Waters) as described previously.27 We used the cartridges at 20% capacity. A maximum of 20 mg of peptides was loaded onto a 100 mg capacity cartridge. Prior to loading the mixture of peptides, the cartridges were washed sequentially with 3 mL of acetonitrile, 3 mL of 0.5% acetic acid, 50% acetonitrile in water, and 3 mL of 0.1% TFA in water. After loading the peptide mixtures, the cartridges were washed with 3 mL of 0.1% TFA and then with 0.250 mL of 0.5% acetic acid in water. The peptides were eluted into a clean tube with 1 mL of 0.5% acetic acid, 80% acetonitrile in water, and dried in eppendorf tubes in a Speed Vac (Thermo). Ten milligrams of dried peptide pellet was solubilized in 1 mL of PBS and incubated with a 200 μL slurry of NeutrAvidin beads (Pierce) for 1 h at room temperature. The beads were precipitated by centrifugation at 1000g for 5 min and flow through was collected for MS analysis of unbound peptides. Beads were washed three times by adding 1 mL of PBS with 1 mL of 5% acetonitrile in PBS, and a last wash in ultrapure water. Excess liquid was completely removed from the beads using a micropipette, and biotinylated peptides were eluted by adding 0.3 mL of solution containing 0.2% TFA, 0.1% formic acid, and 80% acetonitrile in water. The beads were centrifuged at 1000g and the first elution of biotinylated peptides was transferred to an eppendorf tube. A second elution of 0.3 mL was boiled for 5 min for maximum release of peptides from the beads. A total of 10 elutions were collected and dried separately in a Speed Vac. The enriched biotinylated peptides were resuspended in 0.2 mL PBS, and the pH was corrected by adding 20 μL of 1.5 M TrisHCl buffer (pH = 7.4). A 10 μL aliquot of the elution was taken to measure biotinylated peptide content.
Analysis of Biotin Content in Peptide Samples for DiDBiT
The biotin content of biotinylated peptide mixtures in samples for MS analysis was determined using Fluorescent Biotin Quantitation kit (Thermo Scientific Pierce) with a Synergy Mx Microplate Reader (Biotek) measuring fluorescent excitation/emission at 495/520, according to the manufacturer’s instructions. Fluorescent reads from biocytin solutions in PBS with concentrations between 0.5 and 10 pmol/μL were used as a standard curve. Samples processed following our protocol for DiDBiT that have signals greater than 1.5–4 pmol biotin/μL were shown to be highly suitable for MS analysis. In samples with concentrations below 1 pmol biotin/μL, few if any biotin labeled peptides could be detected.
On-Bead Digestion
Protein enrichment before on-bead digestion was done according to previously published protocols13,28 with minor modifications. NHS-biotin labeled proteins from HEK cell lysates were incubated with 250 μL NeutrAvidin beads in RIPA buffer for 1 h at room temperature and loaded into an empty gravity-flow column (Pierce). The sample was washed with 100 bed volumes of RIPA buffer, 10 bed volumes of PBS, and 10 bed volumes of 50 mM NH4HCO3 in water. In the case of pelleted proteins containing biotin-AHA labeled proteins (see above), a resolubilization step was required before NeutrAvidin bead incubation. Following a previously reported protocol for purification of biotinylated proteins from pelleted lysate,9 we resolubilized the pellet in 6 M urea and 1% SDS and, after diluting the sample 1:1 in PBS, the solubilized proteins were incubated in 250 μL of a slurry of NeutrAvidin beads for 2 h at room temperature. Beads were then precipitated by centrifugation at 1000g for 5 min at room temperature then transferred to a gravity-flow column and washed with 50 bed volumes of 1% SDS in PBS, 100 bed volumes of PBS, and 10 bed volumes of 50 mM NH4HCO3. After the protein enrichment and wash steps, NHS-biotin or biotin-AHA labeled proteins bound to beads were trypsinized following previously published protocols5,16 with the following minor modifications: Beads were resuspended in 3 M urea and 50 mM NH4HCO3 in water. Proteins bound to beads were reduced by adding TCEP to 5 mM final concentration and incubated with vigorous orbital shaking for 30 min at 55 °C. Protein alkylation was done by adding iodoacetamide to 11 mM final concentration and incubating with vigorous shaking in the dark for 30 min. We then added 5 μg of trypsin, which corresponds approximately to a ratio of 1/100 trypsin/bound-protein (calculated from the maximum binding capacity of the beads: 2 mg/mL, biotinylated albumin according to the manufacturer). We added trypsin enhancer surfactant ProteaseMax to 0.03% final concentration to the digestion reaction and incubated for 3 h at 37 °C with vigorous vortexing. Digested bead suspensions were loaded onto spin columns and centrifuged at 2000g for 5 min to separate the released peptides from the NeutrAvidin beads. The sample was analyzed by MS as “on-bead digestion of bound proteins” (see Figures 3a,c and 4d). Peptides that remained bound to the beads after digestion due to the strong biotin binding to NeutrAvidin were released by eluting with a solution containing 0.2% TFA, 0.1% formic acid, 80% acetonitrile, and 20% water as described above for DiDBiT. This sample was analyzed by MS as “on-bead digestion release 2” (see Figures 3a,d and 4d).
Figure 3.

Comparison of DiDBiT with conventional methods to identify biotin-labeled peptides from HEK cells labeled with NHS-biotin. (a) Starting with equal amounts of material (6 mg of protein lysate) and using reverse-phase separation coupled to MS analysis, we compared DiDBiT and 2 protein enrichment methods (outputs of the fractions in 3A, 3Ai, 3Aii, and 3B described in Figure 1). (b–d) Venn diagrams showing the overlap of modified proteins detected with the DiDBiT strategy and unmodified proteins detected with protein elution (b) on-bead digestion (c) and elution of bound peptides in the “on-bead digestion release 2” fraction (d). The modified peptides detected using DiDBiT are highly overlapping (88.2%) with the modified peptides detected in the on-bead digestion release 2 fraction, however DiDBiT detected 10× more biotin modified proteins (d). (e) Plot of the number of peptides identified per protein for the three methods. Similar coverage per protein was obtained with DiDBiT, on-bead digestion, and protein elution.
Figure 4.

Application of DiDBiT to identify newly synthesized proteins in HEK cells. (a) Schematic of the biotin-AHA modification with mass gain of 523.2749 on methionine sites in peptides. (b) HEK cells were exposed to AHA for 1 h. Starting from 10 mg of protein lysate and using MudPIT analysis, we identified 4210 modified peptides corresponding to 1817 newly synthesized proteins by a mass gain of 523.2749. We identified and filtered out 711 unmodified peptides corresponding to 345 proteins. As expected, only unmodified peptides were detected in the analyses from NeutrAvidin beads flow-through after peptide enrichment, no modified peptides were detected. (c) Analysis of the cellular compartments from which newly synthesized proteins were identified (d) Comparison of DiDBiT and on-bead digestion to detect AHA-biotin labeled newly synthesized proteins from HEK cells. Starting from 6 mg of protein lysate and using reverse-phase separation coupled to MS analysis, DiDBiT increased detection of modified proteins 23-fold. (e) Venn diagram showing the selective identification of biotinylated proteins using DiDBiT compared to the detection of unmodified peptides from on-bead digestion. More than half of the biotinylated proteins identified by DiDBiT were not detected in samples from on-bead digestion. The majority of unmodified proteins (86%) detected by on-bead digestion were not detected by with DiDBiT, and are likely contaminants from incomplete purification of biotinylated proteins. (g) Plots of the number of peptides per protein for DiDBiT and on-bead digestion. AHA-labeling results in relatively sparse coverage.
Protein Elution and Digestion
Protein enrichment by incubation with NeutrAvidin beads and elution with guanidine denaturing solution was done according to previously published reports29−31 with minor modifications. NHS-biotin labeled proteins from HEK cell lysates were incubated with 250 μL of NeutrAvidin beads in RIPA buffer for 1 h at room temperature. Beads were precipitated by centrifugation at 1000g for 5 min at room temperature, loaded into an empty gravity flow column, washed with 1000 bed volumes of RIPA buffer and 100 bed volumes of PBS, and eluted with 8 M guanidine·HCl, (pH 1.5) buffer, collecting 0.2 mL fractions. All the fractions were precipitated with methanol/chloroform, as described above. Protein pellet containing biotinylated proteins was resuspended and digested as described above in the “Protein Digestion for DiDBiT” subsection. The sample was analyzed by MS as “Protein enrichment and elution” (see Figure 3a and b).
Western Blots
The efficiency of protein biotinylation after the click reactions of AHA labeled proteins with biotin-alkyne was evaluated using Western blots. Ten microliter aliquots of the completed click reactions were mixed with 10 μL of 2× sample buffer, boiled for 5 min, and loaded onto 4 to 20% precast gradient gels SDS-polyacrylamide gel electrophoresis (PAGE) (Bio-Rad). The separated proteins were transferred to nitrocellulose membranes, and blots were incubated in blocking solution containing 5% nonfat milk and 0.05% Tween 20 (Sigma) in Tris-saline buffer, pH = 7.6 (TBST). Membranes were incubated with primary antibodies overnight at 4 °C in 10 mL of blocking solution. The following primary antibodies were used in this study: (1:1000) goat polyclonal anti-biotin antibody (Thermo Scientific) or (1:1000) streptavidin-HRP (Cell signaling Technology). Blots were washed three times in TBST for 10 min and incubated with 1:2000 HRP-linked rabbit anti-goat IgG (Biorad) in blocking solution for 1 h at room temperature. Blots incubated with streptavidin-HRP do not require a secondary antibody. Bands were visualized on autoradiography film (HyBlot CL from Denville Scientific Inc.) using an ECL chemiluminescence kit (Pierce). Following our protocol, biotin labeled proteins should be detected with 1–2 s film exposure to membranes. Weaker Western blot signals (greater than 1 min exposure) indicate that biotin labeling is low in the samples and few biotin labeled proteins would be detected by MS analysis.
Peptide Chromatography and MS Collection
For analysis by Multidimensional Protein Identification Technology (MudPIT), the peptides were pressure-loaded onto a 250 μm i.d. capillary with a kasil frit containing 2 cm of 10 μm Jupiter C18-A material (Phenomenex, Ventura, CA) followed by 2 cm 5 μm Partisphere strong cation exchanger (Whatman, Clifton, NJ). This loading column was washed with buffer containing 95% water, 5% acetonitrile, and 0.1% formic acid. After washing, a 100 μm i.d. capillary with a 5 μm pulled tip packed with 15 cm 4 μm Jupiter C18 material (Phenomenex, Ventura, CA) was attached to the loading column with a union and the entire split-column (loading column–union–analytical column) was placed inline with an Agilent 1100 quaternary HPLC instrument (Palo Alto, CA). The sample was analyzed using a modified 12-step separation described previously.32 The buffer solutions used were 5% acetonitrile/0.1% formic acid (buffer A), 80% acetonitrile/0.1% formic acid (buffer B), and 500 mM ammonium acetate/5% acetonitrile/0.1% formic acid (buffer C). Step 1 consisted of a 60 min gradient from 0 to 100% buffer B. Steps 2–11 had the following profile: 3 min of 100% buffer A, 5 min of X% buffer C, a 10 min gradient from 0 to 10% buffer B, and a 105 min gradient from 15 to 100% buffer B. The buffer C percentages (X) were 10, 15, 20, 25, 30, 35, 40, 45, 50, and 60% respectively for the 12-step. In the final two steps, the gradient contained 5 min of 100% buffer A, 5 min of 100% buffer C, a 10 min gradient from 0 to 15% buffer B, and a 105 min gradient from 15 to 100% buffer B. As peptides eluted from the microcapillary column, they were electrosprayed directly into an LTQ-OrbitrapXL mass spectrometer (ThermoFinnigan, Palo Alto, CA) with the application of a distal 2.4 kV spray voltage. A cycle of one full-scan FT mass spectrum (300–1600 m/z) at 60,000 resolution followed by 10 data-dependent IT MS/MS spectra at a 35% normalized collision energy was repeated continuously throughout each step of the multidimensional separation. Application of mass spectrometer scan functions and HPLC solvent gradients were controlled by the Xcaliber data system.
Peptides for single reverse-phase separation were handled similar to MudPIT except the frit did not contain SCX. The column was placed inline with an Agilent 1100 quaternary HPLC instrument (Palo Alto, CA) and analyzed using 5 h gradient of buffer B 0–100%. The peptides were electrosprayed directly in a Velos mass spectrometer (ThermoFinnigan, Palo Alto, CA). The data collection parameters were identical to the MudPIT analysis except 20 data-dependent IT MS/MS spectra were employed.
Analysis of Tandem Mass Spectra
MS/MS spectra were analyzed using the following software analysis protocol. MS/MS spectra remaining after filtering were searched with the Prolucid Sotware33 against the UniProt_Human_02_09_2013 or UniProt_Rat_07_21_2011 (for the HEK cells and retina samples, respectively) concatenated to a decoy database in which the sequence for each entry in the original database was reversed.34 All searches were parallelized and performed on a Beowulf computer cluster consisting of 100 1.2 GHz Athlon CPUs.35 No enzyme specificity was considered for any search. The following modifications were searched for a static modification of 57.02146 on cysteine for all analyses, a differential modification of 523.2749 on methionine for AHA, and 226.0776 on lysine for NHS-biotin. Prolucid results were assembled and filtered using the DTASelect (version 2.0) program.36,37 DTASelect 2.0 uses a linear discriminant analysis to dynamically set XCorr and DeltaCN thresholds for the entire data set to achieve a user-specified false discovery rate (FDR). In addition, the modified peptides were required to be fully tryptic (except for the proteinase K digest), less than 5 ppm deviation from peptide match, and a FDR at the spectra level of 0.01. The FDRs are estimated by the program from the number and quality of spectral matches to the decoy database. For all data sets, the protein FDR was <1% and the peptide FDR was <0.5%. Cellular localization as annotated by Gene Ontology was determined by STRAP (Software Tool for Researching Annotations of Proteins).38 We predict any mass spectrometer will be capable of analyzing a DiDBiT sample. The mass spectrometers used in this study were ion traps, that are capable of high resolution and high mass accuracy, which increase the confidence in modified peptide identifications compared to low resolution mass spectrometers.
Results and Discussion
Our goal was to establish a method to allow direct detection of biotin-modified peptides by MS/MS so that biotinylated proteins in a complex protein mixture could be directly identified, thereby minimizing the requirement for time-consuming validation of labeling in candidates. Conventionally, cell lysates containing biotinylated proteins are incubated with NeutrAvidin beads, which are subsequently washed to remove unbound proteins (Figure 1, left, steps A, 1–3). The proteins that remain bound to the beads are either digested directly on the beads (“on-bead digestion method”, Figure 1, step 3Ai)5,9,16,39 or eluted from the beads and then digested (“protein elution method”, Figure 1, step 3A).1,5,10,13,14,19 The major problem with these methods is that the low abundance of the biotinylated peptides in the complex peptide mixture decreases the chances of identifying them by MS analysis. This in turn makes it difficult to distinguish biotinylated proteins from unlabeled proteins. In DiDBiT, cell lysates are first digested and the resulting peptides are incubated with NeutrAvidin beads to enrich for the biotin-tagged peptides. The highly enriched biotin-tagged peptides are then eluted for MS analysis (Figure 1, right panel, steps 1–3B).
Application of DiDBiT to Identify NHS-Biotin-Labeled Proteins in HEK Cells
We initially tested our strategy by incubating HEK 293T cells with NHS-biotin, which labels proteins with exposed lysines and N-terminal amino acids, adding a mass of 226.0776 (Figure 2a). Cells were lysed, proteins were precipitated and digested. Resulting peptides were incubated with NeutrAvidin beads and the bound peptides were eluted with a stringent denaturing buffer (80% acetonitrile, 0.1% TFA, 0.1% formic acid). We collected 5 elutions and the presence of biotin-tagged peptides in each elution was assessed before MS analysis by biotin detection in solution using a sensitive quantitation kit (Pierce). This analysis demonstrated a correlation between biotin content in the peptide samples and subsequent detection of biotin-modified peptides by MudPIT (Figure 2b). We required peptides to have less than a 5 ppm deviation from the peptide match, resulting in a peptide false discovery rate < 0.5%. We detected 10 715 biotin-modified peptides corresponding to 2185 proteins using MudPIT analysis and only 4 unmodified peptides corresponding to 4 proteins (Figure 2b). The large enrichment of biotinylated peptides and thus the high confidence in the biotinylated protein identifications with DiDBiT is analogous to use of phosphopeptide enrichment strategies to identify phosphoproteins.
Figure 2.
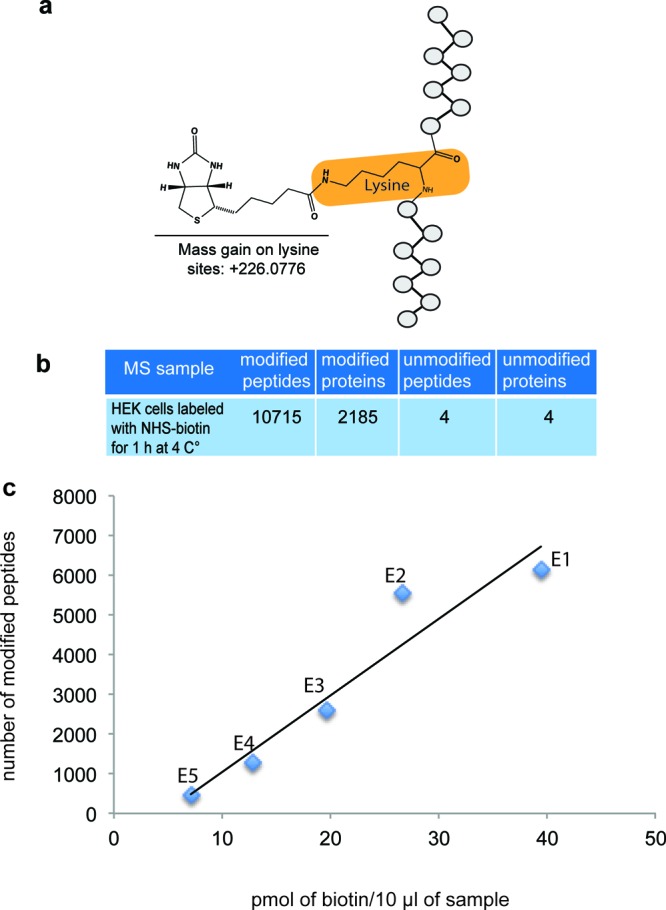
Application of DiDBiT to identify labeled peptides from HEK cells labeled with NHS-biotin. (a) Schematic of the modification on lysines adding a mass of 226.0776 given by NHS-biotin. (b) HEK cells were exposed to NHS-biotin for 1 h at 4 °C. Starting from 10 mg of cell lysate, we identified 10 715 biotin-modified peptides corresponding to 2185 proteins using MudPIT. Unmodified peptides were negligible, indicative of the efficient enrichment DiDBiT provides. (c) Measurements of biotin content in aliquots from peptide NeutrAvidin bead elutions (E1–E5) serve as quality control for MS sample preparation. The biotin content in E1–E5 correlates with the number of biotin-modified peptides detected by MudPIT for each elution. Biotin measurements and MS were done in five sequential 300 μL elution fractions (E1–E5) collected from NeutrAvidin beads. Biotin was assayed in a 1/100 aliquot of each elution. We were able to detect a considerable number of modified peptides in samples with a concentration of biotin above 10–15 pmol/10 μL of sample.
Comparison of DiDBiT with Conventional Methods to Identify NHS-Biotin-Labeled Proteins
We compared DiDBiT to conventional methods by performing a series of single reverse-phase analyses using HEK 293T cells labeled for 1 h with membrane permeable NHS-biotin. The starting material for each method was 6 mg of protein cell lysate. The DiDBiT strategy identified 3777 biotinylated peptides, while the protein elution (output 3A, Figures 1 and 3a) and on-bead digestion (output 3Ai in Figures 1 and 3a) methods identified 20 and 6 biotinylated peptides, respectively (Figure 3a). More than 95% of the peptides identified with the conventional methods were unmodified, whereas less than 15% of peptides identified by DiDBiT were unmodified. DiDBiT resulted in the identification of a total of 1536 proteins, of which 78% were biotinylated and therefore true hits. By contrast, protein enrichment followed by elution and digestion resulted in identification of 454 proteins, of which 16 (less than 4%) were biotinylated, and the on-bead digestion method resulted in identification of 198 proteins of which 4 (2%) were biotinylated. These data suggest that DiDBiT dramatically increases the identification of true hits based on direct detection of biotin-tagged peptides, and also increases identification of total proteins in the sample compared to conventional methods (see also Figure 3b and c). In the on-bead digestion method, one would expect that the biotin-modified fragments of the proteins remain attached to NeutrAvidin beads after trypsinization. We tested whether the stringent elution buffer used in the DiDBiT protocol would release bound biotinylated peptides from the beads after the digestion (Figure 1, output 3Aii; Figure 3a, “on-bead digestion release 2”). Interestingly, this approach has not been reported in previous studies for MS analysis of biotinylated protein enrichment. Elution of bound peptides after the on-bead digestion resulted in identification of 293 modified peptides, corresponding to 144 modified proteins, significantly more than the modified peptides recovered from the traditional on-bead digestion method. Despite this improved identification of direct biotin-modified proteins, only ∼40% of the peptides identified in the elution were biotin-labeled, compared with greater than 85% using DiDBiT.
A potential advantage of direct detection of biotin-labeled peptides with DiDBiT is the greater confidence of identifying biotinylated proteins in a complex sample, since proteins identified by conventional methods could include contaminants. One way to address this is to determine the overlap between the proteins identified by conventional methods and those identified by DiDBiT. We compared the biotin-labeled proteins identified directly by DiDBiT with the unmodified proteins identified by the conventional methods. For both the protein enrichment and elution method and the on-bead digestion method, more than 60% of the proteins identified by unmodified peptides were also identified by biotinylated peptides in the DiDBiT analysis, and are therefore validated as true hits (Figure 3b–d). The Venn diagrams demonstrate that these traditional methods do indeed identify bona fide biotinylated proteins from unmodified peptides but it is impossible to distinguish them from contaminant proteins without further experimentation. The more striking observation is that only ∼30% of the biotin-labeled proteins identified by DiDBiT were identified by the conventional methods. Finally, the number of peptides identified per protein was similar between all three methods, which suggests that similar coverage per protein was obtained using DiDBiT and the other two methods (Figure 3e). These data suggest that conventional methods generate samples that are predominantly unmodified peptides, which, due to the limited dynamic range of the mass spectrometers, prevent the identification of the modified peptides.
The results presented above suggest that DiDBiT has increased sensitivity in identifying proteins compared to conventional methods (Figures 2 and 3). To address this more directly, we tested if DiDBiT could identify an adequate number of biotinylated peptides for protein identification in samples with 1, 3, and 6 mg of protein lysate starting material. Comparable numbers of biotin-modified peptides were identified with 3 and 6 mg of starting material (3566 and 3777 peptides, respectively), resulting in identification of comparable numbers of biotin-modified proteins (1077 and 1210 proteins, respectively; Table 1). By contrast, starting with 1 mg of protein lysate resulted in a large decrease in identification of modified peptides, but still more biotinylated peptides (378) and proteins (184) were identified with 1 mg starting material using DiDBiT than with 6 mg of starting material using other methods (Figure 3a). Use of more sensitive peptide separation techniques, such as MudPIT analysis instead of single reverse-phase separation, would further improve the identification of biotin-labeled peptides in samples with limited starting material. To demonstrate this, the comparison between DiDBiT and on-bead digestion was repeated using MudPIT analysis. DiDBiT identified 16 367 modified peptides (3422 proteins) and 216 unmodified peptides (216 proteins) while on-bead digestion identified 161 modified peptides (103 proteins) and 5030 unmodified peptides (1974 proteins) (see Supporting Information tables for peptide lists). Although MudPIT increased the number of modified peptides detected in both strategies compared to single reverse-phase analysis, DiDBIT still identified 100× more modified peptides and 10× more proteins (see comparison in Supporting Information Table 2). It is interesting that DiDBiT increased the total number of peptides recovered and the number of protein identifications compared to the other methods. One possibility for this increase is that in the traditional methods the unmodified peptides from abundant proteins are preventing the identification of peptides from lower abundant proteins due to the limited dynamic range of the mass spectrometer. It is also possible that in the traditional methods the large proteins block other proteins from binding to the neutravidin beads, while the much smaller modified peptides do not interfere with other peptides binding to the beads. It seems likely that the stringent peptide elution buffer may account for the greater number of peptides and proteins identified by DiDBIT. The peptide elution buffer contains 80% acetonitrile, which is not applicable for protein elution because it would precipitate the proteins. Overall, these results demonstrate that DiDBiT allows efficient identification of biotin-labeled proteins based on optimized enrichment of biotin-tagged peptides and their direct detection by MS.
Table 1. Yield of DiDBiT Protocol for Different Amounts of Starting Materiala.
| input protein lysate from NHS-biotin labeled cells | modified peptides | modified proteins |
|---|---|---|
| 6 mg | 3777 | 1210 |
| 3 mg | 3566 | 1077 |
| 1 mg | 378 | 184 |
HEK cells were labeled with NHS-biotin for 1 h at 4 °C.
Application of DiDBiT to Identify Newly Synthesized Proteins in HEK Cells
We investigated the flexibility and sensitivity of DiDBiT to detect other biotin tags of lower abundance within a complex mixture of proteins by identifying newly synthesized proteins using the noncanonical amino acid, l-homoazidoalanine (AHA). AHA is incorporated into proteins in place of methionine during protein synthesis, and biotin alkyne is covalently bound to the azide group in AHA by an in vitro click reaction. Since methionine occurs with much lower frequency than lysine, this assay further tested the sensitivity of DiDBiT compared to analysis of the NHS-biotin labeled samples, above. HEK cell cultures were briefly incubated in methionine-free media to deplete cells of endogenous methionine (Supporting Information Figure 1b) and then incubated with 4 mM AHA for 1 h. Starting from 10 mg of protein lysate, we tagged the AHA labeled proteins with biotin-alkyne using click chemistry as described in the Experimental Procedures section. Using Cu2+/TCEP and TBTA in tert-butanol/DMSO9,17 maximized efficiency of the cycloaddition reaction that incorporates the biotin tag into AHA-labeled proteins and resulted in a greater degree of labeling than with the previously published CuBr-based method16 (Supporting Information Figure 1a). After biotinylation, precipitated proteins were trypsinized and the resulting peptides were incubated with NeutrAvidin beads. Peptides were eluted from the NeutrAvidin beads and evaluated for biotin label before MS analysis using the biotin quantitation kit, mentioned above. Peptides were detected by searching for a mass addition of 523.2749 on methionine corresponding to the AHA-biotin modification (Figure 4a). Using MudPIT analysis, we detected 4217 biotin-AHA-modified peptides corresponding to 1817 newly synthesized proteins in the elutions. We detected ∼700 unmodified peptides, corresponding to 345 proteins. We also analyzed the peptides that were not bound to the NeutrAvidin beads (i.e the flow-through). None of the peptides in the flow through were biotin-modified. By contrast, MudPIT detected 11306 unmodified peptides corresponding to 3184 proteins in the flow through.
To our knowledge, this analysis reveals the largest reported number of newly synthesized proteins identified based on detection of AHA-modified peptides.19,21,22,40 To evaluate the proteins in human cells that are newly synthesized within 1 h, we determined their cellular distribution (Figure 4c). AHA-labeled proteins are distributed throughout the cell in all major organelles. These results demonstrate the efficient enrichment of biotin-modified peptides and the resultant capacity of MudPIT to identify modified peptides under conditions in which the population of biotin-labeled proteins is relatively less abundant.
Comparison of DiDBiT with Conventional Methods to Identify Newly Synthesized Proteins
We compared DiDBiT with the on-bead digestion method for the detection of AHA-labeled proteins (Figure 4d). Twelve milligrams of AHA-labeled HEK cell proteins were biotinylated by click chemistry and then split into two 6 mg samples for analysis using DidBiT or on-bead digestion. The resulting peptides were analyzed by single reverse-phase analysis. With DiDBiT we identified 628 modified peptides corresponding to 345 modified proteins. No biotin-modified peptides were detected in the sample prepared with the conventional on-bead digestion method. When we eluted the peptides from the NeutrAvidin beads after the on-bead digestion with the stringent buffer used in the DiDBiT protocol, we detected 27 biotin-modified peptides corresponding to 17 biotin-labeled proteins. Although this extra elution step did identify true hits as AHA-biotin modified proteins, as seen above, they were less than 5% of the AHA biotin-labeled proteins identified with DiDBiT, consistent with the increased sensitivity of DiDBiT shown above.
Both DiDBiT and the on-bead digestion methods identified proportionately more unmodified peptides from the AHA-labeled samples compared to the NHS-biotin labeled samples (Figures 3a and 4d). We speculate that this is because the AHA-biotin labeled proteins are much less abundant in the sample, resulting in more contaminating proteins. AHA-labeled proteins also have lower protein sequence coverage than NHS-biotin labeled proteins because AHA, which is incorporated in place of methionine, is much less common in tryptic peptides and in the vertebrate proteome than lysines which are tagged with NHS-biotin. Of the 345 AHA-biotin labeled proteins identified with DiDBiT (Figure 4d), 163 (less than 50%) were also detected in the sample prepared with the traditional on-bead digestion method (Figure 4e). Although one cannot conclude that the proteins identified by on-bead digestion are AHA labeled newly synthesized proteins without direct detection of the biotin tag, we were able to use this set of proteins to compare the coverage of proteins identified from DiDBiT and on-bead digestion. DiDBiT identified 379 AHA-biotin labeled peptides from these 163 overlapping proteins, while the on-bead digestion identified 826 unmodified peptides. Plotting the peptides per protein identification for DiDBiT and on bead digestion shows that requiring the identification of the modified methionine in DiDBiT reduces protein sequence coverage (Figure 4g) but increases the sensitivity of AHA-biotin labeled peptide detection. It is possible that combining DiDBiT detection of modified peptides with analysis of flow-through could increase the confidence of identifying biotinylated proteins by increasing the sequence coverage. Overall, these data suggest that when the subpopulation of targeted candidates is of low abundance, contamination by unlabeled peptides increases. With the on-bead digestion method, this results in an increase in the false positive rate of protein identification, demonstrating the greater importance of direct identification of the biotin modification on the peptides with DiDBiT.
DiDBiT Detection of Newly Synthesized Proteins in Adult Rat Retina in Vivo
We next tested whether the DiDBiT strategy allows efficient and reliable detection of newly synthesized proteins in vivo. Our goal was to establish a system that allows high temporal resolution to obtain meaningful information about protein populations that incorporate AHA during in vivo protein translation over short time periods. We chose to study newly synthesized proteins in neuronal tissue in vivo using intraocular administration of AHA to label newly synthesized proteins in the eye and in particular the retina. In vivo AHA labeling is very challenging due to competition between AHA and endogenous methionine (Supporting Information Figure 1b). In preliminary experiments, we tested several concentrations of AHA injected into the eye and several labeling protocols. The retinal tissue was harvested and processed to tag the AHA labeled proteins with biotin-alkyne using click chemistry. We used Western blots to evaluate biotin-AHA incorporation into newly synthesized proteins. Intraocular administration of low doses of AHA (14 μg/kg in each eye) once a day for 3 days was not sufficient to obtain detectable incorporation of AHA to proteins (Figure 5a,b). Increasing AHA doses to 1.4 mg/kg per eye per day over 3 days overcame the competition with endogenous methionine and resulted in detectable protein labeling (Figure 5a). In further experiments to test more acute AHA exposure periods, we observed that AHA incorporation into proteins could be achieved over shorter times after administration of 1.4 mg/kg AHA (Figure 6a).
Figure 5.
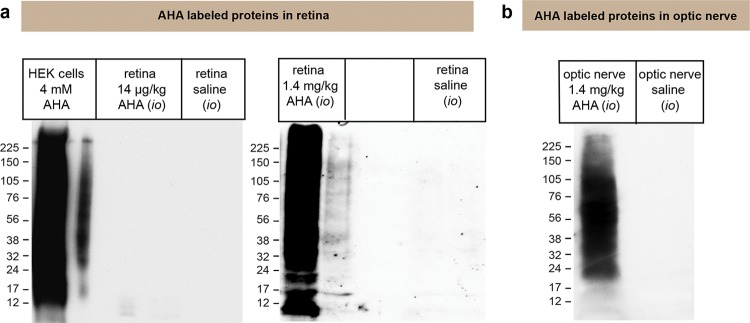
Optimizing incorporation of AHA into proteins in vitro and in vivo. Detection of AHA-biotin labeled proteins was done by Western blots with antibiotin antibody. Rats were injected intraocularly (i.o.) with 5 μL of 4 mM AHA and 400 mM AHA (doses of 1.4 μg/kg and 1.4 mg/kg, respectively) or saline. Administration was done once a day over 3 days, and rats were sacrificed 24 h after the last injection. Both eyes were dissected and processed for click chemistry to tag AHA-labeled proteins with biotin. Western blots to detect AHA-biotin-labeled retinal proteins show that a dose of 1.4 mg/kg AHA into the eye results in extensive incorporation of AHA into retinal proteins, whereas injections of 1.4 μg/kg AHA do not label retinal proteins. As a positive control, we included a protein lysate from HEK cell labeled with 4 mM AHA for 1 h to make sure that the click reaction and reagents were working, and lack of labeling of retinal samples from animals injected 1.4 μg/kg was due to lack of AHA biotinylation. (c) AHA-biotin labeled proteins were detected in an extract of the optic nerve after intravitreal injection of 1.4 mg/kg AHA but not saline. These data indicate that retina ganglion cells (RGCs) incorporate AHA and labeled proteins are transported down their axons in the optic nerve.
Figure 6.

DiDBiT detection of newly synthesized proteins in adult rat retina in vivo. (a) Upper panel: Protocols for intraocular AHA injections to evaluate the temporal resolution of in vivo AHA labeling to detect de novo protein synthesis in the retina. Adult rats received intravitreal AHA injections and retinas were collected after 3 h (labeled “AHA 3 h sample”). Another group of animals received two intravitreal AHA injections 21 h apart and were sacrificed 3 h after the second injection (labeled “AHA 24 h sample”). AHA-labeled proteins were biotinylated by click chemistry and analyzed using DiDBiT. (a) Center and lower panels: Western blots and quantification of AHA-biotin labeled retinal proteins after click reaction with biotin-alkyne. More AHA-biotin labeled proteins are detected after 24 h of AHA labeling compared to 3 h. No biotin label is detected in samples from control animals after intravitreal injection of saline. (b) Biotin measurements (left panels) and MS detection of biotin-modified peptides (right panels) from sequential NeurAvidin elutions (E1–E3) of peptides from in vivo AHA labeling of newly synthesized proteins in the retina, analyzed by MudPIT. In the AHA 3 h sample, only E1 had sufficient biotin content to warrant MS analyses, whereas the two first elutions (E1 and E2) from the AHA 24 h sample group had sufficient biotin for MS analysis. (c) Numbers of modified and unmodified peptides and proteins from the 3 and 24 h retinal AHA samples. More unmodified proteins were detected in the 24 h AHA retina sample than the 3 h AHA retina sample because the sample was the combination of E1 and E2, both of which include unmodified and modified proteins. (d) Venn diagram showing numbers and overlap of newly synthesized proteins based on direct detection of AHA-biotin modified peptides after 3 and 24 h of AHA labeling. The majority (78%) of newly synthesized retinal proteins detected after the 3 h AHA labeling period were also detected after 24 h of AHA labeling. (e) Distribution of AHA-biotin labeled peptides and corresponding proteins in cellular compartments from the AHA 3 h sample. The 24 h labeling group resulted in the same cellular distribution of newly synthesized proteins (see Supporting Information Table 1).
DiDBiT analysis was performed after two different AHA exposure protocols and the outcomes were compared to determine the sensitivity of detection of newly synthesized protein in vivo. In one protocol, eyes of adult rats were injected once with AHA and the retinas were harvested after 3 h. In the second protocol, eyes were injected twice with AHA, and spaced 20 h apart, and the retinas were harvested 24 h after the first injection (Figure 6a, upper panel). Control animals received saline injections. The retinal tissue was processed to tag the AHA labeled proteins with biotin-alkyne using click chemistry, as described above. Western blots of AHA-biotin labeled proteins prior to trypsin digestion show detectable AHA-biotin labeling in retina after 3h and a further increase in AHA-biotin labeling after 24 h, whereas Westerns of saline-injected retinal proteins have no biotin label (Figure 6a, center and lower panels). After the proteins were digested and enriched on NeutrAvidin beads, we used biotin assays of the eluted peptide solution to evaluate the AHA-biotin labeling in the peptide sample before MudPIT analysis (Figure 6 b). The biotin assays show detectable biotin in the first elution of the 3 h retina sample and in the first and second elutions in the 24 h sample, consistent with the increased biotin labeling seen on the Western blot. Samples with sufficient biotin content were analyzed on a LTQ-Orbitrap mass spectrometer. These assays serve as valuable assessments of the AHA-biotin labeling success at intermediate points in the protocol prior to MS. MudPIT analysis revealed 1042 AHA-biotin modified peptides corresponding to 618 proteins with the 3 h AHA labeling period demonstrating the capacity for robust detection of proteins that are translated within a short temporal window in vivo (Figure 6c). We detected 2452 AHA-biotin modified peptides corresponding to 1149 proteins in retinas that received two AHA injections over 24 h (Figure 6c). The majority (78%) of proteins detected with the 3 h labeling interval were also detected with the 24 h AHA-labeling protocol (Figure 6d). On the other hand, 58% of the proteins detected in the 24 h group were not detected with 3 h labeling protocol. These proteins might be synthesized at a lower rate and require the longer AHA exposure period to accumulate detectable amounts of labeled protein. Alternatively, these proteins may be translated from less abundant mRNAs and the longer window is required to reach the threshold of detection of the mass spectrometer. Eighty percent of the proteins identified only in the 3 h AHA labeling sample were identified by 1 spectral count, suggesting these are very low abundance proteins which have a low probability of being identified by the mass spectrometer41 (Table 2). We observed an increase in abundance of modified proteins in the 24 h AHA labeling sample, which is expected given that longer exposure to AHA allows accumulation of newly synthesized proteins (Table 2). These results show that MS analysis using DiDBiT allows the direct detection of newly synthesized biotin-tagged proteins so that dynamic in vivo changes in the proteome can be investigated. This level of detection in vivo has not yet been achieved by other methods, including colabeling strategies with stable isotope-labeled amino acids (such as SILAC) and AHA, which have recently been reported to work well in vitro.18,21,40
Table 2. AHA-Biotin Modified Proteins Identified in the 3 h or 24 h AHA Labeling Categorized by Spectra Counta.
| spectra count per protein | % distribution of proteins in sample with the 3 h AHA labeling treatment | % distribution of proteins in sample with the 24 h AHA labeling treatment |
|---|---|---|
| 1 | 80% | 49% |
| 2–5 | 18% | 41% |
| 6–10 | 1% | 6% |
| 11–15 | 0% | 1% |
| >15 | 0% | 2% |
Spectra count correlates with protein abundance.
Conclusion
In summary, we describe DiDBiT, a flexible high-resolution strategy to analyze biotin-labeled proteins, which is applicable to a broad range of labeling strategies and preparations. Traditional strategies used for proteomic analysis of biotin-labeled proteins frequently fail to identify biotin-modified peptides, resulting in ambiguity between bona fide biotin-labeled proteins and contaminant proteins present in the sample. DiDBiT improves MS analysis of biotin-labeled proteins by enriching for the biotin tag on peptides instead of the protein (Figure 7). In this manner, we were able increase the detection of biotin-modified peptides up to 200-fold compared to traditional protein enrichment based methods. This high level of biotin detection simplifies the discrimination of real candidates from contaminants. There is a large variety of biotin tags available, and we demonstrated the flexibility of DiDBiT by examining two biotin labeling protocols: NHS-biotin and bioorthogonal labeling with AHA. An immediate application of DiDBiT, which we demonstrated here, is in the study of newly synthesized proteins in vitro and in vivo. This enhanced sensitivity provided by DiDBiT enables increased temporal and spatial resolution in the identification of biotin-labeled proteins, as well the investigation of synthesis of lower abundance proteins.
Figure 7.

Step by step protocol for DiDBIT. Flow diagram of sample preparation of biotinylated peptides for mass spectrometry starting from different labeling strategies that target subpopulations of proteins: NHS-biotin, which binds exposed lysines on pre-existing proteins, or AHA, which is incorporated into newly synthesized proteins in place of methionine.
We expect that this methodology can be extended to enhance the coverage and confidence in the identification of candidate protein subpopulations based on other labeling protocols, in particular, to dissect organelle proteomes or analyze protein–protein interactions using methods that spatially restrict enzymatic biotinylation tagging,13,14 to track transport and distribution of proteins in animals under pathological conditions,28,39 and to study protein synthesis and turnover in intact animals. Combining this methodology with cell type specific protein labeling20,42 will offer a valuable tool to dissect proteome dynamics in different cell populations in complex organs such us the nervous system. Finally, by demonstrating the robustness of our method for in vivo applications, in this report and a recent study,43 we show for the first time the direct detection of biotinylated labeled in intact animals after a short pulse of AHA labeling. DiDBiT allows the study of newly synthesized proteins within a time frame as short as 3 h.
Acknowledgments
We thank J. Hulce and B. Cravatt for advice on click chemistry and members of the Cline Lab for helpful discussions. This work was supported by the U.S. National Institutes of Health (MH091676, MH099799, and OD000458 to H.T.C.; MH067880 and P41 GM103533 to J.R.Y.,III), The Hahn Family Foundation to H.T.C., and UCLA/NHLBI Proteomics Centers HHSN268201000035C to J.R.Y.,III.
Supporting Information Available
Supplementary Table 1: Table showing the subcellular distribution of retinal AHA-biotin modified proteins labeled in vivo. Supplementary Table 2: Table showing the comparison between DiDBIT and on-bead digestion using a single reverse-phase or MudPIT separation techniques before MS analysis. Supplementary Tables 3–30: Excel file with lists of NHS-biotin-modified, AHA-biotin modified, and unmodified proteins (Tables S3–30) in different spreadsheets. Supplementary Figure 1: Westerns blots showing the optimization results of copper-catalyzed azide–alkyne cycloaddition to tag AHA-labeled proteins with biotin-alkyne. This material is available free of charge via the Internet at http://pubs.acs.org.
Author Contributions
∥ L.M.S. and D.B.M. contributed equally.
The authors declare no competing financial interest.
Funding Statement
National Institutes of Health, United States
Supplementary Material
References
- Conn E. M.; Madsen M. A.; Cravatt B. F.; Ruf W.; Deryugina E. I.; Quigley J. P. Cell surface proteomics identifies molecules functionally linked to tumor cell intravasation. J. Biol. Chem. 2008, 2833926518–26527. [DOI] [PMC free article] [PubMed] [Google Scholar]
- Fernandez-Suarez M.; Chen T. S.; Ting A. Y. Protein–protein interaction detection in vitro and in cells by proximity biotinylation. J. Am. Chem. Soc. 2008, 130299251–9253. [DOI] [PMC free article] [PubMed] [Google Scholar]
- Liu D. S.; Loh K. H.; Lam S. S.; White K. A.; Ting A. Y. Imaging trans-cellular neurexin-neuroligin interactions by enzymatic probe ligation. PLoS One 2013, 82e52823. [DOI] [PMC free article] [PubMed] [Google Scholar]
- Roesli C.; Fugmann T.; Borgia B.; Schliemann C.; Neri D.; Jucker M. The accessible cerebral vascular proteome in a mouse model of cerebral beta-amyloidosis. J. Proteomics 2011, 744539–546. [DOI] [PubMed] [Google Scholar]
- Roesli C.; Neri D.; Rybak J. N. In vivo protein biotinylation and sample preparation for the proteomic identification of organ- and disease-specific antigens accessible from the vasculature. Nat. Protoc. 2006, 11192–199. [DOI] [PubMed] [Google Scholar]
- Sugiyama S.; Di Nardo A. A.; Aizawa S.; Matsuo I.; Volovitch M.; Prochiantz A.; Hensch T. K. Experience-dependent transfer of Otx2 homeoprotein into the visual cortex activates postnatal plasticity. Cell 2008, 1343508–520. [DOI] [PubMed] [Google Scholar]
- Li H. H.; Huang Z. Y.; Ye S. P.; Lu C. Y.; Cheng P. C.; Chen S. H.; Chen C. S. Membrane labeling of coral gastrodermal cells by biotinylation: the proteomic identification of surface proteins involving cnidaria-dinoflagellate endosymbiosis. PLoS One 2014, 91e85119. [DOI] [PMC free article] [PubMed] [Google Scholar]
- Li N.; Kuo C. L.; Paniagua G.; van den Elst H.; Verdoes M.; Willems L. I.; van der Linden W. A.; Ruben M.; van Genderen E.; Gubbens J.; van Wezel G. P.; Overkleeft H. S.; Florea B. I. Relative quantification of proteasome activity by activity-based protein profiling and LC-MS/MS. Nat. Protoc. 2013, 861155–1168. [DOI] [PubMed] [Google Scholar]
- Hulce J. J.; Cognetta A. B.; Niphakis M. J.; Tully S. E.; Cravatt B. F. Proteome-wide mapping of cholesterol-interacting proteins in mammalian cells. Nat. Methods 2013, 103259–264. [DOI] [PMC free article] [PubMed] [Google Scholar]
- Roesli C.; Borgia B.; Schliemann C.; Gunthert M.; Wunderli-Allenspach H.; Giavazzi R.; Neri D. Comparative analysis of the membrane proteome of closely related metastatic and nonmetastatic tumor cells. Cancer Res. 2009, 69135406–5414. [DOI] [PubMed] [Google Scholar]
- Weekes M. P.; Antrobus R.; Lill J. R.; Duncan L. M.; Hor S.; Lehner P. J. Comparative analysis of techniques to purify plasma membrane proteins. J. Biomol. Tech. 2010, 213108–115. [PMC free article] [PubMed] [Google Scholar]
- Ehlers M. D. Reinsertion or degradation of AMPA receptors determined by activity-dependent endocytic sorting. Neuron 2000, 282511–525. [DOI] [PubMed] [Google Scholar]
- Rhee H. W.; Zou P.; Udeshi N. D.; Martell J. D.; Mootha V. K.; Carr S. A.; Ting A. Y. Proteomic mapping of mitochondria in living cells via spatially restricted enzymatic tagging. Science 2013, 33961251328–1331. [DOI] [PMC free article] [PubMed] [Google Scholar]
- Roux K. J.; Kim D. I.; Raida M.; Burke B. A promiscuous biotin ligase fusion protein identifies proximal and interacting proteins in mammalian cells. J. Cell Biol. 2012, 1966801–810. [DOI] [PMC free article] [PubMed] [Google Scholar]
- Best M. D. Click chemistry and bioorthogonal reactions: unprecedented selectivity in the labeling of biological molecules. Biochemistry 2009, 48286571–6584. [DOI] [PubMed] [Google Scholar]
- Dieterich D. C.; Lee J. J.; Link A. J.; Graumann J.; Tirrell D. A.; Schuman E. M. Labeling, detection and identification of newly synthesized proteomes with bioorthogonal non-canonical amino-acid tagging. Nat. Protoc. 2007, 23532–540. [DOI] [PubMed] [Google Scholar]
- Speers A. E.; Cravatt B. F. Activity-Based Protein Profiling (ABPP) and Click Chemistry (CC)-ABPP by MudPIT Mass Spectrometry. Curr. Protoc. Chem. Biol. 2009, 1, 29–41. [DOI] [PMC free article] [PubMed] [Google Scholar]
- Eichelbaum K.; Winter M.; Diaz M. B.; Herzig S.; Krijgsveld J. Selective enrichment of newly synthesized proteins for quantitative secretome analysis. Nat. Biotechnol. 2012, 3010984–990. [DOI] [PubMed] [Google Scholar]
- Dieterich D. C.; Link A. J.; Graumann J.; Tirrell D. A.; Schuman E. M. Selective identification of newly synthesized proteins in mammalian cells using bioorthogonal noncanonical amino acid tagging (BONCAT). Proc. Natl. Acad. Sci. U.S.A. 2006, 103259482–9487. [DOI] [PMC free article] [PubMed] [Google Scholar]
- Ngo J. T.; Schuman E. M.; Tirrell D. A. Mutant methionyl-tRNA synthetase from bacteria enables site-selective N-terminal labeling of proteins expressed in mammalian cells. Proc. Natl. Acad. Sci. U.S.A. 2013, 110134992–4997. [DOI] [PMC free article] [PubMed] [Google Scholar]
- Howden A. J.; Geoghegan V.; Katsch K.; Efstathiou G.; Bhushan B.; Boutureira O.; Thomas B.; Trudgian D. C.; Kessler B. M.; Dieterich D. C.; Davis B. G.; Acuto O. QuaNCAT: Quantitating proteome dynamics in primary cells. Nat. Methods 2013, 104343–346. [DOI] [PMC free article] [PubMed] [Google Scholar]
- Hodas J. J.; Nehring A.; Hoche N.; Sweredoski M. J.; Pielot R.; Hess S.; Tirrell D. A.; Dieterich D. C.; Schuman E. M. Dopaminergic modulation of the hippocampal neuropil proteome identified by bioorthogonal noncanonical amino acid tagging (BONCAT). Proteomics 2012, 1215–162464–2476. [DOI] [PMC free article] [PubMed] [Google Scholar]
- Konzer A.; Ruhs A.; Braun H.; Jungblut B.; Braun T.; Kruger M. Stable isotope labeling in zebrafish allows in vivo monitoring of cardiac morphogenesis. Mol. Cell Proteomics 2013, 1261502–1512. [DOI] [PMC free article] [PubMed] [Google Scholar]
- Pfeiffenberger C.; Cutforth T.; Woods G.; Yamada J.; Renteria R. C.; Copenhagen D. R.; Flanagan J. G.; Feldheim D. A. Ephrin-As and neural activity are required for eye-specific patterning during retinogeniculate mapping. Nat. Neurosci. 2005, 881022–1027. [DOI] [PMC free article] [PubMed] [Google Scholar]
- Dureau P.; Bonnel S.; Menasche M.; Dufier J. L.; Abitbol M. Quantitative analysis of intravitreal injections in the rat. Curr. Eye Res. 2001, 22174–77. [DOI] [PubMed] [Google Scholar]
- Wu C. C.; MacCoss M. J.; Howell K. E.; Yates J. R. 3rd. A method for the comprehensive proteomic analysis of membrane proteins. Nat. Biotechnol. 2003, 215532–538. [DOI] [PubMed] [Google Scholar]
- Villen J.; Gygi S. P. The SCX/IMAC enrichment approach for global phosphorylation analysis by mass spectrometry. Nat. Protoc. 2008, 3101630–1638. [DOI] [PMC free article] [PubMed] [Google Scholar]
- Borgia B.; Roesli C.; Fugmann T.; Schliemann C.; Cesca M.; Neri D.; Giavazzi R. A proteomic approach for the identification of vascular markers of liver metastasis. Cancer Res. 2010, 701309–318. [DOI] [PubMed] [Google Scholar]
- Khare T.; Giometti C. S. Differential recovery of biotinylated microbial proteins using monomeric or polymeric avidin. Biotechniques 2006, 405584, 586, 588. [DOI] [PubMed] [Google Scholar]
- Dall’Agnol M.; Bernstein C.; Bernstein H.; Garewal H.; Payne C. M. Identification of S-nitrosylated proteins after chronic exposure of colon epithelial cells to deoxycholate. Proteomics 2006, 651654–1662. [DOI] [PubMed] [Google Scholar]
- Choi K. Y.; Lippert D. N.; Ezzatti P.; Mookherjee N. Defining TNF-alpha and IL-1beta induced nascent proteins: combining bio-orthogonal non-canonical amino acid tagging and proteomics. J. Immunol. Methods 2012, 3821–2189–195. [DOI] [PubMed] [Google Scholar]
- Washburn M. P.; Wolters D.; Yates J. R. 3rd Large-scale analysis of the yeast proteome by multidimensional protein identification technology. Nat. Biotechnol. 2001, 193242–247. [DOI] [PubMed] [Google Scholar]
- Xu T.; Venable J. D.; Park S. K.; Cociorva D.; Lu B.; Liao L.; Wohlschlegel J.; Hewel J.; Yates J. R. ProLuCID, a fast and sensitive tandem mass spectra-based protein identification program. Mol. Cell. Proteomics 2006, 510S174. [Google Scholar]
- Peng J.; Elias J. E.; Thoreen C. C.; Licklider L. J.; Gygi S. P. Evaluation of multidimensional chromatography coupled with tandem mass spectrometry (LC/LC-MS/MS) for large-scale protein analysis: the yeast proteome. J. Proteome Res. 2003, 2143–50. [DOI] [PubMed] [Google Scholar]
- Sadygov R. G.; Eng J.; Durr E.; Saraf A.; McDonald H.; MacCoss M. J.; Yates J. R. 3rd. Code developments to improve the efficiency of automated MS/MS spectra interpretation. J. Proteome Res. 2002, 13211–215. [DOI] [PubMed] [Google Scholar]
- Cociorva D.; Tabb D. L.; Yates J. R. Validation of tandem mass spectrometry database search results using DTASelect. Curr. Protoc. Bioinf. 2007, 10.1002/0471250953.bi1304s16. [DOI] [PubMed] [Google Scholar]
- Tabb D. L.; McDonald W. H.; Yates J. R. 3rd DTASelect and Contrast: tools for assembling and comparing protein identifications from shotgun proteomics. J. Proteome Res. 2002, 1121–26. [DOI] [PMC free article] [PubMed] [Google Scholar]
- Bhatia V. N.; Perlman D. H.; Costello C. E.; McComb M. E. Software tool for researching annotations of proteins: open-source protein annotation software with data visualization. Anal. Chem. 2009, 81239819–9823. [DOI] [PMC free article] [PubMed] [Google Scholar]
- Schliemann C.; Roesli C.; Kamada H.; Borgia B.; Fugmann T.; Klapper W.; Neri D. In vivo biotinylation of the vasculature in B-cell lymphoma identifies BST-2 as a target for antibody-based therapy. Blood 2010, 1153736–744. [DOI] [PubMed] [Google Scholar]
- Cohen L. D.; Zuchman R.; Sorokina O.; Muller A.; Dieterich D. C.; Armstrong J. D.; Ziv T.; Ziv N. E. Metabolic turnover of synaptic proteins: kinetics, interdependencies and implications for synaptic maintenance. PLoS One 2013, 85e63191. [DOI] [PMC free article] [PubMed] [Google Scholar]
- Liu H.; Sadygov R. G.; Yates J. R. 3rd. A model for random sampling and estimation of relative protein abundance in shotgun proteomics. Anal. Chem. 2004, 76144193–4201. [DOI] [PubMed] [Google Scholar]
- Ngo J. T.; Champion J. A.; Mahdavi A.; Tanrikulu I. C.; Beatty K. E.; Connor R. E.; Yoo T. H.; Dieterich D. C.; Schuman E. M.; Tirrell D. A. Cell-selective metabolic labeling of proteins. Nat. Chem. Biol. 2009, 510715–717. [DOI] [PMC free article] [PubMed] [Google Scholar]
- Shen W.; Liu H. H.; Schiapparelli L.; McClatchy D.; He H. Y.; Yates J. R.; Cline H. T. Acute Synthesis of CPEB Is Required for Plasticity of Visual Avoidance Behavior in Xenopus. Cell Rep. 2014, 64737–747. [DOI] [PMC free article] [PubMed] [Google Scholar]
Associated Data
This section collects any data citations, data availability statements, or supplementary materials included in this article.