

Abstract
Stable isotope labeling is widely used to encode and quantify proteins in mass-spectrometry-based proteomics. We compared metabolic labeling with stable isotope labeling by amino acids in cell culture (SILAC) and chemical labeling by stable isotope dimethyl labeling and find that they have comparable accuracy and quantitative dynamic range in unfractionated proteome analyses and affinity pull-down experiments. Analyzing SILAC- and dimethyl-labeled samples together in single liquid chromatography–mass spectrometric analyses minimizes differences under analytical conditions, allowing comparisons of quantitative errors introduced during sample processing. We find that SILAC is more reproducible than dimethyl labeling. Because proteins from metabolically labeled populations can be combined before proteolytic digestion, SILAC is particularly suited to studies with extensive sample processing, such as fractionation and enrichment of peptides with post-translational modifications. We compared both methods in pull-down experiments using a kinase inhibitor, dasatinib, and tagged GRB2-SH2 protein as affinity baits. We describe a StageTip dimethyl-labeling protocol that we applied to in-solution and in-gel protein digests. Comparing the impact of post-digest isotopic labeling on quantitative accuracy, we demonstrate how specific experimental designs can benefit most from metabolic labeling approaches like SILAC and situations where chemical labeling by stable isotope-dimethyl labeling can be a practical alternative.
Keywords: SILAC, stable isotope dimethyl labeling, quantitative proteomics, metabolic labeling
Introduction
Over the past decade, mass spectrometry (MS)-based proteomics has become the primary analytical technology to study proteins in complex mixtures. Improvements in nanoscale liquid chromatography coupled to MS (LC–MS) analyses, development of faster and more sensitive MS instrumentation, and identification and quantification of proteins and their post-translational modifications (PTMs) by MS have contributed to the widespread adoption of MS-based proteomics. Quantifying protein abundance in complex mixtures can be achieved with stable isotope labeling or label-free approaches.1,2 Because label-free quantification often requires larger numbers of analytical replicates and depends on highly consistent sample processing,3 stable isotope-labeling approaches are still more widely used in quantitative proteomics studies. The latter allows multiple labeled samples to be combined and analyzed as a single sample, reducing run-to-run variability from sample injection, ionization suppression, or stochastic sampling of complex mixtures by the MS instrument that may differentially impact individual MS runs; such factors, if not addressed by proper experimental design, can negatively affect comparative analyses.
In 1999, Oda et al. used 15N-enriched medium to metabolically label and quantify changes in protein expression and site-specific phosphorylation in yeast.4 Metabolic labeling through the incorporation of stable 13C and 15N enriched amino acids,5−7 particularly arginine and lysine, is especially suited to whole-proteome labeling of live cells, proteolytic digestion with trypsin, and downstream quantification by MS. Because SILAC is a simple and robust method to encode cell populations with quantifiable labels, it has been widely adopted in cell culture systems and has been creatively adapted for use in model organisms such as mice,8 newts,9 worms10 and zebrafish.11 Recent developments include neutron encoding SILAC that uses mass defects of different stable isotopes within the same amino acid to encode multiple cell states and allows higher multiplexing.12 SILAC is known to be a very accurate and precise quantitative method,13 likely because it allows the mixing of differentially labeled samples early in the experimental workflow, reducing variable sample losses from each experimental step. The primary limitation, however, is that SILAC cannot label nondividing cells and human samples and is expensive to apply in small mammals.
Chemical labeling methods target specific reactive groups, such as primary amines, in proteins or peptides to introduce chemical tags encoded with differential masses. Isobaric tagging strategies, including the commercially available iTRAQ14 and TMT15 reagents, are increasingly common because they allow multiplexing of up to 10 samples with high-resolution instruments; the reporter ions generated upon fragmentation are quantified at the MS2 level. While multiplexing has been shown to provide increased sampling depth when compared with an MS1-quantification approach,16 several groups have described compromised quantitative accuracy with isobaric tags in complex mixtures from coisolation and cofragmentation of interfering precursor ions.17−19 Methods to mitigate this effect have been proposed; these involve an additional MS3 scan to obtain quantitative reporter ions and would therefore affect the instrument duty cycle20 or require specialized equipment.21 A practical issue is the high cost of iTRAQ and TMT reagents for labeling milligrams of peptides, as is often required in phosphoproteomics16,22 and studies of substoichiometric protein PTMs.
Stable isotope dimethyl labeling is a chemical labeling method for quantitative proteomics introduced in 2003;23 it labels the N-terminus of proteins/peptides and ε-amino group of lysine through reductive amination. The reductive dimethylation reaction is rapid and specific23 and has the added advantage that required reagents are commercially available at costs significantly lower than multiplexed chemical labeling reagents.24,25 Like other chemical labeling methods, stable isotope dimethyl labeling is applicable to a wide variety of samples. It was recently used in a large-scale phosphoproteomics study from mouse liver tissues.24 Despite these attractive features, dimethyl labeling has not been as widely adopted as other commercial chemical labeling reagents. We sought to compare the performance of SILAC and stable isotope dimethyl labeling in quantitative proteomics applications.
We first compared the labeling efficiencies of three dimethyl labeling workflows using in-solution labeling23,25 and postlabeling desalting on C18 StageTip26 as well as a modified on-column labeling protocol25 using the C18 StageTip. With our optimized on-StageTip dimethyl-labeling protocol, we used SILAC-labeled HeLa lysate as both source material and internal standards27 to compare the dynamic range of quantification, precision, and repeatability of SILAC and dimethyl labeling. We demonstrate that SILAC provides improved quantification accuracy because it allows combined sample processing in a much earlier stage in the experimental workflow compared with chemical labeling approaches. We compare SILAC- and dimethyl-labeling approaches in biochemical pull-down experiments using an immobilized version of small molecule kinase inhibitor dasatinib as well as a recombinant protein interaction domain (GRB2-SH2) as affinity baits. Our study demonstrates that SILAC and dimethyl labeling have comparable performance in quantitative proteomics applications and highlights specific reasons for choosing one method over another.
Materials and Methods
Cell Culture and SILAC Labeling
HeLa cells were cultured in SILAC Dulbecco’s modified Eagle’s medium (DMEM) as previously described28 at 37 °C, 95% relative humidity, and 5% CO2. SILAC custom DMEM lacking lysine and arginine (Caisson Laboratories, Logan, UT) was supplemented with 10% dialyzed FBS (Sigma) and either light (l-lysine and l-arginine (Fisher)) or heavy ([13C6, 15N2] l-lysine (Sigma-Isotec, St Louis, MO) and [13C6, 15N4] l-arginine (Cambridge Isotope Laboratories (CIL), Andover, MA)) isotope enriched amino acids for at least five cell doublings.
Protein Extraction and Trypsin Digestion
With the exception of the affinity capture experiments, HeLa cells were lysed in 6 M guanidine hydrochloride (Gnd-HCl). Proteins were reduced and alkylated with 1 mM tris(2-carboxyethyl)phosphine (TCEP) and 2 mM chloroacetamide (CAM), then diluted seven-fold with 100 mM triethylammonium bicarbonate (TEAB) (Sigma). Proteins were digested at pH 8.5 with 1:50 (w/w) trypsin (Promega, V5113)/substrate and incubated overnight at 37 °C with shaking. Another portion of 1:50 trypsin/substrate was added to the digests on the following day and incubated for an additional 2 h. Digested peptides were desalted using C18 StageTips.26
Chemical Labeling
The on-column stable isotope dimethyl-labeling protocol25 was adapted to label StageTip-bound peptides with CH2O (Sigma) or C2H2O (CIL). Labeling reagent comprising 17.5 μL of 4% (v/v) CH2O/C2H2O formaldehyde, 17.5 μL of 0.6 M sodium cyanoborohydride (Sigma), 70 μL of 50 mM NaH2PO4 (Fisher), and 245 μL of 50 mM Na2HPO4 (Fisher) was freshly prepared for each sample. Immediately after the C18 StageTip desalting step with 50 μL of StageTip solvent A (5% acetonitrile, 0.1% trifluoroacetic acid in H2O), peptides were labeled by applying 300 μL of labeling reagent to the StageTip and spinning through at ∼2200g for 10 min. The labeling step was followed by a single wash with 100 μL of StageTip solvent A. In-solution stable isotope dimethyl labeling was performed as described.25
Ratio Mixing Experiments
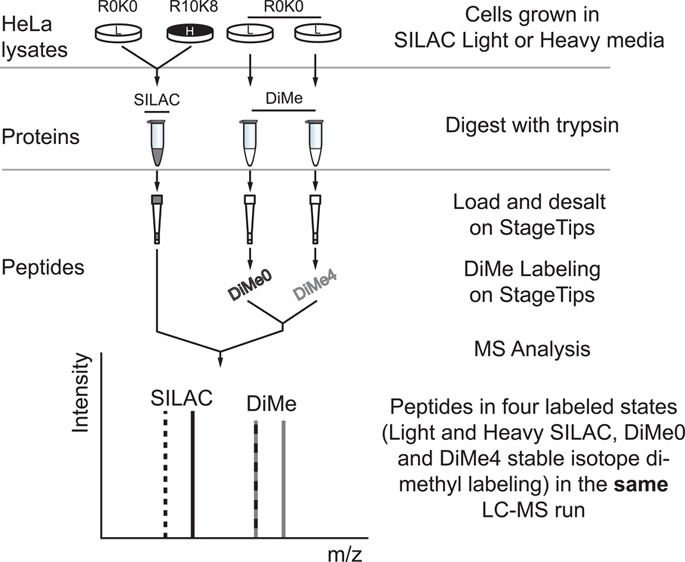
Four populations of HeLa cells were SILAC-labeled and lysed in 6 M Gnd-HCl as previously described. For each mixed ratio experiment, 20 μg of light or heavy protein was reduced, alkylated, and digested and used as a common pool. Two light samples were dimethyl-labeled (either CH2O or C2H2O) on StageTip. After elution from StageTips, peptides were mixed in seven L/H ratios (10:1, 5:1, 2:1, 1:1, 1:2, 1:5, 1:10). For each MS run, at least 0.1 μg of each peptide sample was injected, for example, in ratio 1:10 (L/H), 0.1 μg of light sample was mixed with 1 μg of heavy sample, and in 1:5, 0.1 μg of light sample was mixed with 0.5 μg of heavy sample. Where mentioned in the text, forward and reverse label-swap experiments refer to replicate experiments performed where experimental state and stable isotope labels are swapped to allow systematic errors due to labeling to be identified. SILAC- and dimethyl-labeled samples were then mixed for the combined runs, that is, containing peptides from both labeling approaches or analyzed separately as standalone SILAC or dimethyl-labeling runs, as illustrated in Figure 2A.
Figure 2.

Comparison of protein quantification accuracy and dynamic range of SILAC and dimethyl labeling. (A) Experimental design. Four cell populations were grown separately in SILAC medium, as illustrated. SILAC samples are digested and desalted separately, serving as a control through all stages of sample preparation except for dimethyl labeling step. Samples were analyzed by MS in combined or SILAC/dimethyl labeling (DiMe) separated runs. DiMe0 and DiMe4, dimethyl labeling with CH2O and C2H2O, respectively. (B) Boxplot of log2 ratio of SILAC and dimethyl labeling combined runs. Results are combined from four replicates. Ratios are normalized so that the median of H1:L1s is centered at log21. The quantification ranges of SILAC-labeled peptides and dimethyl-labeled peptides are very similar, and both showed ratio compression. Dotted lines indicate the expected log ratios from log2 10 to log2(1/10).
NanoLC–MS/MS Analysis and Quantification
All samples were unfractionated unless otherwise indicated. Samples were loaded to self-pulled (P2000 Sutter Laser puller, Sutter Instrument, Novato, CA) 360 μm OD × 75 μm ID 10 cm columns with a 10 μm tip and packed with 3 μm Reprosil C18 resin (Dr. Maisch, Germany) using a pressure cell (NextAdvance, Averill Park, NY). Peptides were analyzed with 90 min gradients of 3–35% acetonitrile at 200 nL/min nanoLC–MS (Thermo Dionex RSLCnano, Sunnyvale, CA) on an Orbitrap Elite (Thermo, Bremen Germany). Orbitrap FTMS spectra (R = 30 000 at 400 m/z; m/z 350–1600; 3e6 target; max 500 ms ion injection time) and Top15 data dependent CID MS/MS spectra (1e4 target; max 250 ms injection time) were collected with dynamic exclusion for 180 s and an exclusion list size of 500. The normalized collision energy applied for CID was 35% for 10 ms.
Data Analysis
MaxQuant v.1.3.0.529 and the associated Andromeda search engine30 was used to search a Uniprot human database (July 2012 with 88 849 entries). Search parameters used were: Trypsin/P with two missed cleavages, fixed carbamidomethylated cysteines, and oxidized methionines as a variable modification. Initial FTMS and ITMS MS/MS tolerances were set at 20 ppm and 0.5 Da, respectively. Protein and peptide FDRs were 1%, minimum peptide length was seven amino acids, and a minimum of two peptide ratios were required to quantify a protein. Resulting data were analyzed with the Perseus31 and R environments.
GRB2-SH2 Affinity Purification
The SH2 domain (residues 60–152) of Human Growth receptor-bound protein 2 (GRB2) was cloned with a C-terminal FLAG epitope tag in a pET28a vector for bacterial expression. 6xHis-GRB2-SH2-FLAG was expressed by inducing BL21Star cells with 0.1 mM IPTG at 37 °C for 3 h in a shaking incubator at 250 rpm. Expressed protein was purified using standard His-tag purification procedures with NTA-agarose. Cells were sonicated with a microprobe sonicator tip in a buffer containing 500 mM NaCl, 25 mM Tris pH 7.0, 10% glycerol, 5 mM β-mercaptoethanol, and HALT protease inhibitors (Pierce) and centrifuging at 14 000g for 45 min. The supernatant containing the soluble protein was incubated with 200 μL (50% v/v slurry) of NTA-agarose beads (Qiagen) for 1 h in a batch purification. Two washes with 10 bead volumes of wash buffer containing 500 mM NaCl, 25 mM Tris pH 7.0, 5 mM β-mercaptoethanol, and either 10 mM or 25 mM imidazole, pH 7.4 were performed before eluting in buffer containing 200 mM imidazole, pH 7.4. The eluted protein was dialyzed against 50 mM Tris pH 8.0 to remove imidazole. The GRB2-SH2-FLAG bait protein was aliquoted, snap-frozen in liquid nitrogen, and stored at −80 °C.
HeLa cells were cultured in SILAC DMEM medium as previously described. After five cell doublings, cells were washed with PBS and serum-starved for 6 h. After serum starvation, the cells were stimulated with 150 ng/mL of epidermal growth factor (EGF) for 10 min, while the control population was treated with an equal volume of PBS. Cells were lysed with modified RIPA buffer (modRIPA)(50 mM Tris-HCl, pH 7.8, 150 mM NaCl, 1% NP-40, 0.25% sodium deoxycholate, 1× Halt protease inhibitor (Pierce), and 1× Halt phosphatase inhibitor (Pierce)). Equal amounts of light and heavy HeLa lysate were added to 1500 pmol of FLAG-tagged GRB2-SH2 fusion protein immobilized on 70 μL of anti-FLAG M2 Magnetic Beads slurry (50% w/v) (Sigma), respectively. After 90 min on an end-over-end rotator at 4 °C, the beads were washed three times with modRIPA; the first wash was aspirated and discarded; in the second wash, the SILAC samples were combined by resuspending beads in the SILAC heavy tube with 1 mL of modRIPA and transferring the entire volume to the SILAC light tube; this wash was aspirated, and a third and final 1 mL volume of modRIPA was used to wash the combined beads. Bead-bound proteins were reduced and alkylated as previously described, heated to 70 °C in LDS sample buffer (Life Technologies), and resolved on a Bolt 4–12% Bis-Tris Plus Gel (Life Technologies). The gel was stained with Coomassie Blue for 1 h and destained overnight with water. Each sample lane was divided into five slices and cut further into small 1 mm cubes. Gel cubes were destained with 1:1 (v/v) of 50 mM ammonium bicarbonate and ethanol. After destaining, ethanol was used to dehydrate the gel cubes. Proteins were digested with trypsin (13 ng/μL) in triethylammonium bicarbonate overnight. In-gel digestion was performed as previously described.32 Desalting, reductive dimethyl labeling, and LC–MS/MS analysis were performed as previously described.
Dasatinib Affinity Purification
Dasatinib affinity bait was synthesized as described.33 HeLa lysates were prepared as described in the GRB2-SH2 domain pull-down (above). Lysates were preincubated with DMSO (control) or a dasatinib solution in DMSO (competitor, 50 μM, final) for 20 min at 4 °C on an end-over-end rotator. A 50% (v/v) bead slurry of the dasatinib affinity matrix (∼50 μM immobilized dasatinib final) was then added to both tubes of control and soluble dasatinib-treated lysates. The mixtures were mixed in an end-over-end rotator at 4 °C for 3 h. Pull-downs were washed with buffer containing 50 mM Tris-HCl, pH 7.8, and 150 mM NaCl, as previously described. Light and heavy SILAC samples were first washed separately with 1 mL of modRIPA to remove most of the soluble competitor. Beads from the SILAC light and heavy samples were then combined in the second wash and processed as a single sample thereafter. Note that stable isotope dimethyl-labeling samples were processed separately until after the chemical labeling step. Captured proteins were reduced (1 mM TCEP) and alkylated (2 mM CAM) on-bead, digested, and desalted on C18 StageTips as described.33 Stable isotope dimethyl labeling was performed on C18 StageTips as previously described. SILAC and stable isotope dimethyl labeling samples were combined and analyzed with LC–MS/MS.
Results
Previous comparisons of different chemical labeling methods to SILAC have analyzed these workflows in separate MS runs22,34 and found chemical isotopic labeling methods to be very comparable to SILAC. Additionally, comparisons with label-free quantification with spectral counts35,36 or extracted MS peak intensities37 have recently been reported. These analytical comparisons may be affected in several stages from the preparation of the peptide sample through to the detection of ions in the mass spectrometer but particularly in sample injection and loading, ionization conditions, and stochastic sampling in data-dependent MS. We decided, therefore, to combine SILAC-labeled and dimethyl-labeled samples for single LC–MS/MS analyses to minimize analytical differences.
Comparing in-Solution and On-StageTip Dimethyl Labeling
We sought to develop a convenient and robust dimethyl-labeling workflow compatible with peptide amounts typical in affinity pull-downs and gel-based separations. Hsu et al.’s original dimethyl-labeling protocol labeled peptides in-solution.23 Boersema et al. subsequently developed protocols for on-column and online labeling of peptides.25 Because each workflow may have varying labeling efficiencies and yields, we compared these different dimethyl labeling workflows for protein identification and quantification.
We prepared a single trypsin digestion of HeLa lysate and divided this into aliquots for technical replicates. Digested proteins were labeled by dimethyl-labeling reagent with two different isotopic compositions (CH2O or C2H2O), and the signal intensities of peptides from different workflows were compared (Figure 1A).
Figure 1.

Comparison of dimethyl labeling workflows. (A) Experimental design. HeLa cells were lysed in 6 M Gnd-HCl and proteins digested with trypsin. The digested peptides were aliquoted into eight tubes as technical replicates for each labeling workflow. Comparisons of two workflows in two-state L/H with label swaps were performed for a total of eight replicate experiments (four “forward” experiments and four “reverse” experiments). Forward experiments are listed. After labeling and desalting, samples were mixed 1:1 and analyzed by MS. (B) Higher peptide intensities observed in nonacidified on-StageTip versus in-solution dimethyl labeling. Median ratios for each replicate are at the bottom of each boxplot. The boxplots were normalized, as we observed a consistent pattern between forward and reverse experiments that is associated with the heavy labeling reagent (log 2 C2H2O/CH2O = 0.0239) but not the workflow (Supplementary Figure 1A in the Supporting Information). This normalization factor was derived from all 24 runs in this data set. (C) Differences in length of peptides observed between workflows. Median numbers of amino acid residues are listed at the bottom of each boxplot.
We observed higher peptide signal intensities in on-StageTip labeled peptides than the in-solution labeled peptides (Supplementary Figure 1A in the Supporting Information). Surprisingly, when comparing the two on-StageTip labeling workflows, we observed slightly higher signal intensity from the nonacidified (pH ∼7.5) samples (Supplementary Figure 1A in the Supporting Information) over the two other samples. We expect that this difference is most likely due to the selectivity of the C18 Empore resin to peptides at different pH. The greatest difference in peptide signals, therefore, was observed when we compared on-StageTip labeling without acidification to in-solution labeling (Figure 1B).
Because we observed differences in peptide intensities between workflows, we also examined the lengths and hydrophobicities of peptides in our data set that had the largest differences in MS signal. For each MS run, the 500 peptides with highest or lowest ratios represent peptides enriched in the nonacidified on-StageTip labeled workflow over the in-solution labeling workflow, respectively. We found that peptides enriched in nonacidified on-StageTip labeled samples were higher in intensity (Figure 1B), longer (Figure 1C), and more hydrophobic (Supplementary Figure 1C in the Supporting Information) than acidified on-StageTip or in-solution labeling. In general, we recommend the on-StageTip labeling protocols for their convenience and because we observed equivalent, or even slightly better yields than in-solution labeling (Supplemental Figure 1A in the Supporting Information). We used the nonacidified on-StageTip labeling workflow for the experiments described in this paper.
Quantification Accuracy and Dynamic Range of Dimethyl Labeling
We designed the experiment illustrated in Figure 2A to compare quantitative performance of SILAC and stable isotope dimethyl labeling. Cell lysates were prepared from four populations of SILAC-labeled HeLa (3 light: R0K0 and 1 heavy: R10K8). The lysates were digested separately with trypsin and desalted with StageTips. Two of the light StageTip bound peptides (R0K0) were further labeled with dimethyl labeling. After elution from the StageTips, peptides were mixed at seven different ratios (from L/H 10:1–1:10), as shown in Figure 2A. We analyzed SILAC- and dimethyl-labeled samples in single MS runs to minimize the variables introduced by the MS analyses.
We performed four combined SILAC and dimethyl labeling run experiments, yielding 801 ± 84 and 821 ± 43 proteins quantified for SILAC and dimethyl labeling, respectively. To ensure that increased complexity of the peptide mixture would not affect our measurement of quantitative reproducibility and accuracy, we also ran the same samples separately (Figure 2 and Supplementary Figure 2 in the Supporting Information). We identified a subset of our identified peptides with very low H/L SILAC ratios in SILAC and dimethyl-labeling combined runs (Supplementary Figure 3 in the Supporting Information) and found that these peptides (∼7.5% of all were N-terminal acetylated and contained no lysines) are not labeled in amine-directed labeling strategies and may be wrongly classified as outliers if not appropriately handled in the data set. In agreement with a previous study,34 our results demonstrated a comparable accuracy from the two methods (Figure 2B). The median L/H ratios were very close to the expected ratio for two-fold ratio mixes, but a mild ratio compression was observed at L/H ratios of 5:1 and 1:5. At L/H ratio 10:1 and 1:10, however, the quantification accuracy was severely affected, limiting the dynamic range of both methods to six-fold differences in our analyses with unfractionated whole proteomes. From our analysis of SILAC- and dimethyl-labeled samples in separated runs, we verified that the ratio compression is not due to the single-run approach (Supplementary Figure 2 in the Supporting Information). We and others have previously reported the ratio compression phenomenon in SILAC.35,37,38 Our results demonstrate that dimethyl labeling also suffers from ratio compression and has a similar dynamic range. The compression of stable isotope-labeling ratios is a general feature arising from the complexity of peptide mixtures in LC–MS analyses,39 which is exacerbated by the increased complexity from stable isotope-labeled peptide pairs.16 The application of longer separation gradients or orthogonal peptide fractionation would help to reduce such phenomenon by decreasing interference of quantified peaks from overlapping peptides and hence improving signal-to-noise ratios and quantitative accuracy; for instance, we observed a much wider dynamic range of quantification in our affinity pull-down experiments, described later in this manuscript.
Precision and Repeatability by SILAC and Dimethyl Labeling Quantification
In this study, we define precision as the variability within one experiment and repeatability as replicates performed on different days. It is often thought but has not been definitively shown that SILAC has a better precision and repeatability than chemical labeling methods because its workflow allows the mixing of samples in the stage of intact cells or, more commonly, after protein extraction. In contrast, in chemical labeling methods, samples can only be combined after the label incorporation step, which is typically at the peptide level. The combined processing of SILAC-labeled samples at the intact protein level means that losses from sample handling affect all protein populations simultaneously. Because of that, metabolic labeling workflows should therefore be less prone to quantification inaccuracies and would be more reproducible when compared with chemical labeling workflows.
We wanted to directly compare the effect of the stage of sample mixing in SILAC- and dimethyl-labeling workflows on the precision and repeatability in quantitative proteomics applications using the experiment illustrated in Figure 3A. To reduce biological variability, we prepared a single batch of HeLa lysate, which was used for three experimental replicates performed on different days. For each experiment, four separate trypsin digestions were prepared from the lysate. This experimental design results in 12 sets of data (Figure 3 and Supplementary Figure 4 in the Supporting Information). To show the effects of mixing of samples early or late in the sample processing, we also processed a set of SILAC samples using the dimethyl-labeling workflow (cSILAC in Figure 3). Furthermore, to ensure that the differences between SILAC and cSILAC are not due to variables introduced in separated MS runs, we mixed the same preparation of dimethyl-labeled samples to SILAC and cSILAC runs (DiMe and cDiMe in Figure 3, respectively). As shown in Figure 3B,C, the quantitative precision is improved when samples can be mixed before trypsin digestion (s.d. of log2 SILAC ratio is 0.175 in contrast with 0.255, 0.317, and 0.324 of cSILAC, DiMe, and cDiMe, respectively). However, it should be noted that even though the chemical-labeling workflow leads to a lower precision in quantification, the first and third quartiles or 68% of the quantified peptide ratios are within 10% of the mixing ratio, which is still well within the typical quantitative errors (<20–25% CV) observed in targeted MS assays.40 Surprisingly, repeatability of the SILAC workflow is nearly four times better than the chemically labeling workflow (Figure 3D, s.d. of SILAC = 0.0591 vs 0.204, 0.173, and 0.201 of cSILAC, DiMe, and cDiMe, respectively). We demonstrate, therefore, that SILAC improves the precision and repeatability of quantification, which can provide more confidence in interpreting quantitative proteomics experiments (discussed later in this paper).
Figure 3.

Comparison of precision and repeatability. (A) Experimental design. Four individual digestions were set up for each sample as illustrated. The full experiment was repeated in triplicate, producing 12 data points for each quantification mode considered. cSILAC denotes SILAC-labeled cells processed as in chemical labeling workflow, where samples were mixed after desalting on StageTips. (a,b) Steps where error was introduced in cSILAC and dimethyl labeling and error introduced in dimethyl labeling only, respectively. Precision (B and C) and repeatability (D) of SILAC workflow is higher than the chemical labeling workflow. (B) Peptide and (C) protein ratios from each experiment were normalized so that the medians are centered at Log2 1. Normalized ratios from the triplicate experiments were combined and illustrated in the boxplot. cSILAC and SILAC samples mixed after elution from StageTip. DiMe and cDiMe represent the same dimethyl-labeled peptide sample mixed with SILAC and cSILAC sample, respectively. (D) Repeatability. Each point represents the median protein ratio from each MS run. Replicates indicate the experiments performed on different days. s.d., standard deviation; n, number of peptides or proteins in the sample.
Effects of Dimethyl Labeling
During our analyses, we consistently observed higher numbers of peptides and proteins identified in SILAC-labeled samples than in dimethyl-labeled samples. We analyzed the experimental data from the “Precision and Repeatability Experiments” to better understand this observation. We identified a total of 4106 unique peptides in SILAC samples but only 3181 unique peptides in dimethyl-labeled samples or a ∼23% loss in number of peptide identifications from dimethyl-labeled samples (Figure 4A). A similar result was also observed in the experiment comparing dimethyl-labeled samples with SILAC samples mixed after StageTip desalting (cSILAC, Figure 4A) where we identified 3965 cSILAC peptides and 3155 dimethyl-labeled peptides, representing a ∼20% reduction in peptide identifications.
Figure 4.

More hydrophilic peptides are identified in SILAC samples. (A) Venn diagrams of unique peptides combined from three replicates (experiment described in Figure 3A). SILAC samples and cSILAC samples have 793 (26%) and 678 (23%) more peptides than DiMe samples and cDiMe samples, respectively. (B) Boxplots of hydrophobicity scale of peptides. For each peptide, hydrophobicity coefficients of amino acids measured in C18 were added up to assign hydrophobicity scale.45 Peptides were grouped according to the Venn diagram in panel A. Medians between groups were compared, and the p value of Welch’s t test was calculated. Medians of each group are listed under the boxplot.
One possible explanation for the fewer peptides identified in dimethyl-labeled samples is that the extra step causes loss of peptide, leading to lower peptide ion abundances and hence fewer precursors detected and sampled by the mass spectrometer. We calculated the log2 of peptide signal intensities of common peptides identified from SILAC- and dimethyl-labeled samples (peptide intensity dimethyl labeling/peptide intensity SILAC) and compared the median of the log ratios to zero (dimethyl labeling/SILAC 1:1). We found that the signal intensity from dimethyl-labeled samples is 5% lower (p = 6.36 × 10⁻¹⁰) than that of SILAC samples (Supplementary Figure 5A in the Supporting Information).
We believe that the 5% decrease in signal intensity of the peptides common to SILAC and dimethyl labeling would not explain the 20% fewer peptide identifications. So we compared the properties of peptides that are specific to either SILAC- or dimethyl-labeled samples. We compared peptide properties including hydrophobicity,41−45 partition energy,46 mass, length, and transfer free energy47 of these peptides (Supplementary Figure 5B,C in the Supporting Information). We found differences in peptide mass, length, transfer free energy, partition energy, and most prominently, hydrophobicity.
We compared the hydrophobicity of peptides using the C18 RP-HPLC indices from Wilce (Figure 4B).45 We found that peptides enriched in SILAC samples are significantly more hydrophilic than dimethyl-labeled peptides (p ≤ 1 × 10⁻⁵, Welch’s two sample t test). We observed the same difference in hydrophobicity in the pair of cSILAC- and dimethyl-labeled samples (Figure 4B), suggesting that the dimethyl-labeling step may cause the loss of hydrophilic peptides. We also observed these differences in peptide hydrophobicity using alternate hydrophobicity indices from other research groups (Supplementary Figure 5C in the Supporting Information).41−45
Comparing SILAC and Dimethyl Labeling in Affinity Pull-Down Experiments
Affinity bait enrichment combining MS-based quantitative proteomics is a very sensitive and specific approach for identification of bait-interacting proteins. The bait molecule in affinity bait experiments can be small molecule,32 peptide, protein,48 or nucleic acid.49
We wanted to examine the impact of using SILAC or dimethyl labeling for proteomics applications using affinity bait pull-down experiments with bait molecules that have well-characterized targets: (1) the small molecule kinase inhibitor dasatinib (Figure 5)50−52 and (2) the SH2 domain of GRB2 (Supplementary Figure 6 in the Supporting Information).48,53,54 We identified known bait-interacting proteins with both SILAC and dimethyl labeling in both pull-down experiments.
Figure 5.

Dasatinib pull-down. (A) Experimental design of “forward” experiment. Four populations of HeLa cells were grown in SILAC medium. Dasatinib was immobilized to carboxy-functionalized sepharose beads. Dasatinib (soluble competitor) or DMSO alone (vehicle control) was added to HeLa cell lysate before affinity enrichment. Captured proteins were digested on-bead. Trypsin-digested peptides were desalted on StageTips. Respective samples were labeled with dimethyl labeling. SILAC- and dimethyl-labeled samples were mixed and analyzed by MS. (B) Scatterplot of protein ratios from the “forward” and “reverse” replicates of a label swap experiment. (C, top) Number of identified peptides from SILAC- and dimethyl-labeled samples. (C, bottom) Percent sequence coverage of quantified dasatinib targets.
In the dasatinib experiment, we were able to quantify 286 and 250 proteins with SILAC and dimethyl labeling, respectively. Out of more than 40 known targets of dasatinib,50 SILAC and dimethyl labeling led to quantification of 14 and 15 protein targets in HeLa cells, respectively. In addition to the direct target of the small molecule, interacting proteins of ILK (α-parvin/PARVA, PINCH1/LIMS1, and RSU1)55−57 were also quantified by both methods. Sequence coverage of targets was similar in both SILAC-labeled and dimethyl-labeled samples (Figure 5C and Supplementary Figure 6C in the Supporting Information), suggesting the lowered peptide identification by dimethyl labeling has a minimum impact on the quantification of enriched target proteins in samples of lower peptide complexity. We observed, however, that the lower precision of dimethyl labeling leads to a wider distribution of nonspecific proteins when compared with SILAC (Figure 5C). A wider distribution of protein ratios for nonspecific proteins may negatively impact the identification of specific targets of the affinity bait.58 Furthermore, experimental outliers such as keratin contaminants (with low SILAC H/L ratios) or sample “carryover” from the LC system can be easily detected in label-swap experiments with SILAC because they originate from an non-SILAC-labeled source and their H/L ratios remain low in both label-swap replicates (points marked ‘+’ in scatterplot, Figure 5B). Such contaminants would be labeled in chemical labeling approaches and would not be distinguishable from indigenous proteins in the sample; note that the proteins marked ‘+’ in the SILAC experiment, as obvious outliers are now detected within the experimental group in the dimethyl-labeling experiment in the lower panel of Figure 5B.
In the GRB2-SH2 pull-down, HeLa cells were treated with EGF or PBS (control). Captured proteins were resolved by SDS-PAGE; SILAC samples were combined and run in a single lane, while samples for dimethyl labeling were run in separate lanes. The samples were fractionated by slicing the gel lanes into slices of similar staining intensity. For dimethyl-labeled samples, we tried our best to cut bands of equal size between lanes for comparison, and proteins were digested in-gel before dimethyl labeling on a C18 StageTip. Our SILAC- and dimethyl-labeling experiments quantified 171 and 165 proteins, respectively, with 118 proteins in common. EGFR and SHC1 were identified as GRB2-SH2 domain interacting proteins in both methods. Although our previous experiments indicate that the dynamic range of peptide quantification in both SILAC and dimethyl labeling is limited in complex peptide mixtures (Figure 2B), we note that in affinity capture experiments with an enriched subproteome, both methods are capable of quantifying abundance changes of up to 16-fold (Figure 5B and Supplementary Figure 6B in the Supporting Information).
To our knowledge, this is the first application of dimethyl labeling applied to in-gel proteolytic digestion in quantitative proteomics; this indicates that dimethyl labeling can be a convenient way to quantify protein abundance differences from gel-separated samples after the fact, even if this was not part of the original experiment design.
Discussion
SILAC has been rapidly adopted as an approach in MS-based proteomics because of its simple and robust performance. As a metabolic labeling approach, however, its use is mostly constrained to cell culture systems. Because of the ease of generating stable isotope labeled proteomes, the proteomics community has used it as a spike-in standard59 and for comparing different chemical labeling methods and label-free methods. In our study, we compared SILAC and the chemical labeling method, stable isotope dimethyl labeling, by combining and analyzing these labeled samples in the same nanoLC–MS runs. Our results demonstrate that SILAC and dimethyl labeling achieve comparable quantitative performance. Both methods are affected by ratio compression and have a limited dynamic range; ratios of 1:10 samples were measured ∼1:6, although we note that this issue was exacerbated by the use of unfractionated whole proteome analyses, and we demonstrate that the dynamic range can be improved by orthogonal fractionation steps prior to MS analysis.
Under our experimental conditions, dimethyl-labeled peptides had decreased peptide signal intensity than SILAC-labeled peptides. We also observed a reduced number of peptides and proteins identified in dimethyl-labeled samples. By comparing the properties of peptides differentially enriched between SILAC- and dimethyl-labeled samples, we observed that dimethyl labeling resulted in diminished recovery of hydrophilic peptides.
The greatest advantage of SILAC over chemical-labeling methods is that samples can be mixed in an early stage during the sample processing. Theoretically, the SILAC workflow reduces both sample loss and variability from sample processing, leading to a higher precision and repeatability in SILAC than chemical-labeling methods. By comparing SILAC samples mixed in different stages of the proteomic processing workflow, we show that sample mixing at an early experiment step leads to higher precision and repeatability in quantification. A similar reduction in precision has also been demonstrated in mTRAQ previously.22
We compared SILAC- and dimethyl-labeling in proteomics affinity pull-down experiments with the small-molecule kinase inhibitor, dasatinib, and GRB2-SH2-FLAG fusion protein. We demonstrated that SILAC can facilitate the identification of potential targets due to the tighter distribution of the nonspecific binders. Furthermore, false-positives whose protein ratios do not “flip” in label-swap experiments are easily detected in SILAC but not in dimethyl labeling. We describe our on-StageTip dimethyl-labeling protocol and applied it to in-solution and in-gel protein digests, providing an easy way to incorporate stable isotope label-based quantification in standard gel-based experiments.
Metabolic labeling methods like SILAC allow samples to be combined, even at the level of intact cells, and it is possible to perform complex experimental procedures, like subcellular fractionation, with little detrimental effect on quantitative measurements. The recently developed neutron encoding SILAC approach12 combines the advantages of metabolic labeling with higher multiplexing and has the potential to provide both high quantitative precision and better sensitivity than the original SILAC approach, although it requires a mass spectrometer that can acquire very high-resolution MS scans (R > 480 000) on a time-scale compatible with nanoscale liquid chromatography. We expect that neutron-encoded quantitative proteomics methods will see increased adoption as MS technology advances and costs of neutron encoded reagents fall. Because SILAC cannot be applied as readily in tissue or clinical samples, chemical labeling is a good and practical substitute. We did not compare dimethyl labeling with isobaric chemical tags like iTRAQ or TMT that use reporter-tag-based quantification from MS2 spectra because we reported on the direct comparison of mTRAQ and iTRAQ elsewhere.16 Because there are pros and cons in quantifying stable isotope labeling methods at both the MS1 or MS2 levels, the choice of the quantification method depends on experimental and analytical parameters as well as practical considerations, such as the cost or the type of available MS instrument and downstream data analysis software.
Acknowledgments
We thank other members of the Ong laboratory for helpful discussions. Research reported in this publication was supported by NIAMS and NCI of the National Institutes of Health under award numbers R01AR065459 and R21CA177402, respectively. The content is solely the responsibility of the authors and does not necessarily represent the official views of the National Institutes of Health.
Supporting Information Available
Figure S1. Comparison of peptides in different workflows. Figure S2. Boxplot of log2 ratio of SILAC- and dimethyl-labeling samples analyzed in separated MS runs. Figure S3. Histogram of H/L peptide ratios including N-terminal acetylated peptides. Figure S4. Boxplot of log2 protein ratios for 1:1:1:1 experiment. Figure S5. Comparison of peptide intensities and hydrophobicities between SILAC and stable isotope dimethyl labeling workflows. Figure S6. FLAG-tagged GRB2-SH2 domain pull-down. This material is available free of charge via the Internet at http://pubs.acs.org.
Author Contributions
† H.-T.L. and H.W.S. contributed equally.
The authors declare no competing financial interest.
Funding Statement
National Institutes of Health, United States
Supplementary Material
References
- Ong S. E.; Mann M. Mass spectrometry-based proteomics turns quantitative. Nat. Chem. Biol. 2005, 15252–262. [DOI] [PubMed] [Google Scholar]
- Bantscheff M.; Schirle M.; Sweetman G.; Rick J.; Kuster B. Quantitative mass spectrometry in proteomics: a critical review. Anal. Bioanal. Chem. 2007, 38941017–1031. [DOI] [PubMed] [Google Scholar]
- Grossmann J.; Roschitzki B.; Panse C.; Fortes C.; Barkow-Oesterreicher S.; Rutishauser D.; Schlapbach R. Implementation and evaluation of relative and absolute quantification in shotgun proteomics with label-free methods. J. Proteomics 2010, 7391740–1746. [DOI] [PubMed] [Google Scholar]
- Oda Y.; Huang K.; Cross F. R.; Cowburn D.; Chait B. T. Accurate quantitation of protein expression and site-specific phosphorylation. Proc. Natl. Acad. Sci. U. S. A. 1999, 96126591–6596. [DOI] [PMC free article] [PubMed] [Google Scholar]
- Ong S. E.; Blagoev B.; Kratchmarova I.; Kristensen D. B.; Steen H.; Pandey A.; Mann M. Stable isotope labeling by amino acids in cell culture, SILAC, as a simple and accurate approach to expression proteomics. Mol. Cell. Proteomics 2002, 15376–386. [DOI] [PubMed] [Google Scholar]
- Zhu H.; Pan S.; Gu S.; Bradbury E. M.; Chen X. Amino acid residue specific stable isotope labeling for quantitative proteomics. Rapid Commun. Mass Spectrom. 2002, 16222115–2123. [DOI] [PubMed] [Google Scholar]
- Jiang H.; English A. M. Quantitative analysis of the yeast proteome by incorporation of isotopically labeled leucine. J. Proteome Res. 2002, 14345–350. [DOI] [PubMed] [Google Scholar]
- Kruger M.; Moser M.; Ussar S.; Thievessen I.; Luber C. A.; Forner F.; Schmidt S.; Zanivan S.; Fassler R.; Mann M. SILAC mouse for quantitative proteomics uncovers kindlin-3 as an essential factor for red blood cell function. Cell 2008, 1342353–364. [DOI] [PubMed] [Google Scholar]
- Looso M.; Borchardt T.; Kruger M.; Braun T. Advanced identification of proteins in uncharacterized proteomes by pulsed in vivo stable isotope labeling-based mass spectrometry. Mol. Cell. Proteomics 2010, 961157–1166. [DOI] [PMC free article] [PubMed] [Google Scholar]
- Fredens J.; Engholm-Keller K.; Giessing A.; Pultz D.; Larsen M. R.; Hojrup P.; M?ller-Jensen J.; Faergeman N. J. Quantitative proteomics by amino acid labeling in C. elegans. Nat. Methods 2011, 810845–847. [DOI] [PubMed] [Google Scholar]
- Westman-Brinkmalm A.; Abramsson A.; Pannee J.; Gang C.; Gustavsson M. K.; von Otter M.; Blennow K.; Brinkmalm G.; Heumann H.; Zetterberg H. SILAC zebrafish for quantitative analysis of protein turnover and tissue regeneration. J. Proteomics 2011, 752425–434. [DOI] [PubMed] [Google Scholar]
- Hebert A. S.; Merrill A. E.; Bailey D. J.; Still A. J.; Westphall M. S.; Strieter E. R.; Pagliarini D. J.; Coon J. J. Neutron-encoded mass signatures for multiplexed proteome quantification. Nat. Methods 2013, 104332–334. [DOI] [PMC free article] [PubMed] [Google Scholar]
- Zhang G.; Fenyo D.; Neubert T. A. Evaluation of the variation in sample preparation for comparative proteomics using stable isotope labeling by amino acids in cell culture. J. Proteome Res. 2009, 831285–1292. [DOI] [PMC free article] [PubMed] [Google Scholar]
- Ross P. L.; Huang Y. N.; Marchese J. N.; Williamson B.; Parker K.; Hattan S.; Khainovski N.; Pillai S.; Dey S.; Daniels S.; Purkayastha S.; Juhasz P.; Martin S.; Bartlet-Jones M.; He F.; Jacobson A.; Pappin D. J. Multiplexed protein quantitation in Saccharomyces cerevisiae using amine-reactive isobaric tagging reagents. Mol. Cell. Proteomics 2004, 3121154–1169. [DOI] [PubMed] [Google Scholar]
- Thompson A.; Schafer J.; Kuhn K.; Kienle S.; Schwarz J.; Schmidt G.; Neumann T.; Johnstone R.; Mohammed A. K.; Hamon C. Tandem mass tags: a novel quantification strategy for comparative analysis of complex protein mixtures by MS/MS. Anal. Chem. 2003, 7581895–1904. [DOI] [PubMed] [Google Scholar]
- Mertins P.; Udeshi N. D.; Clauser K. R.; Mani D. R.; Patel J.; Ong S. E.; Jaffe J. D.; Carr S. A. iTRAQ labeling is superior to mTRAQ for quantitative global proteomics and phosphoproteomics. Mol. Cell. Proteomics 2012, 116M111014423. [DOI] [PMC free article] [PubMed] [Google Scholar]
- Shirran S. L.; Botting C. H. A comparison of the accuracy of iTRAQ quantification by nLC-ESI MSMS and nLC-MALDI MSMS methods. J. Proteomics 2010, 7371391–1403. [DOI] [PMC free article] [PubMed] [Google Scholar]
- Ow S. Y.; Salim M.; Noirel J.; Evans C.; Rehman I.; Wright P. C. iTRAQ underestimation in simple and complex mixtures: ″the good, the bad and the ugly″. J. Proteome Res. 2009, 8115347–5355. [DOI] [PubMed] [Google Scholar]
- Bantscheff M.; Boesche M.; Eberhard D.; Matthieson T.; Sweetman G.; Kuster B. Robust and sensitive iTRAQ quantification on an LTQ Orbitrap mass spectrometer. Mol. Cell. Proteomics 2008, 791702–1713. [DOI] [PMC free article] [PubMed] [Google Scholar]
- Ting L.; Rad R.; Gygi S. P.; Haas W. MS3 eliminates ratio distortion in isobaric multiplexed quantitative proteomics. Nat. Methods 2011, 811937–940. [DOI] [PMC free article] [PubMed] [Google Scholar]
- Wenger C. D.; Lee M. V.; Hebert A. S.; McAlister G. C.; Phanstiel D. H.; Westphall M. S.; Coon J. J. Gas-phase purification enables accurate, multiplexed proteome quantification with isobaric tagging. Nat. Methods 2011, 811933–935. [DOI] [PMC free article] [PubMed] [Google Scholar]
- Oppermann F. S.; Klammer M.; Bobe C.; Cox J.; Schaab C.; Tebbe A.; Daub H. Comparison of SILAC and mTRAQ Quantification for Phosphoproteomics on a Quadrupole Orbitrap Mass Spectrometer. J. Proteome Res. 2013, 1294089–5100. [DOI] [PubMed] [Google Scholar]
- Hsu J. L.; Huang S. Y.; Chow N. H.; Chen S. H. Stable-isotope dimethyl labeling for quantitative proteomics. Anal. Chem. 2003, 75246843–6852. [DOI] [PubMed] [Google Scholar]
- Wilson-Grady J. T.; Haas W.; Gygi S. P. Quantitative comparison of the fasted and re-fed mouse liver phosphoproteomes using lower pH reductive dimethylation. Methods 2013, 613277–286. [DOI] [PubMed] [Google Scholar]
- Boersema P. J.; Raijmakers R.; Lemeer S.; Mohammed S.; Heck A. J. Multiplex peptide stable isotope dimethyl labeling for quantitative proteomics. Nat. Protoc 2009, 44484–494. [DOI] [PubMed] [Google Scholar]
- Rappsilber J.; Mann M.; Ishihama Y. Protocol for micro-purification, enrichment, pre-fractionation and storage of peptides for proteomics using StageTips. Nat. Protoc 2007, 281896–1906. [DOI] [PubMed] [Google Scholar]
- Ong S. E. Whole proteomes as internal standards in quantitative proteomics. Genome Med. 2010, 2749. [DOI] [PMC free article] [PubMed] [Google Scholar]
- Ong S. E.; Mann M. A practical recipe for stable isotope labeling by amino acids in cell culture (SILAC). Nat. Protoc 2006, 162650–2660. [DOI] [PubMed] [Google Scholar]
- Cox J.; Mann M. MaxQuant enables high peptide identification rates, individualized p.p.b.-range mass accuracies and proteome-wide protein quantification. Nat. Biotechnol. 2008, 26121367–1372. [DOI] [PubMed] [Google Scholar]
- Cox J.; Neuhauser N.; Michalski A.; Scheltema R. A.; Olsen J. V.; Mann M. Andromeda: a peptide search engine integrated into the MaxQuant environment. J. Proteome Res. 2011, 1041794–1805. [DOI] [PubMed] [Google Scholar]
- Cox J.; Mann M. 1D and 2D annotation enrichment: a statistical method integrating quantitative proteomics with complementary high-throughput data. BMC Bioinformatics 2012, 13Suppl 16S12. [DOI] [PMC free article] [PubMed] [Google Scholar]
- Ong S. E.; Schenone M.; Margolin A. A.; Li X.; Do K.; Doud M. K.; Mani D. R.; Kuai L.; Wang X.; Wood J. L.; Tolliday N. J.; Koehler A. N.; Marcaurelle L. A.; Golub T. R.; Gould R. J.; Schreiber S. L.; Carr S. A. Identifying the proteins to which small-molecule probes and drugs bind in cells. Proc. Natl. Acad. Sci. U. S. A. 2009, 106124617–4622. [DOI] [PMC free article] [PubMed] [Google Scholar]
- Golkowski M.; Brigham J. L.; Perera G. K.; Romano G. E.; Maly D. J.; Ong S. E. Rapid profiling of protein kinase inhibitors by quantitative proteomics. MedChemComm 2014, 53363–369. [DOI] [PMC free article] [PubMed] [Google Scholar]
- Altelaar A. F.; Frese C. K.; Preisinger C.; Hennrich M. L.; Schram A. W.; Timmers H. T.; Heck A. J.; Mohammed S. Benchmarking stable isotope labeling based quantitative proteomics. J. Proteomics 2013, 88, 14–26. [DOI] [PubMed] [Google Scholar]
- Asara J. M.; Christofk H. R.; Freimark L. M.; Cantley L. C. A label-free quantification method by MS/MS TIC compared to SILAC and spectral counting in a proteomics screen. Proteomics 2008, 85994–999. [DOI] [PubMed] [Google Scholar]
- Collier T. S.; Randall S. M.; Sarkar P.; Rao B. M.; Dean R. A.; Muddiman D. C. Comparison of stable-isotope labeling with amino acids in cell culture and spectral counting for relative quantification of protein expression. Rapid Commun. Mass Spectrom. 2011, 25172524–2532. [DOI] [PubMed] [Google Scholar]
- Merl J.; Ueffing M.; Hauck S. M.; von Toerne C. Direct comparison of MS-based label-free and SILAC quantitative proteome profiling strategies in primary retinal Muller cells. Proteomics 2012, 12121902–1911. [DOI] [PubMed] [Google Scholar]
- Ong S. E.; Kratchmarova I.; Mann M. Properties of 13C-substituted arginine in stable isotope labeling by amino acids in cell culture (SILAC). J. Proteome Res. 2003, 22173–181. [DOI] [PubMed] [Google Scholar]
- Michalski A.; Cox J.; Mann M. More than 100,000 detectable peptide species elute in single shotgun proteomics runs but the majority is inaccessible to data-dependent LC-MS/MS. J. Proteome Res. 2011, 1041785–1793. [DOI] [PubMed] [Google Scholar]
- Carr S. A.; Abbatiello S. E.; Ackermann B. L.; Borchers C.; Domon B.; Deutsch E. W.; Grant R. P.; Hoofnagle A. N.; Huttenhain R.; Koomen J. M.; Liebler D. C.; Liu T.; MacLean B.; Mani D. R.; Mansfield E.; Neubert H.; Paulovich A. G.; Reiter L.; Vitek O.; Aebersold R.; Anderson L.; Bethem R.; Blonder J.; Boja E.; Botelho J.; Boyne M.; Bradshaw R. A.; Burlingame A. L.; Chan D.; Keshishian H.; Kuhn E.; Kinsinger C.; Lee J. S.; Lee S. W.; Moritz R.; Oses-Prieto J.; Rifai N.; Ritchie J.; Rodriguez H.; Srinivas P. R.; Townsend R. R.; Van Eyk J.; Whiteley G.; Wiita A.; Weintraub S. Targeted peptide measurements in biology and medicine: best practices for mass spectrometry-based assay development using a fit-for-purpose approach. Mol. Cell. Proteomics 2014, 133907–917. [DOI] [PMC free article] [PubMed] [Google Scholar]
- Engelman D. M.; Steitz T. A.; Goldman A. Identifying nonpolar transbilayer helices in amino acid sequences of membrane proteins. Annu. Rev. Biophys. Biophys. Chem. 1986, 15, 321–353. [DOI] [PubMed] [Google Scholar]
- Fasman G. D. Protein conformational prediction. Trends Biochem. Sci. 1989, 147295–299. [DOI] [PubMed] [Google Scholar]
- Black S. D.; Mould D. R. Development of hydrophobicity parameters to analyze proteins which bear post- or cotranslational modifications. Anal. Biochem. 1991, 193172–82. [DOI] [PubMed] [Google Scholar]
- Eisenberg D.; Schwarz E.; Komaromy M.; Wall R. Analysis of membrane and surface protein sequences with the hydrophobic moment plot. J. Mol. Biol. 1984, 1791125–142. [DOI] [PubMed] [Google Scholar]
- Wilce M. C. J.; Aguilar M.-I.; Hearn M. T. W. Physicochemical Basis of Amino Acid Hydrophobicity Scales: Evaluation of Four New Scales of Amino Acid Hydrophobicity Coefficients Derived from RP-HPLC of Peptides. Anal. Chem. 1995, 6771210–1219. [Google Scholar]
- Guy H. R. Amino acid side-chain partition energies and distribution of residues in soluble proteins. Biophys. J. 1985, 47161–70. [DOI] [PMC free article] [PubMed] [Google Scholar]
- Simon Z.Quantum Biochemistry and Specific Interactions; Abacus Press: Tunbridge Wells, England, 1976. [Google Scholar]
- Blagoev B.; Kratchmarova I.; Ong S. E.; Nielsen M.; Foster L. J.; Mann M. A proteomics strategy to elucidate functional protein-protein interactions applied to EGF signaling. Nat. Biotechnol. 2003, 213315–318. [DOI] [PubMed] [Google Scholar]
- Wrann C. D.; Eguchi J.; Bozec A.; Xu Z.; Mikkelsen T.; Gimble J.; Nave H.; Wagner E. F.; Ong S. E.; Rosen E. D. FOSL2 promotes leptin gene expression in human and mouse adipocytes. J. Clin. Invest. 2012, 12231010–1021. [DOI] [PMC free article] [PubMed] [Google Scholar]
- Li J.; Rix U.; Fang B.; Bai Y.; Edwards A.; Colinge J.; Bennett K. L.; Gao J.; Song L.; Eschrich S.; Superti-Furga G.; Koomen J.; Haura E. B. A chemical and phosphoproteomic characterization of dasatinib action in lung cancer. Nat. Chem. Biol. 2010, 64291–299. [DOI] [PMC free article] [PubMed] [Google Scholar]
- Lombardo L. J.; Lee F. Y.; Chen P.; Norris D.; Barrish J. C.; Behnia K.; Castaneda S.; Cornelius L. A.; Das J.; Doweyko A. M.; Fairchild C.; Hunt J. T.; Inigo I.; Johnston K.; Kamath A.; Kan D.; Klei H.; Marathe P.; Pang S.; Peterson R.; Pitt S.; Schieven G. L.; Schmidt R. J.; Tokarski J.; Wen M. L.; Wityak J.; Borzilleri R. M. Discovery of N-(2-chloro-6-methyl- phenyl)-2-(6-(4-(2-hydroxyethyl)- piperazin-1-yl)-2-methylpyrimidin-4- ylamino)thiazole-5-carboxamide (BMS-354825), a dual Src/Abl kinase inhibitor with potent antitumor activity in preclinical assays. J. Med. Chem. 2004, 47276658–6661. [DOI] [PubMed] [Google Scholar]
- Shah N. P.; Tran C.; Lee F. Y.; Chen P.; Norris D.; Sawyers C. L. Overriding imatinib resistance with a novel ABL kinase inhibitor. Science 2004, 3055682399–401. [DOI] [PubMed] [Google Scholar]
- Batzer A. G.; Rotin D.; Urena J. M.; Skolnik E. Y.; Schlessinger J. Hierarchy of binding sites for Grb2 and Shc on the epidermal growth factor receptor. Mol. Cell. Biol. 1994, 1485192–5201. [DOI] [PMC free article] [PubMed] [Google Scholar]
- Zheng Y.; Zhang C.; Croucher D. R.; Soliman M. A.; St-Denis N.; Pasculescu A.; Taylor L.; Tate S. A.; Hardy W. R.; Colwill K.; Dai A. Y.; Bagshaw R.; Dennis J. W.; Gingras A. C.; Daly R. J.; Pawson T. Temporal regulation of EGF signalling networks by the scaffold protein Shc1. Nature 2013, 4997457166–271. [DOI] [PMC free article] [PubMed] [Google Scholar]
- Dougherty G. W.; Chopp T.; Qi S. M.; Cutler M. L. The Ras suppressor Rsu-1 binds to the LIM 5 domain of the adaptor protein PINCH1 and participates in adhesion-related functions. Exp. Cell Res. 2005, 3061168–179. [DOI] [PubMed] [Google Scholar]
- Tu Y.; Huang Y.; Zhang Y.; Hua Y.; Wu C. A new focal adhesion protein that interacts with integrin-linked kinase and regulates cell adhesion and spreading. J. Cell Biol. 2001, 1533585–598. [DOI] [PMC free article] [PubMed] [Google Scholar]
- Tu Y.; Li F.; Goicoechea S.; Wu C. The LIM-only protein PINCH directly interacts with integrin-linked kinase and is recruited to integrin-rich sites in spreading cells. Mol. Cell. Biol. 1999, 1932425–2434. [DOI] [PMC free article] [PubMed] [Google Scholar]
- Margolin A. A.; Ong S. E.; Schenone M.; Gould R.; Schreiber S. L.; Carr S. A.; Golub T. R. Empirical Bayes analysis of quantitative proteomics experiments. PLoS One 2009, 410e7454. [DOI] [PMC free article] [PubMed] [Google Scholar]
- Geiger T.; Cox J.; Ostasiewicz P.; Wisniewski J. R.; Mann M. Super-SILAC mix for quantitative proteomics of human tumor tissue. Nat. Methods 2010, 75383–385. [DOI] [PubMed] [Google Scholar]
Associated Data
This section collects any data citations, data availability statements, or supplementary materials included in this article.